REVIEW 3 major objections 6 minor 45 references
Exocomets of $\beta$ Pictoris I: Exocomet destruction, sodium and disk line variability in 17 years of HARPS observations
T0 review · 3 major / 6 minor · reviewed 2026-08-07 · deepseek-v4-flash
Pith's one-line read Sodium absorption from beta Pictoris exocomets is almost never observed, and two 2019 Ca II events show sudden non-Keplerian acceleration that the paper interprets as comet nuclei breaking apart after periastron.
desk verdict A careful HARPS study that establishes rare, Ca II-linked Na I exocomet absorption, but the 2019 non-Keplerian events are not yet proof of nucleus destruction. read the letter →
The pith
A machine-rendered reading of the paper's core claim, the machinery that carries it, and where it could break.
The reading
What carries the argument
The analysis rests on three working parts. An unbiased reference spectrum is built by taking the 80th percentile of flux values per wavelength channel and correcting the truncation bias with a truncated-normal formula, so that time-variable exocomet absorption is not baked into the baseline; telluric water lines near the sodium doublet are removed before any sodium analysis. Exocomet lines are modeled as homogeneous Gaussian clouds with central optical depth $\tau_0$, a fill factor $f$ for stellar-disk coverage, and doublet oscillator-strength ratio fixed at 2, fitted with an auto-differentiable Bayesian sampler that yields posterior velocities, widths, depths, and accelerations. For the 2019 features, the paper computes families of Keplerian orbits consistent with the early linear acceleration and then compares the later velocity curves against those predictions, so the departure from Keplerian motion is the observable that carries the destruction claim.
What would settle it
A re-analysis of the 2019 nights that models the Ca II disk line as time-variable, allowing its depth, width, and velocity to drift on hour timescales, would settle the destruction claim: if the apparent acceleration reversal and line broadening disappear once the disk line is free to vary, they are disk variability rather than comet fragmentation. Separately, detecting sodium absorption in an exocomet event with only moderate Ca II depth would directly refute the claim that Na I becomes detectable only during the most extreme Ca II outgassing.
Extended reading notes
Core claim
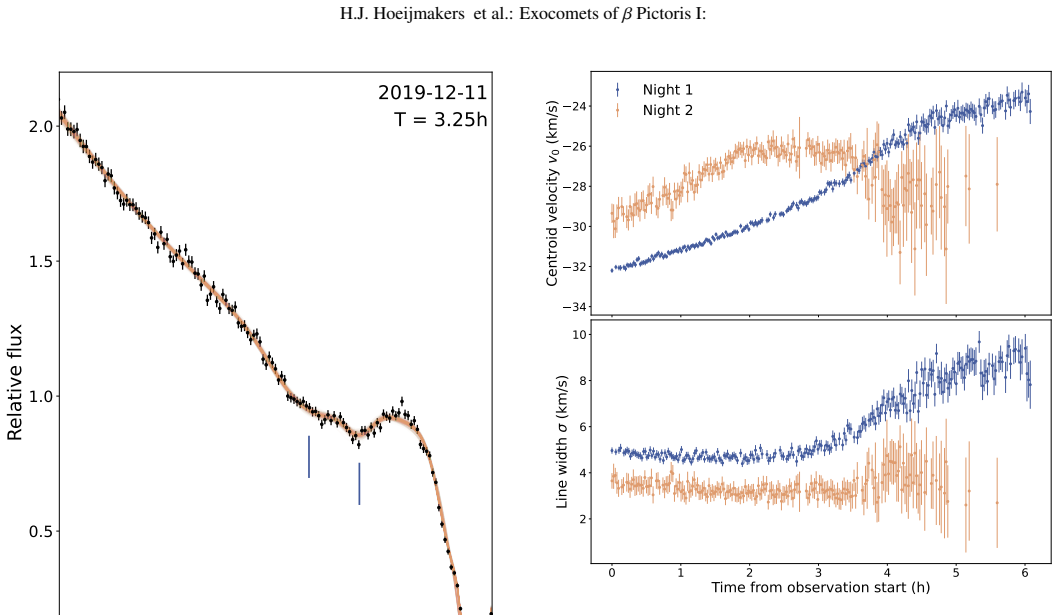
After systematically telluric-correcting 9071 HARPS spectra and calibrating them against an unbiased reference spectrum, the paper finds that exocometary Na I is generally absent: only two nights (March 2008 and March 2009) show clear ~2% absorption in both sodium D lines, plus a ~1% feature persisting ~13 nights in February 2004. In all cases the sodium appears red-shifted at the same radial velocity as exceptionally deep Ca II H&K absorption, so the paper concludes that the Na I is produced by the same evaporating bodies, and that detectable sodium requires the most extreme Ca II outgassing because sodium is otherwise photo-ionized. For the 2019 events, the paper shows two blue-shifted Ca II features on consecutive nights that accelerate roughly linearly at first, then suddenly depart from Keplerian acceleration; one reverses its acceleration within about an hour, and line widths grow simultaneously. The paper hypothesizes this is the final fragmentation of the comet nuclei and blow-out of the Ca II tail shortly after periastron, rather than an egress artifact. It further reports a ~5 km/s blue-shifted Ca II feature persisting from early 2017 to mid-2018 that the classical exocomet model may not explain, and documents Na I disk-line depth variations by more than a factor of two as well as a night where the Ca II disk line narrows and shifts, concluding that the circumstellar disk lines themselves are observably variable.
Load-bearing premise
The load-bearing premise is that the 80th-percentile reference spectrum is a faithful static baseline for the stellar and circumstellar disk lines, so that all residual time-variable absorption can be attributed to exocomets; since the paper itself shows the Na I disk lines vary in depth by more than a factor of two and the Ca II disk line can narrow and shift on a single night, disk variability could contaminate the long-lived 2017-2018 feature and the fitted parameters of the 2019 events.
Editorial extensions
If this is right
- Sodium D-line absorption can be used as a specific diagnostic of the most extreme Ca II-producing exocomets; most exocomet events will be invisible to sodium surveys.
- Multi-species observations of rare deep events can probe the evaporation and ionization structure of exocomet clouds, though abundance ratios will require physical cloud models rather than homogeneous ones.
- The 2019 events imply that stargrazing comets can be destroyed within hours near or after periastron, and that sudden non-Keplerian acceleration with line broadening is a signature of that destruction.
- The long-lived 2017-2018 Ca II feature and the variable disk lines mean that some 'exocomet' absorption may actually be circumstellar disk gas, so future surveys need time-variable disk models.
- If the 2019 pair are on the same orbit, their different behavior after two hours suggests fragmentation is stochastic, not a predictable orbital effect.
Reading between the lines
- If sodium traces only extreme outgassing, comparing Ca II and Na I line depths across a large sample could provide a quantitative threshold for photo-ionization shielding, effectively mapping where in the coma neutral sodium can survive.
- The destruction scenario predicts that some stargrazing exocomets should show a characteristic sequence within a single night: linear acceleration, then a sudden acceleration reversal or jump with line broadening; this sequence could be searched for automatically in other archival time-series of beta Pictoris and of other debris-disk stars.
- The year-long 2017-2018 feature, if it is disk gas, would connect exocomet activity to the slowly varying circumstellar disk and might change how the Falling Evaporating Bodies population is separated from the disk in future analyses.
- A testable extension: re-fit the 2019 nights with a model that lets the disk line parameters vary with time; if the non-Keplerian acceleration survives, the destruction interpretation is strengthened, and if it does not, the event is disk variability.
Editorial analysis
A structured set of objections, weighed in public.
Referee Report
Summary. This paper presents a systematic analysis of 9071 archival HARPS spectra of Beta Pictoris (198 nights, 2003-2020) aimed at finding new exocomet phenomenology in the Ca II H&K lines and the Na I D doublet. The authors apply molecfit-based telluric correction, construct an 80th-percentile reference spectrum with Tikhonov smoothing, and fit the exocomet and disk absorption with a Bayesian multi-component Gaussian model (JAX/NumPyro) with explicit, tabulated priors. The main results are: (i) exocometary Na I absorption is generally absent, with only two ~2%-deep events (March 2008 and March 2009) and a weaker (~1%) feature persisting over 13 nights in February 2004, all coincident in time and radial velocity with exceptionally deep Ca II absorption; (ii) a long-lived blue-shifted Ca II feature near -5 km/s that appears continuously for about a year (2017-2018), which the authors note may be difficult to explain with the classical exocomet picture; and (iii) two blue-shifted, strongly accelerating Ca II features observed on consecutive nights in December 2019 that depart from Keplerian motion, which the authors hypothesize to be evidence for the destruction of the comet nuclei shortly after periastron passage. The paper also documents significant variability in the Na I and Ca II disk lines that complicates the reference-spectrum approach.
Significance. If the results hold, this is a valuable contribution to exocomet studies. The Na I rarity result constrains photoionization and sublimation models, and the simultaneous Na I + Ca II detections provide a physical link between extreme outgassing and detectable neutral sodium that goes beyond the classical Falling Evaporating Bodies framework. The reported disk-line variability is an important caution for the common percentile-based reference-spectrum methodology, and the long-lived 2017-2018 feature challenges existing models. The fragmentation scenario for the 2019 events, with its analogy to Kreutz-family sungrazers such as comet Lovejoy, is an intriguing and falsifiable hypothesis. The paper's strengths include its unusually large and uniform dataset (9071 spectra over 17 years), the systematic telluric correction, transparent Bayesian fits with explicit priors (Tables A.1, A.2), and the authors' own candid statements about the limitations of the reference-spectrum assumption.
major comments (3)
- [Section 3.2, Figs. 8-10] The central novel claim - that the 2019 features depart from Keplerian motion because the comet nuclei fragmented - rests entirely on the fitted centroid v0 of single-Gaussian fits to a blended, time-varying absorption region. The paper itself introduces a second static component near -39 km/s on night 2 (Fig. 9), omits unstable fits at the end of that night, and reports a simultaneous dramatic broadening of the line (Fig. 10). A second unresolved or gradually emerging absorption component could shift and broaden the centroid of a single-Gaussian fit without any dynamical acceleration of the absorbing body. The paper's argument against the tail-egress scenario (Section 3.2) does not test this unresolved-blend degeneracy, particularly for night 1 where only one component was fitted. I request a direct test: refit night 1 with a two-component model (or a time-varying blend) and compare the model evidence, and/or show that single-component residuals remain clean throughout the sequence. Without such a test, the attribution of the non-Keplerian departures to nucleus destruction (abstract and Section 4) is not uniquely supported.
- [Sections 2.3, 3.3, Figs. A.4-A.6] The reference spectrum is the baseline against which all time-variable absorption is measured, and the paper itself documents that the disk lines vary substantially: the Na I D2 line depth varies by more than a factor of two (from ~5% to ~13%, Fig. A.4), and the Ca II disk line can be narrower and shifted on a single night (Fig. A.5). The long-lived -5 km/s feature of 2017-2018 (Fig. A.6) sits close to the disk line, exactly where the reference spectrum is least certain, and the authors themselves ask whether it might be 'due to some other component of the circumstellar material' (Section 3.3). The impact of the documented disk-line variability on the parameters of the long-lived feature and on the weaker Na I fits is not quantified. I ask that the reference spectrum be perturbed within its stated 0.5-2% uncertainty (or reconstructed with different percentile thresholds) and that the affected claims be re-derived; this is particularly important because the 2019 features are well separated from the disk line, so the reference-spectrum concern is most acute precisely for the long-lived feature claim, not for the fragmentation claim.
- [Section 3.1, Figs. A.2-A.3] The claim of a 'general absence' of exocometary Na I absorption, with only two clear (~2%) events out of 198 nights, is established by visual inspection of night-averaged spectra with an ad hoc '>~2%' threshold; no per-night detection limit is given. Given that telluric Na I is present at the 1-5% level in 71 of 198 nights (Fig. A.3), that the Na I disk lines vary in depth by more than a factor of two (Fig. A.4), and that the weakest fitted exocomet feature has a constrained line depth of only 0.89 +/- 0.13% (Fig. 7), the sensitivity of the search should be quantified before concluding that Na I is generally absent. A map of the minimum detectable line depth per night (or per epoch) would make the central sodium rarity claim falsifiable and would also justify the statement that the Earth's atmospheric sodium is not being mistaken for exocometary absorption in the remaining nights.
minor comments (6)
- [Section 4] Section 4 states that the two anomalous events were 'observed in 2018', whereas Section 3.2 and the abstract date them to 11 and 12 December 2019; the year should be corrected to 2019.
- [Fig. 6 vs. Section 3.1] The caption of Fig. 6 dates the strongest sodium event to 'March 17 2008', while Section 3.1 and Fig. 5 give 'March 16 2008'; the dates should be reconciled.
- [Abstract] The abstract contains a typo, 'blue-shifted exocomes', which should read 'exocomets'.
- [Section 4, last paragraph] The final paragraph of the conclusions contains a grammatically broken sentence beginning 'We systematically corrected these spectra using Molecfit and that exocometary sodium absorption is relatively rare'; this should be rephrased.
- [Section 3.2] The companion paper is referred to inconsistently as both 'Jaworska et al. in prep.' and 'Jarworska et al. in prep.' within the same section; the spelling should be unified.
- [Fig. 10] The vertical axis of Fig. 10 is labeled 'Centroid velocity v0 (km/s)' with values ranging from about 24 to 34 km/s, while the text quotes the features at approximately -32 km/s; please clarify whether the plotted quantity is |v0| or else correct the sign convention.
Circularity Check
No significant circularity: the derivation chain is self-contained, with the reference-spectrum baseline, Bayesian line fits, and forward orbital model all operating independently of the claims they support.
full rationale
The paper's central claims are not circular. The reference spectrum is an 80th-percentile truncated estimator of the static stellar-plus-disk baseline, constructed from the full dataset, but it is not fitted to the target exocomet features; detections are reported as time-variable residual absorption against that baseline, and the authors explicitly acknowledge that disk-line variability could contaminate long-lived features (e.g., 'whether this feature is due to some other component of the circumstellar material'). The exocomet line parameters are obtained with a Bayesian model with stated priors, including explicit handling of blended components on night 2, so the fitted centroids and widths are not assumed detections. The orbital analysis is a forward calculation: the authors enumerate Keplerian orbits consistent with the observed linear acceleration segment and then compare later data against that family, rather than fitting an orbit to the entire time series and calling the residuals a prediction. The fragmentation hypothesis is presented as an interpretation of the observed non-Keplerian acceleration and line broadening, with the alternative tail-egress scenario explicitly considered and argued against. Self-citations to the authors' earlier work concern data-reduction practices, and the companion paper (Jaworska et al., in prep.) is used only to motivate plausibility of an icy origin, not as the basis for any derived quantity. No fitted parameter is renamed as a prediction, no uniqueness theorem is imported, and no known result is repackaged under new coordinates. The paper is therefore self-contained against external benchmarks for its stated inferences, and the minor year inconsistency between the abstract (2019) and conclusions (2018) is a presentational error, not circularity.
Assumptions & free parameters
free parameters (4)
- Reference spectrum truncation threshold T =
80th percentile of per-channel flux distribution
- Tikhonov regularization strength lambda =
1
- Na I fill fraction f =
1 (fixed)
- Line component count and priors per fit =
3 components for Na I fits; 4 components for Ca II night-2 fits
assumptions (5)
- domain assumption The absorbing exocomet cloud is homogeneous and produces Gaussian line profiles, with the doublet optical depth ratio fixed by oscillator strengths (Eq. 4-6).
- domain assumption The reference spectrum captures the static stellar and disk-line baseline, so residual time-variable absorption can be attributed to exocomets.
- domain assumption Telluric correction with molecfit using 10 water lines adjacent to Na I leaves no significant residuals that mimic exocomet features.
- domain assumption Orbital families are computed under two-body Keplerian motion with inclination i = 0 and longitude of ascending node Omega = 180 degrees.
- domain assumption Uncertainties are photon-noise-limited and equal to the square root of the recorded counts for e2ds spectra.
Cite this review
Pith. "Pith review of Exocomets of $\beta$ Pictoris I: Exocomet destruction, sodium and disk line variability in 17 years of HARPS observations." pith.science (2026). https://pith.science/paper/NTFAMIE2
@misc{pith2026250521625,
  author       = {Pith},
  title        = {Pith review of: Exocomets of $\beta$ Pictoris I: Exocomet destruction, sodium and disk line variability in 17 years of HARPS observations},
  year         = {2026},
  howpublished = {\url{https://pith.science/paper/NTFAMIE2}},
  note         = {Machine review of arXiv:2505.21625}
}
abstract
The young $\beta$ Pictoris system has been monitored with high-resolution optical spectrographs for decades. These observations have revealed strongly variable absorption in the Ca II H\&K lines attributed to in-falling cometary bodies. Since 2003, over 9000 HARPS observations of $\beta$ Pictoris have been taken and many of these have not yet been used for exocomet studies. We search these spectra for new exocomet phenomenology enabled by the long time coverage and large volume of this dataset. We systematically carry out telluric correction of the HARPS spectra using molecfit, compare multi-year observations of the Ca II and Na I lines and use a Bayesian fitting algorithm to extract exocomet line parameters. We explore the usage of an unbiased reference spectrum with which to calibrate the continuum, and investigate Keplerian orbital solutions to observed exocomet acceleration. We find a general absence of exocometary sodium line absorption, with only two instances of clear ($\sim 2$ % deep) exocometary sodium out of 198 nights of observation, as well as a weaker ($\sim 1$ %) feature that persists over 13 nights in 2004. We find that these events occur during times of deep Ca II absorption at the same red-shift, implying that strongly Ca II-evaporating exocomets also exhibit detectable levels of Na I, in spite of the vast majority of Na I being rapidly photo-ionised in close proximity to the star. We find long-lived Ca II absorption in 2017 and 2018 that persists on a timescale of a year, which may be difficult to explain with the classical exocomet model. Finally, we investigate two strongly accelerating, blue-shifted exocomes observed in 2019 that show strong and sudden departures from Keplerian motion, suggesting rapid changes to the dynamics of the exocomet cloud. We hypothesize that this is caused by the destruction of the comet nuclei shortly after their periastron passages.
Figures


Figures from the paper (6 more)



Reference graph
Works this paper leans on
-
[1]
Aumann , H. H. 1985, Publications of the Astronomical Society of the Pacific, 97, 885
work page 1985
-
[2]
Betancourt, M. 2017, The Convergence of Markov chain Monte Carlo Methods : From the Metropolis method to Hamiltonian Monte Carlo
work page 2017
-
[3]
Beust , H., Lagrange , A. M., Crawford , I. A., et al. 1998, , 338, 1015
work page 1998
- [4]
-
[5]
Bingham, E., Chen, J. P., Jankowiak, M., et al. 2018, Pyro: Deep Universal Probabilistic Programming , arXiv:1810.09538
arXiv 2018
-
[6]
2018, JAX : composable transformations of P ython+ N um P y programs
Bradbury, J., Frostig, R., Hawkins, P., et al. 2018, JAX : composable transformations of P ython+ N um P y programs
work page 2018
-
[7]
H., Li , A., Bohac , C., et al
Chen , C. H., Li , A., Bohac , C., et al. 2007, , 666, 466
work page 2007
-
[8]
Chen , C. H., Lu , C. X., Worthen , K., et al. 2024, arXiv e-prints, arXiv:2407.04661
arXiv 2024
Show all 45 references
-
[9]
M., & Vidal-Madjar , A
Ferlet , R., Hobbs , L. M., & Vidal-Madjar , A. 1987, , 185, 267
1987
-
[10]
M., Lagrange-Henri , A
Hobbs , L. M., Lagrange-Henri , A. M., Ferlet , R., Vidal-Madjar , A., & Welty , D. E. 1988, , 334, L41
1988
-
[11]
J., Kitzmann , D., Morris , B
Hoeijmakers , H. J., Kitzmann , D., Morris , B. M., et al. 2024, , 685, A139
2024
-
[12]
J., Seidel , J
Hoeijmakers , H. J., Seidel , J. V., Pino , L., et al. 2020, , 641, A123
2020
-
[13]
2001, , 372, 616
Karmann , C., Beust , H., & Klinger , J. 2001, , 372, 616
2001
-
[14]
2015, , 576, A78
Kausch , W., Noll , S., Smette , A., et al. 2015, , 576, A78
2015
-
[15]
Kennedy , G. M. 2018, , 479, 1997
2018
-
[16]
2014, , 514, 462
Kiefer , F., Lecavelier des Etangs , A., Boissier , J., et al. 2014, , 514, 462
2014
-
[17]
2019, , 621, A58
Kiefer , F., Vidal-Madjar , A., Lecavelier des Etangs , A., et al. 2019, , 621, A58
2019
-
[18]
J., Rodet , L., et al
Lacour , S., Wang , J. J., Rodet , L., et al. 2021, , 654, L2
2021
-
[19]
M., De Bondt , K., Meunier , N., et al
Lagrange , A. M., De Bondt , K., Meunier , N., et al. 2012, , 542, A18
2012
-
[20]
M., Ferlet , R., & Vidal-Madjar , A
Lagrange , A. M., Ferlet , R., & Vidal-Madjar , A. 1987, , 173, 289
1987
-
[21]
M., Kasper , M., Boccaletti , A., et al
Lagrange , A. M., Kasper , M., Boccaletti , A., et al. 2009, , 506, 927
2009
-
[22]
M., Meunier , N., Rubini , P., et al
Lagrange , A. M., Meunier , N., Rubini , P., et al. 2019, Nature Astronomy, 3, 1135
2019
-
[23]
M., Beust , H., Ferlet , R., & Vidal-Madjar , A
Lagrange-Henri , A. M., Beust , H., Ferlet , R., & Vidal-Madjar , A. 1989, , 215, L5
1989
-
[24]
2022, Scientific Reports, 12, 5855
Lecavelier des Etangs , A., Cros , L., H \'e brard , G., et al. 2022, Scientific Reports, 12, 5855
2022
-
[25]
1999, , 343, 916
Lecavelier Des Etangs , A., Vidal-Madjar , A., & Ferlet , R. 1999, , 343, 916
1999
-
[26]
X., Chen , C
Lu , C. X., Chen , C. H., Sargent , B. A., et al. 2022, , 933, 54
2022
-
[27]
& Queloz , D
Mayor , M. & Queloz , D. 1995, , 378, 355
1995
-
[28]
& Takeuchi , T
Murata , K. & Takeuchi , T. T. 2022, , 74, 1329
2022
-
[29]
K., Kataza , H., Honda , M., et al
Okamoto , Y. K., Kataza , H., Honda , M., et al. 2004, , 431, 660
2004
-
[30]
2022, , 660, A49
Pavlenko , Y., Kulyk , I., Shubina , O., et al. 2022, , 660, A49
2022
-
[31]
2002, The Messenger, 110, 9
Pepe , F., Mayor , M., Rupprecht , G., et al. 2002, The Messenger, 110, 9
2002
-
[32]
2019, arXiv preprint arXiv:1912.11554
Phan, D., Pradhan, N., & Jankowiak, M. 2019, arXiv preprint arXiv:1912.11554
2019 arXiv
-
[33]
2006, , 373, 231
Pont , F., Zucker , S., & Queloz , D. 2006, , 373, 231
2006
-
[34]
J., Kitzmann , D., et al
Prinoth , B., Hoeijmakers , H. J., Kitzmann , D., et al. 2022, Nature Astronomy, 6, 449
2022
-
[35]
& Lai , D
Rodet , L. & Lai , D. 2024, , 527, 11664
2024
-
[36]
& Chodas , P
Sekanina , Z. & Chodas , P. W. 2012, , 757, 127
2012
-
[37]
2015, , 576, A77
Smette , A., Sana , H., Noll , S., et al. 2015, , 576, A77
2015
-
[38]
Smith , B. A. & Terrile , R. J. 1984, Science, 226, 1421
1984
-
[39]
Tallis, G. M. 1961, Journal of the Royal Statistical Society: Series B (Methodological), 23, 223
1961
-
[40]
M., Ferlet , R., Gry , C., & Albert , C
Vidal-Madjar , A., Hobbs , L. M., Ferlet , R., Gry , C., & Albert , C. E. 1986, , 167, 325
1986
-
[41]
2024, , 684, A210
Vrignaud , T., Lecavelier des Etangs , A., Kiefer , F., et al. 2024, , 684, A210
2024
-
[42]
A., & Kiefer , F
Vrignaud , T., Lecavelier des Etangs , A., Strom , P. A., & Kiefer , F. 2025, arXiv e-prints, arXiv:2503.17346
2025 arXiv
-
[43]
N., Holman , M
Winn , J. N., Holman , M. J., Torres , G., et al. 2008, , 683, 1076
2008
-
[44]
2021, , 645, A23
Zhao , F., Lo Curto , G., Pasquini , L., et al. 2021, , 645, A23
2021
-
[45]
A., & Kennedy , G
Zieba , S., Zwintz , K., Kenworthy , M. A., & Kennedy , G. M. 2019, , 625, L13
2019
Reviewed August 7, 2026 · model on record in the stance chip above.
Discussion (0). Sign in to comment.