REVIEW 5 major objections 5 minor 35 references
Beyond Single-Channel: Multichannel Signal Imaging for PPG-to-ECG Reconstruction with Vision Transformers
T0 review · 5 major / 5 minor · reviewed 2026-08-07 · deepseek-v4-flash
Pith's one-line read Pulse-signal images cut ECG reconstruction error by up to 29%
desk verdict A genuinely new four-channel image representation for PPG-to-ECG with useful clinical metrics, but the headline gains lean on ECG-derived beat boundaries that a real PPG-only system won't have. read the letter →
The pith
A machine-rendered reading of the paper's core claim, the machinery that carries it, and where it could break.
The reading
What carries the argument
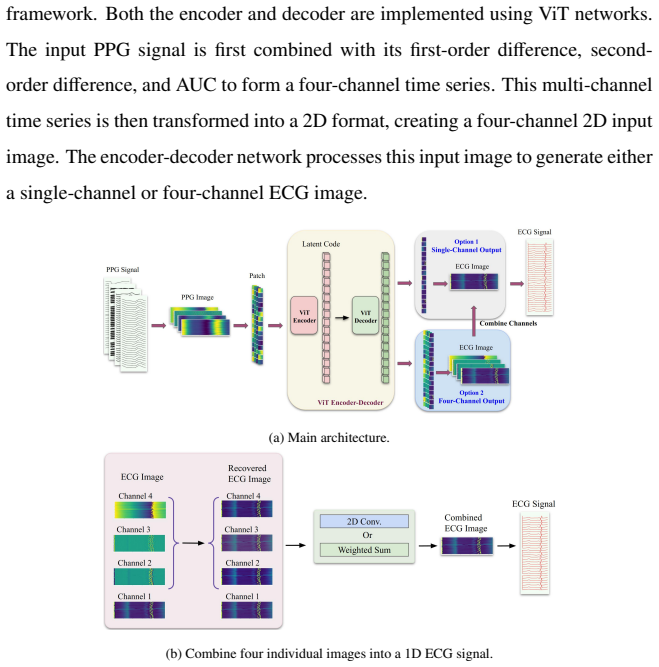
The central object is the four-channel signal image: a tensor of shape 16 beats by 128 samples by 4 channels, built by segmenting the signal into cardiac cycles at R peaks, padding each shorter cycle with values from the subsequent beat, and stacking the raw waveform, first-order difference, second-order difference, and cumulative area under the curve as separate channels. The Vision Transformer splits this image into small patches and treats each patch as a token; self-attention then relates patches across beats and across temporal positions, which is how the model captures both intra-beat morphology and inter-beat variability. Because each 2D patch can span several beats at the same phase of the cycle, the representation gives the attention mechanism something the paper shows a 1D patch-based transformer lacks: direct visual comparison of corresponding waveform segments across consecutive cardiac cycles. The total training loss adds a QRS complex-enhanced term that weights reconstruction errors near R peaks with a Gaussian, keeping the model focused on the most diagnostically critical part of the beat.
What would settle it
Take the trained model and rebuild the PPG input images using beats found by an automatic PPG peak detector while leaving the ECG only for evaluation, then recompute PRD, RMSE, and the four interval metrics on the same BIDMC and CapnoBase records; if the margin over CLEP-GAN disappears or reverses, the headline gain depends on ECG-derived beat alignment rather than on the image representation itself.
Extended reading notes
Core claim
The central claim is that representing PPG as a four-channel image—raw pulse, first-order difference, second-order difference, and cumulative area under the curve, arranged as beat-aligned rows—gives a Vision Transformer enough structure to reconstruct ECG waveforms, including small P and T waves, more accurately than existing 1D convolution approaches. On 30 low-noise records from each of two public datasets with leave-one-out validation, the paper reports PRD of 42.65 versus 71.43 for CLEP-GAN on BIDMC and 53.89 versus 81.04 on CapnoBase, RMSE of 0.253 versus 0.406 and 0.301 versus 0.399, and lower relative errors for PR interval, RT interval, and RT amplitude difference. The one reported exception is a slightly higher QRS area error on CapnoBase. Alongside these comparisons, the paper introduces four clinically motivated metrics—QRS area error, PR interval error, RT interval error, and RT amplitude difference—arguing that waveform reconstruction should be judged by whether diagnostically relevant intervals and amplitudes survive translation, not only by pointwise error.
Load-bearing premise
The load-bearing assumption is that the heartbeat boundaries used to line up the pulse-signal images can be found from the pulse signal alone as reliably as they are found from the paired ECG during training and evaluation, but the paper does not specify or test a pulse-only beat detector.
Editorial extensions
If this is right
- If the reported numbers reproduce, a four-channel ViT encoder-decoder becomes the strongest PPG-to-ECG waveform reconstruction method on these two datasets, ahead of CLEP-GAN on PRD, RMSE, and most of the interval metrics.
- The paper's comparison shows that beat-aligned padding with subsequent-beat values outperforms both zero-padding and direct reshaping, so the beat-stacking procedure itself is part of the claimed gain.
- Adding the four clinical metrics gives later work a way to check P-wave, QRS, and T-wave fidelity instead of relying on global pointwise error, which can hide systematic loss of small waveform features.
- The paper finds that feeding the same four channels to a 1D convolution model degrades its performance, which supports the claim that the benefit comes from combining multi-channel representation with 2D self-attention rather than from the extra channels alone.
Reading between the lines
- A PPG-only deployment would need its own beat detector, and the leave-one-out protocol appears to supply beat boundaries from the paired ECG recordings; part of the 29% PRD gain may therefore not survive automatic PPG peak segmentation.
- The same beat-aligned multi-channel recipe is a natural test on other quasi-periodic physiological signals, such as respiration or arterial blood pressure, where inter-cycle morphology carries clinical information.
- The new metrics depend on peak detection and the evaluation selects low-noise records; adding motion artifacts or baseline wander could shrink the reported advantages in PR, RT, and QRS-area errors.
- The failure of four-channel input to help CLEP-GAN suggests an architecture with long-range attention over beats, rather than local 1D convolutions, is what unlocks the extra channels; a 1D transformer with beat-level patches might capture part of the gain more cheaply.
Editorial analysis
A structured set of objections, weighed in public.
Referee Report
Summary. The manuscript proposes a Vision Transformer (ViT) encoder-decoder for reconstructing ECG from PPG. The input is a four-channel 2D 'signal image' formed by segmenting signals into R-peak-aligned beats, padding shorter beats with subsequent-beat values, and stacking 16 beats per image; the four channels are raw PPG, first-order difference, second-order difference, and cumulative AUC. The authors evaluate on 30-record subsets of BIDMC and CapnoBase with leave-one-out validation, comparing against CLEP-GAN, and introduce four additional clinical interval/amplitude metrics. They report consistent improvements, including 'up to 29% reduction in PRD and 15% reduction in RMSE', and provide ablations on image representation, output combination, losses, and input channels.
Significance. If the empirical claims are reproducible, the beat-aligned multichannel 2D representation and its combination with ViT self-attention are a promising direction for PPG-to-ECG reconstruction. The paper has concrete strengths: it uses two public datasets, uses leave-one-out validation, reports a large set of ablations, and proposes clinically motivated error metrics. However, the evaluation protocol currently leaks target-ECG beat timing into the input pipeline for the proposed method, the baseline set is limited to the authors' own prior model, and the 30-record selection is not objectively justified. These issues must be addressed before the state-of-the-art and PPG-only deployment claims are supported.
major comments (5)
- [Section 4.0.1; Section 5.3] The 2D image construction in Section 4.0.1 defines each row using RR intervals, i.e., ECG R-peak times, and states that 'the same processing steps used for the ECG image (YI) are applied to the PPG image (XI)'. For a true PPG-only deployment this requires a beat detector on PPG, but no such detector is specified, and the leave-one-out protocol in Section 5.3 keeps the test record's ECG available during evaluation. The reported PRD and RMSE gains in Table 1 therefore include oracle beat-timing information from the target modality; a real PPG-only pipeline would also contain beat segmentation errors that are not captured in the current numbers. Please evaluate the method with a PPG beat detector (or otherwise supply beat boundaries from an independent PPG segmentation method) and report the sensitivity of PRD and RMSE to beat-alignment errors.
- [Section 5.3; Table 1] The comparison in Table 1 uses a single baseline, CLEP-GAN, which is the authors' own earlier model introduced in reference [28]. The abstract's claim of outperforming 'existing 1D convolution-based approaches' and the use of 'state-of-the-art' are not supported by a single baseline. Please add at least one independent baseline under the same 30-record leave-one-out protocol (e.g., CardioGAN [24], RDDM [19], or a 1D patch-based Transformer), or soften the claims accordingly.
- [Section 5.3] The selection of 30 low-noise records per dataset is described only as being made 'to ensure reliable measurement accuracy'. If the selection depends on noise or other reconstruction-related properties, it can bias the comparison in favor of the proposed method. Please specify an objective selection rule decided before evaluation, report results on the full datasets (53 BIDMC and 42 CapnoBase records), or list the excluded records with a concrete justification.
- [Abstract; Section 5.3; Table 1] The abstract and Section 5.3 state reductions of 'approximately 29% and 18%' in PRD and 'approximately 15% and 10%' in RMSE on BIDMC and CapnoBase, respectively, but these numbers do not match Table 1: the relative reductions implied by Table 1 are approximately 40% and 33% in PRD and 38% and 25% in RMSE (or, if computed as absolute differences, 28.8 and 27.2 PRD points and 0.153 and 0.098 RMSE units). The headline quantitative claim should be corrected so that the text and the table are consistent.
- [Section 5.2, Eqs. (10)-(18)] The four newly introduced clinical metrics require QRS boundary indices (t_s and t_e in Eq. 10) and P-peak and T-peak detection (Eqs. 13, 15, 17), but the peak and boundary detection algorithms are never described, and no validation against expert annotations is provided. Given that reconstructed signals have PRD values around 40-50%, the reliability of these automatically computed metrics is not established. Please specify the detectors used and, ideally, report agreement with manually annotated intervals on a small sample.
minor comments (5)
- [Figure 1 caption] The caption contains a typo: 'Both the encoder and decoder are implemented using(ViT networks.' should be 'implemented using ViT networks.'
- [Section 4.0.1, Eq. (4)] In Eq. (4), the channel labels YΔx and YΔ²x use 'x' while the surrounding text uses 'y' for the signal; please make the notation consistent.
- [Section 5.2, Eq. (6)] The QRS-enhanced loss is described as introduced by [18], but the notation (c_{l,k}, K_l, Gaussian weighting) differs from the formulation in [18]; please clarify whether Eq. (6) is taken verbatim or adapted.
- [Section 6.0.4; Tables 2-7] Several ablation tables (Tables 2, 3, 5, 6, 7) report results on one or very few records, and Table 4 reports four records. Please state this limitation explicitly in the captions, and ideally add leave-one-out aggregate results for these comparisons, since the main table (Table 1) uses 30 records.
- [Section 5.3] The phrase 'state-of-the-art 1D convolutional model CLEP-GAN' should be qualified as 'our previous model' or 'the baseline used in this study' to avoid implying an independent community-established state of the art.
Circularity Check
R-HRV gains are inherited from the ECG-defined beat grid; central PRD/RMSE comparisons remain independent.
-
self definitional
[Section 4.0.1 (2D Signal Image Data), Section 5.2 (HRV metric), Table 1]
"Since R peak detection is generally more reliable than identifying the onsets or offsets of P and T waves, we use the RR interval to define each beat cycle. ... The same processing steps used for the ECG image (YI) are applied to the PPG image (XI)."
The input PPG image is segmented into rows using RR intervals taken from the target ECG, so the target RR-interval sequence is encoded into the input grid. The model output is converted back to a 1D ECG by concatenating those same padded beats and removing the padding with the known beat lengths (Appendix A), and the QRS-enhanced loss is centered at the ground-truth R-peak locations. Consequently the reconstructed signal inherits the target R-peak timing: the RR intervals evaluated as R-HRV in Table 1 are supplied by the input construction rather than predicted from PPG. The reported R-HRV improvement over CLEP-GAN is therefore not an independent test for that metric, although PRD, RMSE, and the P/T-wave-based metrics still measure genuine reconstruction quality.
full rationale
This is an empirical method-comparison paper, not an analytic derivation, so most circularity patterns do not apply. The central claims of 29% PRD and 15% RMSE improvement are measured outcomes of a supervised model and are not fitted parameters renamed as predictions. The one substantive circularity is in the HRV evaluation: because the beat-aligned image construction uses ECG R-peak times to define rows for both the target and the PPG input, the reconstructed ECG's beat boundaries are the target's beat boundaries by construction, making R-HRV (standard deviation of RR intervals) a largely inherited quantity rather than a learned prediction. The SOTA baseline CLEP-GAN is the authors' own prior work [28], and the paper relies on that self-citation for the claim that it is state-of-the-art; however, the comparison itself is a measured benchmark rather than a derivation, so this is a weakness in baseline selection but not an equation-level circularity. The new clinical metrics (QRS area, PR interval, RT interval, RT amplitude) are defined by the authors but are computed from reconstructed waveforms and do not reduce to inputs by definition. Overall, the central waveform-reconstruction result retains independent empirical content, but the R-HRV sub-claim is partially circular, yielding a score of 6.
Assumptions & free parameters
free parameters (5)
- ViT patch size =
8 (also discussed as 8x16 and 4x4)
- Number of beats per image =
16
- Beat window width =
128 samples at 125 Hz
- QRS loss spread and intensity =
Not specified (sigma and beta)
- Number of low-noise records selected per dataset =
30
assumptions (5)
- domain assumption The cardiac cycle for both ECG and PPG can be defined using ECG R peak intervals.
- domain assumption Bandpass filtering ranges (0.4-45 Hz for ECG, 0.3-8 Hz for PPG) preserve the signal components needed for high-fidelity reconstruction.
- domain assumption R peaks are the most reliable fiducial points and can be detected in both modalities.
- ad hoc to paper Self-attention over 2D patches of stacked padded beats can capture long-range inter-beat dependencies better than 1D sequence processing.
- ad hoc to paper The 30 selected records per dataset are representative enough for a fair leave-one-out comparison.
Cite this review
Pith. "Pith review of Beyond Single-Channel: Multichannel Signal Imaging for PPG-to-ECG Reconstruction with Vision Transformers." pith.science (2026). https://pith.science/paper/76EAN5V4
@misc{pith2026250521767,
  author       = {Pith},
  title        = {Pith review of: Beyond Single-Channel: Multichannel Signal Imaging for PPG-to-ECG Reconstruction with Vision Transformers},
  year         = {2026},
  howpublished = {\url{https://pith.science/paper/76EAN5V4}},
  note         = {Machine review of arXiv:2505.21767}
}
read the original abstract
Reconstructing ECG from PPG is a promising yet challenging task. While recent advancements in generative models have significantly improved ECG reconstruction, accurately capturing fine-grained waveform features remains a key challenge. To address this, we propose a novel PPG-to-ECG reconstruction method that leverages a Vision Transformer (ViT) as the core network. Unlike conventional approaches that rely on single-channel PPG, our method employs a four-channel signal image representation, incorporating the original PPG, its first-order difference, second-order difference, and area under the curve. This multi-channel design enriches feature extraction by preserving both temporal and physiological variations within the PPG. By leveraging the self-attention mechanism in ViT, our approach effectively captures both inter-beat and intra-beat dependencies, leading to more robust and accurate ECG reconstruction. Experimental results demonstrate that our method consistently outperforms existing 1D convolution-based approaches, achieving up to 29% reduction in PRD and 15% reduction in RMSE. The proposed approach also produces improvements in other evaluation metrics, highlighting its robustness and effectiveness in reconstructing ECG signals. Furthermore, to ensure a clinically relevant evaluation, we introduce new performance metrics, including QRS area error, PR interval error, RT interval error, and RT amplitude difference error. Our findings suggest that integrating a four-channel signal image representation with the self-attention mechanism of ViT enables more effective extraction of informative PPG features and improved modeling of beat-to-beat variations for PPG-to-ECG mapping. Beyond demonstrating the potential of PPG as a viable alternative for heart activity monitoring, our approach opens new avenues for cyclic signal analysis and prediction.
Figures


Figures from the paper (6 more)


Reference graph
Works this paper leans on
-
[28]
X. Li, S. Xu, F. Habib, N. Aminnejad, A. Gupta, H. Huang, Clep-gan: An innovative approach to subject-independent ecg reconstruction from ppg sig- nals (2025). arXiv:2502.17536
work page Pith review arXiv 2025
-
[24]
P. Sarkar, A. Etemad, CardioGAN: Attentive generative adversarial net- work with dual discriminators for synthesis of ECG from PPG, in: Pro- ceedings of the AAAI Conference on Artificial Intelligence, V ol. 35, Asso- ciation for the Advancement of Artificial Intelligence, 2021, pp. 488–496. doi:10.1609/aaai.v35i1.16126
-
[19]
D. Shome, P. Sarkar, A. Etemad, Region-disentangled diffusion model for high-fidelity PPG-to-ECG translation, in: Proceedings of the AAAI Con- 33 ference on Artificial Intelligence, V ol. 38, AAAI Press, 2024, pp. 14760– 14768. doi:10.1609/aaai.v38i13.29422
-
[1]
A. L. Goldberger, Z. D. Goldberger, A. Shvilkin, Goldberger’s Clinical Electrocardiography: A Simplified Approach, 9th Edition, Elsevier, 2017. doi:10.1016/C2014-0-03319-9
-
[2]
L. Sörnmo, P. Laguna, Knowledge-based ECG interpretation: a critical review, Pattern Recognition 33 (3) (2000) 397–413. doi:10.1016/S0031- 3203(99)00065-5
doi:10.1016/s0031- 2000
-
[3]
B. Surawicz, R. Childers, B. J. Deal, L. S. Gettes, J. J. Bailey, A. Gorgels, E. W. Hancock, M. Josephson, P. Kligfield, J. A. Kors, P. Macfarlane, J. W. Mason, D. M. Mirvis, P. Okin, O. Pahlm, P. M. Rautaharju, G. van Herpen, G. S. Wagner, H. Wellens, AHA/ACCF/HRS recommendations for the stan- 31 dardization and interpretation of the electrocardiogram: P...
-
[4]
C. Lin, T. Chau, C.-S. Lin, H.-S. Shang, W.-H. Fang, D.-J. Lee, C.-C. Lee, S.-H. Tsai, C.-H. Wang, S.-H. Lin, Point-of-care artificial intelligence- enabled ECG for dyskalemia: a retrospective cohort analysis for ac- curacy and outcome prediction, npj digital medicine 5 (1) (2022) 8. doi:10.1038/s41746-021-00550-0
-
[5]
P. von Bachmann, D. Gedon, F. K. Gustafsson, A. H. Ribeiro, E. Lampa, S. Gustafsson, J. Sundström, T. B. Schön, Evaluating regression and prob- abilistic methods for ecg-based electrolyte prediction, Scientific Reports 14 (1) (2024) 15273. doi:10.1038/s41598-024-65223-w
Show all 35 references
-
[6]
Reiss, I
A. Reiss, I. Indlekofer, P. Schmidt, K. Van Laerhoven, Deep PPG: Large- scale heart rate estimation with convolutional neural networks, Sensors 19 (14) (2019) 3079. doi:10.3390/s19143079
2019 doi
-
[7]
Vraka, R
A. Vraka, R. Zangróniz, A. Quesada, F. Hornero, R. Alcaraz, J. J. Rieta, A novel signal restoration method of noisy photoplethysmo- grams for uninterrupted health monitoring, Sensors 24 (1) (2024) 141. doi:10.3390/s24010141
2024 doi
-
[8]
Z. Wu, C. Guo, Deep learning and electrocardiography: Systematic review of current techniques in cardiovascular disease diagnosis and management, BioMedical Engineering OnLine 24 (1) (2025) 23. doi:10.1186/s12938-025- 01349-w
2025 doi
-
[9]
X. Tian, Q. Zhu, Y . Li, M. Wu, Cross-domain joint dictionary learning for ECG inference from PPG, IEEE Internet of Things Journal 10 (9) (2023) 8140–8154. doi:10.1109/JIOT.2022.3231862
2023
-
[10]
G. Nie, J. Zhu, G. Tang, D. Zhang, S. Geng, Q. Zhao, S. Hong, A re- view of deep learning methods for photoplethysmography data (2024). arXiv:2401.12783
2024 arXiv
-
[11]
E. Gil, M. Orini, R. Bailon, J. M. Vergara, L. Mainardi, P. Laguna, Photo- plethysmography pulse rate variability as a surrogate measurement of heart 32 rate variability during non-stationary conditions, Physiological Measure- ment 31 (9) (2010) 1271–1290. doi:10.1088/0967-333...
2010 doi
-
[12]
E. C.-P. Chua, S. J. Redmond, G. McDarby, C. Heneghan, Towards using photo-plethysmogram amplitude to measure blood pressure dur- ing sleep, Annals of biomedical engineering 38 (3) (2010) 945–954. doi:10.1007/s10439-009-9882-z
2010 doi
-
[13]
El-Hajj, P
C. El-Hajj, P. Kyriacou, A review of machine learning techniques in pho- toplethysmography for the non-invasive cuff-less measurement of blood pressure, Biomedical Signal Processing and Control 58 (2020) 101870. doi:10.1016/j.bspc.2020.101870
2020
-
[14]
H. Kim, T. Q. Phan, W. Hong, S. Y . Chun, Physiology-based augmented deep neural network frameworks for ECG biometrics with short ECG pulses considering varying heart rates, Pattern Recognition Letters 156 (2022) 1–6. doi:10.1016/j.patrec.2022.02.014
2022 doi
-
[15]
Donida Labati, V
R. Donida Labati, V . Piuri, F. Rundo, F. Scotti, MultiCardioNet: Interoper- ability between ECG and PPG biometrics, Pattern Recognition Letters 175 (2023) 1–7. doi:10.1016/j.patrec.2023.09.009
2023 doi
-
[16]
Q. Zhu, X. Tian, C.-W. Wong, M. Wu, Learning your heart actions from pulse: ECG waveform reconstruction from PPG, IEEE Internet of Things Journal 8 (23) (2021) 16734–16748. doi:10.1109/JIOT.2021.3097946
2021
-
[17]
Q. Tang, Z. Chen, R. K. Ward, C. Menon, M. Elgendi, PPG2ECGps: An end-to-end subject-specific deep neural network model for elec- trocardiogram reconstruction from photoplethysmography signals with- out pulse arrival time adjustments, Bioengineering 10 (6) (2023) 630. doi:10.3...
2023 doi
-
[18]
H. Y . Chiu, H. H. Shuai, P. C. . P. Chao, Reconstructing QRS complex from PPG by transformed attentional neural networks, IEEE Sensors Journal 20 (20) (2020) 12374–12383. doi:10.1109/JSEN.2020.3000344
2020
-
[20]
Vaswani, N
A. Vaswani, N. Shazeer, N. Parmar, J. Uszkoreit, L. Jones, A. N. Gomez, L. Kaiser, I. Polosukhin, Attention is all you need, in: Advances in Neural Information Processing Systems, V ol. 30, 2017
2017
-
[21]
Y . Yu, R. Ma, Z. Ma, Robformer: A robust decomposition transformer for long-term time series forecasting, Pattern Recognition 153 (2024) 110552. doi:10.1016/j.patcog.2024.110552
2024
-
[22]
G. H. Nayak, M. W. Alam, G. Avinash, R. R. Kumar, M. Ray, S. Barman, K. Singh, B. S. Naik, N. M. Alam, P. Pal, S. Rathod, J. Bisen, Transformer- based deep learning architecture for time series forecasting, Software Im- pacts 22 (2024) 100716. doi:10.1016/j.simpa.2024.100716
2024
-
[23]
Dosovitskiy, L
A. Dosovitskiy, L. Beyer, A. Kolesnikov, D. Weissenborn, X. Zhai, T. Un- terthiner, M. Dehghani, M. Minderer, G. Heigold, S. Gelly, J. Uszkoreit, N. Houlsby, An image is worth 16x16 words: Transformers for image recog- nition at scale, in: International Conference on Learning ...
2021
-
[25]
Goodfellow, J
I. Goodfellow, J. Pouget-Abadie, M. Mirza, B. Xu, D. Warde-Farley, S. Ozair, A. Courville, Y . Bengio, Generative adversarial nets, in: Advances in Neural Information Processing Systems, V ol. 27, Curran Associates, Inc., 2014, pp. 2672–2680
2014
-
[26]
J.-Y . Zhu, T. Park, P. Isola, A. A. Efros, Unpaired image-to-image trans- lation using cycle-consistent adversarial networks, in: 2017 IEEE Inter- national Conference on Computer Vision (ICCV), 2017, pp. 2242–2251. doi:10.1109/ICCV .2017.244. 34
2017 doi
-
[27]
J. Ho, A. Jain, P. Abbeel, Denoising diffusion probabilistic models, in: Ad- vances in Neural Information Processing Systems, V ol. 33, Curran Asso- ciates, Inc., 2020, pp. 6840–6851
2020
-
[29]
M. A. F. Pimentel, D. A. Clifton, L. Clifton, P. J. Watkinson, L. Tarassenko, Towards a robust estimation of respiratory rate from pulse oximeters, IEEE Transactions on Biomedical Engineering 64 (8) (2017) 1914–1923. doi:10.1109/TBME.2016.2613124
2017
-
[30]
A. L. Goldberger, L. A. N. Amaral, L. Glass, J. M. Hausdorff, P. C. Ivanov, R. G. Mark, J. E. Mietus, G. B. Moody, C.-K. Peng, H. E. Stanley, Phys- iobank, physiotoolkit, and physionet: Components of a new research re- source for complex physiologic signals, Circulation 101 (2...
2000 doi
-
[31]
Karlen, S
W. Karlen, S. Raman, J. M. Ansermino, G. A. Dumont, Multipa- rameter respiratory rate estimation from the photoplethysmogram, IEEE Transactions on Biomedical Engineering 60 (7) (2013) 1946–1953. doi:10.1109/TBME.2013.2246160
2013
-
[32]
Charlton, et al., Capnobase: Benchmark data for respiratory rate estima- tion, accessed: 2025-01-13 (2020)
P. Charlton, et al., Capnobase: Benchmark data for respiratory rate estima- tion, accessed: 2025-01-13 (2020). URLhttps://physionet.org/content/capnobase/1.0.0/
2020
-
[33]
K. H. Shelley, Photoplethysmography: Beyond the calculation of arterial oxygen saturation and heart rate, Anesthesia & Analgesia 105 (6) (2007) S31–S36. doi:10.1213/01.ane.0000269512.82836.c9
2007
-
[34]
Allen, Photoplethysmography and its application in clinical physio- logical measurement, Physiological Measurement 28 (3) (2007) R1–39
J. Allen, Photoplethysmography and its application in clinical physio- logical measurement, Physiological Measurement 28 (3) (2007) R1–39. doi:10.1088/0967-3334/28/3/R01
2007 doi
-
[35]
A. B. Bornstein, S. S. Rao, K. Marwaha, Left Ventricu- lar Hypertrophy, StatPearls Publishing, 2025, available from: https://www.ncbi.nlm.nih.gov/books/NBK459312/. 35
2025
Reviewed August 7, 2026 · model on record in the stance chip above.
Discussion (0). Continue with ORCID to comment.