REVIEW 4 major objections 6 minor 57 references
Revisiting the Li abundances of Stars with and without Detected Planets from the High Resolution Spectroscopy
T0 review · 4 major / 6 minor · reviewed 2026-08-07 · deepseek-v4-flash
Pith's one-line read Hundreds of stars with and without detected planets show the same lithium abundance distribution, indicating that hosting Kepler-like planets does not measurably deplete stellar lithium.
desk verdict Useful homogeneous non-LTE Li catalog for 450 FGK stars, but the headline null result is under-powered by the acknowledged ~30% hidden-planet contamination in the 'isolated' sample and the absence of any quantitative significance testing. read the letter →
The pith
A machine-rendered reading of the paper's core claim, the machinery that carries it, and where it could break.
The reading
What carries the argument
The central machinery is the matched HS–IS comparison sample: 279 planet hosts and 171 isolated stars, each isolated star selected to minimize a combined difference in effective temperature, surface gravity, and metallicity relative to a host star. Lithium abundances come from spectral synthesis of the Li I 6707.8 Å lines with the MARCS model atmospheres, under non-LTE using the Shi et al. atomic model, and the S-index from Ca II H&K measures chromospheric activity. This matched design is what lets the authors attribute any abundance difference to planet presence rather than to stellar parameters, and the non-LTE treatment is what makes the comparison reliable for stars with high lithium.
What would settle it
A matched comparison of lithium abundances between a sample of stars with planet absence confirmed by long-baseline radial-velocity monitoring or direct imaging and a sample of confirmed planet hosts; if the planet-free stars show systematically higher lithium, the null result reported here would be contradicted.
Extended reading notes
Core claim
The core claim is that planet-host stars and isolated stars do not differ significantly in their surface lithium abundance once stellar parameters are matched and non-LTE corrections are applied. Using 279 host stars from the California-Kepler Survey and 171 isolated stars from the Keck archive, all observed with Keck/HIRES, the authors derive A(Li) from spectral synthesis of the Li I 6707.8 Å doublet under both LTE and non-LTE assumptions. The full sample, the unevolved subsample, and the specific 5600–5900 K window all show statistically indistinguishable A(Li) distributions between the two groups. The paper attributes the scatter seen in unevolved 5500–5800 K stars to stellar mass and convection-envelope depth rather than to the presence of planets, and shows that chromospheric activity does not bias the comparison.
Load-bearing premise
The isolated-star comparison group is defined by an absence of detected radial-velocity variations, not by a confirmed absence of planets, so hidden planetary systems may be mixed into the 'no-planet' sample and dilute any true lithium-depletion signal.
Editorial extensions
If this is right
- The earlier 5600–5900 K signal of lithium depletion in planet hosts is not reproduced in a larger, parameter-matched sample, so that result should be treated as a small-sample artifact.
- Because lithium distributions are indistinguishable, lithium remains usable as an age and mixing indicator for FGK stars without needing to correct for the presence or absence of planets.
- Non-LTE corrections should be applied to any lithium abundance above roughly 2.5 dex, since LTE abundances at that end are systematically offset and would bias comparisons.
- For evolved stars in this sample, stellar evolution dominates lithium depletion, so planet effects, if any, are below the detection threshold of this dataset.
Reading between the lines
- A cleaner falsification would compare lithium in stars with planet absence confirmed by long-baseline RV or direct imaging rather than by non-detection; the paper's IS sample likely contains roughly 30% hidden Kepler-like systems, which would dilute any true planet-induced depletion.
- The non-LTE correction curve derived here could be applied to large spectroscopic surveys, potentially shifting the reported fractions of lithium-rich and lithium-poor stars once LTE-based catalogs are recalibrated.
- Subdividing the host sample by planet size, multiplicity, or orbital distance, as earlier work did, could reveal effects that the aggregate presence/absence comparison washes out; the paper's null result bounds but does not exclude such effects.
Editorial analysis
A structured set of objections, weighed in public.
Referee Report
Summary. The paper presents non-LTE Li abundances for 279 planet-host stars (HS) from the California-Kepler Survey and 171 isolated stars (IS) from Keck/HIRES spectra, spanning Teff = 4600–6600 K and [Fe/H] = −0.55 to +0.50. Using MARCS model atmospheres, SIU spectral synthesis, and the Shi et al. (2007) Li model atom, the authors compare the Li distributions of HS and IS and conclude that the distributions are generally consistent, implying that Kepler-like planets do not significantly impact Li depletion. They also report that non-LTE corrections become important for A(Li) above about 2.5 dex. The LTE measurements are validated against Berger et al. (2018), and chromospheric activity is discussed as a possible confounder, with particular attention to the 5600–5900 K range where earlier work claimed enhanced depletion in planet hosts.
Significance. If the null result were firmly established, the paper would strengthen the recent consensus (Baumann et al. 2010; Llorente de Andrés et al. 2024) against earlier claims that planet hosts are systematically Li-depleted, using a homogeneous Keck/HIRES sample with non-LTE corrections and an external comparison to Berger et al. (2018). The measurements themselves are a useful resource, and the paper explicitly acknowledges a key limitation of the IS sample. However, the central claim currently rests on visual comparisons, is diluted by an acknowledged ~30% contamination of the IS sample by undetected Kepler-like planets, and does not properly account for upper-limit censoring. These issues are addressable with sensitivity analysis and statistical tests, so the paper is promising but not yet conclusive.
major comments (4)
- [§2.2 and §4.3] The central null claim is not supported by the sample design because the IS sample is not planet-free. Section 2.2 concedes that RV non-detections "do not necessarily exclude the presence of Kepler-like planetary systems" and cites a ~30% occurrence rate around FGK dwarfs. For 171 IS stars this implies roughly 50 hidden planet hosts, so if the true Li-depletion effect of Kepler-like planets is δ, the expected HS−IS difference is only (1−f)δ with f≈0.3. The paper provides no sensitivity analysis, mixture model, or upper limit on δ that would let the reader convert "generally consistent" into "no significant impact." Please add such an analysis or explicitly weaken the conclusion to an upper limit consistent with the dilution.
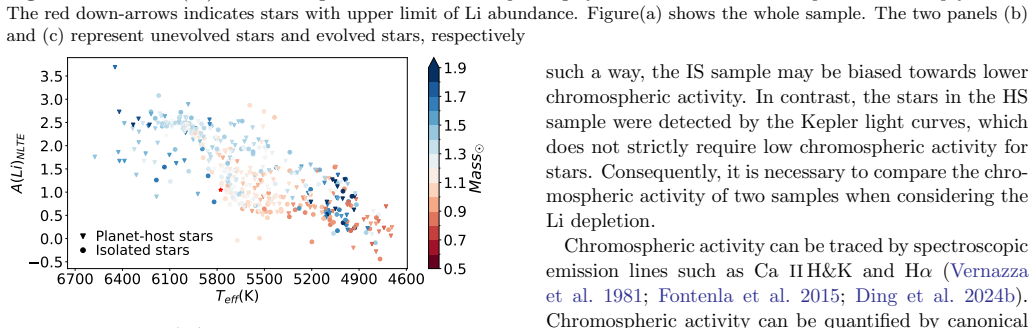
- [§4.3; Fig. 6] The claim that the HS and IS Li distributions are consistent rests on visual inspection: phrases such as "generally consistent" and "we do not see a significant deviation" are not accompanied by any two-sample statistical test. Please add quantitative tests (for example, Kolmogorov–Smirnov or Anderson–Darling tests on detections, plus survival-analysis variants that include upper limits) for the full sample, for evolved/unevolved subsamples, and for the 5600–5900 K bin, and report effect sizes with uncertainties. The apparent larger scatter of unevolved HS at 5500–5800 K should also be tested rather than attributed to mass only via Fig. 7.
- [§3.2 and §4.1] The distributional comparison treats stars with only upper limits on A(Li) as if they were detections or ignores them, despite the red arrows in Fig. 6 marking censored values. Because the low-Li tail is dominated by upper limits, and the censoring fraction may differ between HS and IS, this can bias the conclusion. Please state the number and fraction of upper limits in each sample and repeat the comparison using survival analysis or another method that properly handles censored data.
- [§4.4] The S-index comparison is purely descriptive, and the text concludes that the chromospheric activities "do not differ significantly" without a statistical test. This matters because the RV-based IS selection is biased toward low-activity (likely older) stars, and age is the main alternative driver of Li depletion highlighted by Baumann et al. (2010). Please quantify the activity difference (e.g., a two-sample test or a comparison restricted to the common low-activity regime) and, ideally, include an age/activity proxy in the matching or in a sensitivity check.
minor comments (6)
- [§2.1] The sentence "There are much less evolved stars than the unevolved ones in the CKS, and thus we include all the unevolved CKS stars in our HS sample" appears to have "unevolved" and "evolved" reversed in the final clause; please correct the sample-selection description.
- [§2.1] The Keck/HIRES instrument is cited as Wolszczan (1994), but that reference is for the discovery of pulsar planets; please replace it with the appropriate HIRES instrument paper.
- [§3.2] The phrase "checked by eyes" should read "checked by eye."
- [§4.5] The phrase "references theirin" contains a typo; it should be "references therein."
- [Eq. (1)] The matching metric gives equal weight to ΔTeff/1000, Δlogg, and Δ[Fe/H]; please justify the weighting or state whether the conclusions are robust to the chosen weights.
- [§4.2; Fig. 5] The paper states that non-LTE corrections cannot be neglected for A(Li) above 2.5 dex; please quote the typical correction amplitude in this regime, since Fig. 5 shows values up to roughly 0.1–0.15 dex.
Circularity Check
No circular derivation: Li abundances are measured independently and compared between planet-host and isolated samples; author-overlap citations provide tools and data, not the conclusion.
full rationale
The paper's central claim—that HS and IS Li distributions are consistent—rests on spectroscopic Li abundance measurements, not on any parameter fitted to the HS-IS difference. The IS sample is matched to HS only in Teff, log g, and [Fe/H] via Eq. (1); Li is deliberately excluded from the matching, so the subsequent comparison is not forced by construction. Model atoms (Shi et al. 2007), atomic data (Yan et al. 2018), and stellar parameters (Liu et al. 2020, Johnson et al. 2017) are external inputs applied identically to both groups; although some of these references share authors with the present paper, they are tool/data provenance and are independently validated or falsifiable, so they do not encode the null conclusion. The A(Li) measurements are externally benchmarked against Berger et al. (2018) in Fig. 4 and agree with independent samples (I09, L24) in Fig. 9. The acknowledged ~30% undetected-planet contamination of the IS sample (Sec. 2.2) weakens the statistical power of the null result but is a sample-design limitation, not a circularity: the paper does not assume no planet-Li depletion in order to conclude it. No load-bearing step reduces by definition or by fit to its own inputs. Score 1 reflects only the presence of minor, non-load-bearing self-citations (Shi et al. 2007; Yan et al. 2018; Liu et al. 2020; Zhu et al. 2018).
Assumptions & free parameters
free parameters (1)
- Sample matching weights in Eq. 1 =
1/1000 (Teff), 1 (log g), 1 ([Fe/H])
assumptions (3)
- domain assumption Stars with no detected RV variations are representative of stars without Kepler-like planets, or contamination is small enough to preserve a difference if one existed.
- domain assumption Adopted atmospheric parameters from Johnson et al. (2017) and Liu et al. (2020) are mutually consistent and accurate.
- domain assumption MARCS model atmospheres, SIU spectral synthesis, and the Shi et al. non-LTE Li model atom correctly describe the 6707 A line formation.
Cite this review
Pith. "Pith review of Revisiting the Li abundances of Stars with and without Detected Planets from the High Resolution Spectroscopy." pith.science (2026). https://pith.science/paper/UFVTCOED
@misc{pith2026250521957,
  author       = {Pith},
  title        = {Pith review of: Revisiting the Li abundances of Stars with and without Detected Planets from the High Resolution Spectroscopy},
  year         = {2026},
  howpublished = {\url{https://pith.science/paper/UFVTCOED}},
  note         = {Machine review of arXiv:2505.21957}
}
read the original abstract
Whether the presence of planets affects the lithium (Li) abundance of their host stars is still an open question. To investigate the difference of the Li abundance between planet-host stars (HS) and isolated stars (IS) with no detected planets, we analyze a large sample of stars with temperatures ranging from 4600 to 6600 K and metallicity ranging from -0.55 to +0.50. The sample consists of 279 HS whose spectra were taken from the California-Kepler Survey (CKS), which followed up planets detected by Kepler, and 171 IS whose spectra were taken from the Keck archive. The non-local thermodynamic equilibrium (non-LTE) effects were taken into consideration. It is found that the distribution of Li abundances in both the HS and IS groups are generally consistent with each other. This suggests that the presence of Kepler-like planets does not have a significant impact on Li depletion. We also found that the non-LTE corrections can not be neglected for stars with A(Li) over ~ 2.5 dex.
Figures


Figures from the paper (7 more)




Reference graph
Works this paper leans on
-
[1]
*o rW S 5 x8
thebibliography [1] 20pt to REFERENCES 6pt =0pt 10pt plus 3pt =0pt =0pt =1pt plus 1pt =0pt =0pt -12pt =13pt plus 1pt =20pt =13pt plus 1pt \@M =10000 =-1.0em =0pt =0pt 0pt =0pt =1.0em @enumiv\@empty 10000 10000 `\.\@m \@noitemerr \@latex@warning Empty `thebibliography' environment \@ifnextchar \@reference \@latexerr Missing key on reference command Each re...
2017
-
[2]
Z., Delgado Mena , E., Sousa , S
Adibekyan , V. Z., Delgado Mena , E., Sousa , S. G., et al. 2012, , 547, A36
work page 2012
-
[3]
Z., Gonz \'a lez Hern \'a ndez , J
Adibekyan , V. Z., Gonz \'a lez Hern \'a ndez , J. I., Delgado Mena , E., et al. 2014, , 564, L15
work page 2014
-
[4]
Aguilera-G \'o mez , C., Chanam \'e , J., Pinsonneault , M. H., & Carlberg , J. K. 2016, , 833, L24
work page 2016
-
[5]
S., O'Mara , B
Barklem , P. S., O'Mara , B. J., & Ross , J. E. 1998, , 296, 1057
1998
-
[6]
Baumann , P., Ram \' rez , I., Mel \'e ndez , J., Asplund , M., & Lind , K. 2010, , 519, A87
work page 2010
- [7]
-
[8]
Boro Saikia , S., Marvin , C. J., Jeffers , S. V., et al. 2018, , 616, A108
work page 2018
Show all 57 references
-
[9]
2008, , 489, L53
Bouvier , J. 2008, , 489, L53
2008
-
[10]
1993, , 100, 647
Bressan , A., Fagotto , F., Bertelli , G., & Chiosi , C. 1993, , 100, 647
1993
-
[11]
2012, , 427, 127
Bressan , A., Marigo , P., Girardi , L., et al. 2012, , 427, 127
2012
-
[12]
M., Fischer , D
Brewer , J. M., Fischer , D. A., Valenti , J. A., & Piskunov , N. 2016, , 225, 32
2016
-
[13]
2018, , 478, 4513
Buder , S., Asplund , M., Duong , L., et al. 2018, , 478, 4513
2018
-
[14]
2021, , 506, 150
Buder , S., Sharma , S., Kos , J., et al. 2021, , 506, 150
2021
-
[15]
R., Ho , A
Casey , A. R., Ho , A. Y. Q., Ness , M., et al. 2019, , 880, 125
2019
-
[16]
2019, , 487, 3162
Chavero , C., de la Reza , R., Ghezzi , L., et al. 2019, , 487, 3162
2019
-
[17]
Q., & Zhao , G
Chen , Y. Q., & Zhao , G. 2006, , 131, 1816
2006
-
[18]
M., Freeman , K
De Silva , G. M., Freeman , K. C., Bland-Hawthorn , J., et al. 2015, , 449, 2604
2015
-
[19]
Z., et al
Delgado Mena , E., Tsantaki , M., Adibekyan , V. Z., et al. 2017, , 606, A94
2017
-
[20]
I., et al
Delgado Mena , E., Israelian , G., Gonz \'a lez Hern \'a ndez , J. I., et al. 2014, , 562, A92
2014
-
[21]
2022, , 260, 45
Ding , M.-Y., Shi , J.-R., Wu , Y., et al. 2022, , 260, 45
2022
-
[22]
2024 a , , 271, 58
Ding , M.-Y., Shi , J.-R., Yan , H.-l., et al. 2024 a , , 271, 58
2024
-
[23]
2024 b , , 976, 243
Ding , Y., Zhang , S., Han , H., et al. 2024 b , , 976, 243
2024
-
[24]
M., Stancil , P
Fontenla , J. M., Stancil , P. C., & Landi , E. 2015, , 809, 157
2015
-
[25]
J., Petigura , E
Fulton , B. J., Petigura , E. A., Howard , A. W., et al. 2017, , 154, 109
2017
-
[26]
M., et al
Gao , X., Lind , K., Amarsi , A. M., et al. 2018, , 481, 2666
2018
-
[27]
V., & de la Reza , R
Ghezzi , L., Cunha , K., Smith , V. V., & de la Reza , R. 2010, , 724, 154
2010
-
[28]
2008, , 486, 951
Gustafsson , B., Edvardsson , B., Eriksson , K., et al. 2008, , 486, 951
2008
-
[29]
A., Hasselquist , S., Shetrone , M., et al
Holtzman , J. A., Hasselquist , S., Shetrone , M., et al. 2018, , 156, 125
2018
-
[30]
C., Mayor , M., & Rebolo , R
Israelian , G., Santos , N. C., Mayor , M., & Rebolo , R. 2004, , 414, 601
2004
-
[31]
C., et al
Israelian , G., Delgado Mena , E., Santos , N. C., et al. 2009, , 462, 189
2009
-
[32]
2015, , 574, A50
Jofr \'e , E., Petrucci , R., Saffe , C., et al. 2015, , 574, A50
2015
-
[33]
A., Petigura , E
Johnson , J. A., Petigura , E. A., Fulton , B. J., et al. 2017, , 154, 108
2017
-
[34]
R., Deliyannis , C
King , J. R., Deliyannis , C. P., Hiltgen , D. D., et al. 1997, , 113, 1871
1997
-
[35]
2024, , 273, 18
Li , C.-q., Shi , J.-r., Yan , H.-l., et al. 2024, , 273, 18
2024
-
[36]
Lind , K., Asplund , M., & Barklem , P. S. 2009, , 503, 541
2009
-
[37]
2020, , 896, 64
Liu , S., Shi , J., & Wu , Z. 2020, , 896, 64
2020
-
[38]
2024, , 684, A28
Llorente de Andr \'e s , F., de la Reza , R., Cruz , P., et al. 2024, , 684, A28
2024
-
[39]
E., & Heiter , U
Luck , R. E., & Heiter , U. 2006, , 131, 3069
2006
-
[40]
Mishenina , T., Kovtyukh , V., Soubiran , C., & Adibekyan , V. Z. 2016, , 462, 1563
2016
-
[41]
2002, , 386, 1039
Montalb \'a n , J., & Rebolo , R. 2002, , 386, 1039
2002
-
[42]
A., Howard , A
Petigura , E. A., Howard , A. W., Marcy , G. W., et al. 2017, , 154, 107
2017
-
[43]
H., Kawaler , S
Pinsonneault , M. H., Kawaler , S. D., & Demarque , P. 1990, , 74, 501
1990
-
[44]
2021, Frontiers in Astronomy and Space Sciences, 8, 6
Randich , S., & Magrini , L. 2021, Frontiers in Astronomy and Space Sciences, 8, 6
2021
-
[45]
1999, in Chemical Evolution from Zero to High Redshift, ed
Reetz , J. 1999, in Chemical Evolution from Zero to High Redshift, ed. J. R. Walsh & M. R. Rosa , 66
1999
-
[46]
Ryan , S. G. 2000, , 316, L35
2000
-
[47]
R., Gehren , T., Zhang , H
Shi , J. R., Gehren , T., Zhang , H. W., Zeng , J. L., & Zhao , G. 2007, , 465, 587
2007
-
[48]
M., King , J
Stephens , A., Boesgaard , A. M., King , J. R., & Deliyannis , C. P. 1997, , 491, 339
1997
-
[49]
E., Avrett , E
Vernazza , J. E., Avrett , E. H., & Loeser , R. 1981, , 45, 635
1981
-
[50]
X., Nordlander , T., Asplund , M., et al
Wang , E. X., Nordlander , T., Asplund , M., et al. 2021, , 500, 2159
2021
-
[51]
Wilson , O. C. 1978, , 226, 379
1978
-
[52]
1994, Science, 264, 538
Wolszczan , A. 1994, Science, 264, 538
1994
-
[53]
2018, Nature Astronomy, 2, 790
Yan , H.-L., Shi , J.-R., Zhou , Y.-T., et al. 2018, Nature Astronomy, 2, 790
2018
-
[54]
2021, Nature Astronomy, 5, 86
Yan , H.-L., Zhou , Y.-T., Zhang , X., et al. 2021, Nature Astronomy, 5, 86
2021
-
[55]
L., et al
Zhao , G., Mashonkina , L., Yan , H. L., et al. 2016, , 833, 225
2016
-
[56]
2021, , 59, 291
Zhu , W., & Dong , S. 2021, , 59, 291
2021
-
[57]
2018, , 860, 101
Zhu , W., Petrovich , C., Wu , Y., Dong , S., & Xie , J. 2018, , 860, 101
2018
Reviewed August 7, 2026 · model on record in the stance chip above.
Discussion (0). Continue with ORCID to comment.