REVIEW 2 major objections 4 minor 101 references
AquaMonitor: A multimodal multi-view image sequence dataset for real-life aquatic invertebrate biodiversity monitoring
T0 review · 2 major / 4 minor · reviewed 2026-08-07 · deepseek-v4-flash
Pith's one-line read AquaMonitor: a 2.7M-image dataset of aquatic invertebrates captured during real routine monitoring, with benchmarks that reflect deployment conditions rather than curated closed-set galleries.
desk verdict A genuinely useful monitoring-grade aquatic invertebrate dataset with strong baselines, but the 'unbiased' framing doesn't survive its own coverage numbers. read the letter →
The pith
A machine-rendered reading of the paper's core claim, the machinery that carries it, and where it could break.
The reading
What carries the argument
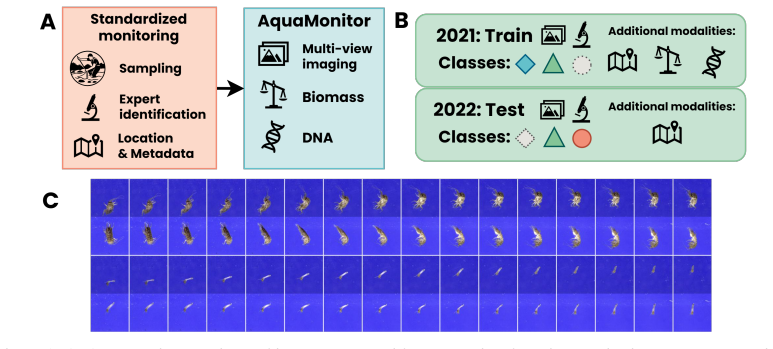
The load-bearing object is the dataset itself, generated by the BIODISCOVER imaging device, a named multi-view system that drops each specimen through a cuvette while two perpendicular cameras photograph it at 50 frames per second, producing synchronized image sequences. The benchmark design carries the argument: the monitoring benchmark splits by year (2021 train, 2022 test), so the test set naturally contains distribution shift, extreme class imbalance, and classes unseen at training time; this is the setup that makes the dataset a realistic testbed rather than another curated gallery. The additional modalities, COI DNA barcodes, biomass, body-size measurements, and site/time metadata, are the parts that let future evaluations go beyond image-only classification.
What would settle it
Take the 2022 test predictions and split them into the 21 statistically representative sites versus the rest, then compare accuracy, macro-F1, and OOD AUROC with bootstrap confidence intervals; a material gap would falsify the unbiased-testbed claim. A second check is to measure the body-size distribution of the nine un-imaged taxa against the imaged taxa and show whether the missing specimens sit at the size extremes.
Extended reading notes
Core claim
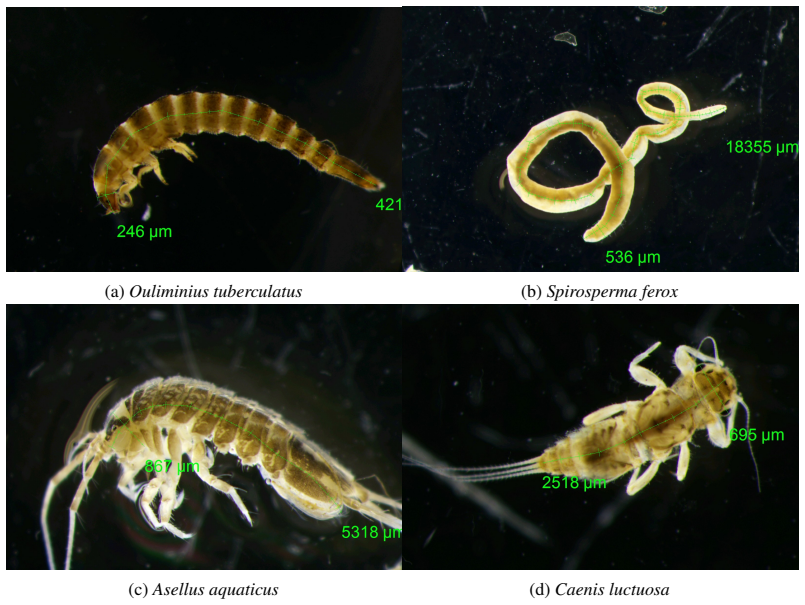
The paper's central claim is that AquaMonitor is the first large computer-vision dataset of aquatic invertebrates assembled in congruence with an operational monitoring program, so its class distribution, rare taxa, and year-to-year turnover reflect what a deployment would actually encounter. Every specimen that could be imaged was imaged: 44,854 synchronized two-camera sequences, 2.7M frames, and 43,189 specimens, with 152 classes spanning a hierarchical taxonomy that includes life-stage variants. On top of the images, subsets carry DNA barcodes (1,358 specimens), dry-mass and size measurements (1,494 specimens), and per-specimen sampling site and time. The authors define a monitoring benchmark (train on 2021, test on 2022, with 24 out-of-distribution classes), a closed-set classification benchmark on 42 well-populated classes, and a few-shot benchmark on 47 rare classes, and they report baselines for each. Their results show that the realistic monitoring benchmark is much harder than standard closed-set classification, with best weighted F1 around 0.859 versus roughly 0.988 on the classification benchmark.
Load-bearing premise
The impartiality of the dataset depends on the assumption that the specimens that were not imaged (about one in ten in 2021 and more than one in four in 2022, including nine entire taxa) are not systematically different from those that were; if they are, benchmark scores may not predict real monitoring performance.
Editorial extensions
If this is right
- Performance on the monitoring benchmark is a direct proxy for how automated identification would behave in a real routine freshwater monitoring program, so advances there can feed legislative water-quality assessment.
- The large gap between classification-benchmark accuracy (about 0.988) and monitoring-benchmark weighted F1 (about 0.859) shows that closed-set evaluations overstate readiness for deployment.
- Out-of-distribution detection with standard ranking scores reaches only about 0.80 AUROC on 72 specimens from 24 unseen classes, marking open-set handling as the current bottleneck.
- Using both camera views and averaging logits over the sequence improves performance over single-frame, single-view classification, so the multi-view sequence format carries usable signal.
- Biomass regression models initialized from AquaMonitor classification features beat ImageNet-initialized models, so the dataset can support trait estimation as well as identification.
Reading between the lines
- Because only 16 of 41 (2021) and 21 of 29 (2022) sampling sites were statistically representative of the monitoring database, a natural next experiment is to rerun the monitoring benchmark on those sites only; if results shift beyond the reported bootstrap intervals, the 'unbiased testbed' claim would need qualification.
- The nine missing taxa are described as too large or too small to image, which implies the dataset underweights size extremes; a size-conditioned error analysis would show whether that blind spot affects practical estimates.
- DNA barcodes cover only 23 classes, but for those classes they could be used as auxiliary supervision or as a ground-truth signal for out-of-distribution detection, a multimodal fusion the paper lists as future work.
- The year-split monitoring protocol could be exported to other routine monitoring programs; if adopted widely, comparable benchmarks across countries would emerge.
Editorial analysis
A structured set of objections, weighed in public.
Referee Report
Summary. The paper introduces AquaMonitor, a large multi-view image-sequence dataset of aquatic macroinvertebrates collected in congruence with an operational Finnish freshwater monitoring program across 2021 and 2022. The dataset contains 2.7M images from 43,189 specimens, with subsets carrying DNA barcodes, dry mass, and size measurements. The authors define three benchmarks: a monitoring benchmark with temporal train/test split, open-set classes, and extreme class imbalance; a standard closed-set classification benchmark; and a few-shot benchmark. They report baselines for all three, plus biomass regression, with bootstrapped confidence intervals. The central claim is that the dataset provides a realistically challenging and unbiased setup for evaluating automated identification methods for routine aquatic biodiversity monitoring.
Significance. If the dataset and benchmarks deliver on their claims, this is a valuable community resource. Its strengths include: standardized kick-sampling and expert taxonomic identification independent of the imaging study; a realistic temporal split that reflects deployment conditions; inclusion of rare and hard-to-identify taxa rather than a curated easy subset; rich metadata (site, time, DNA, biomass) that enables multimodal and ecological analyses; and reproducible baselines with released code and model weights. The multi-view sequence format is also relatively rare among invertebrate datasets. The paper is transparent about many coverage limitations in the supplementary material, which is commendable. However, the headline claim of an 'unbiased setup' is not supported by the paper's own coverage analysis, and this needs to be resolved before the paper can be accepted.
major comments (2)
- [Abstract, Sec. 3.3, Sec. A.4.1] The claim that AquaMonitor provides an 'unbiased setup' (Abstract) and 'represents the full diversity of species encountered during regular biomonitoring, avoiding selection bias' (Sec. 3.3) is contradicted by the coverage analysis in Sec. A.4.1. Only 16/41 sites in 2021 and 21/29 sites in 2022 are statistically well-represented; 9 of 161 taxa were not imaged at all; 6 lakes from 2022 are entirely absent; and the missing 2022 specimens amount to 27.35% of the monitoring-program total. The stated reasons for missingness—specimens too large or too small for the imaging device, lost containers, and site-level non-delivery—are not random with respect to taxon size or site, so the imaged subset is not a random sample of the monitoring distribution. This directly affects the monitoring benchmark's test set (2022), which is supposed to mirror real-life deployment. The authors should either soften the 'unbiased' claim substantially or provide evidence (e.g., comparison of size distributions, taxonomic compositions, or site characteristics between imaged and missing specimens) that the missingness is ignorable for the benchmark conclusions.
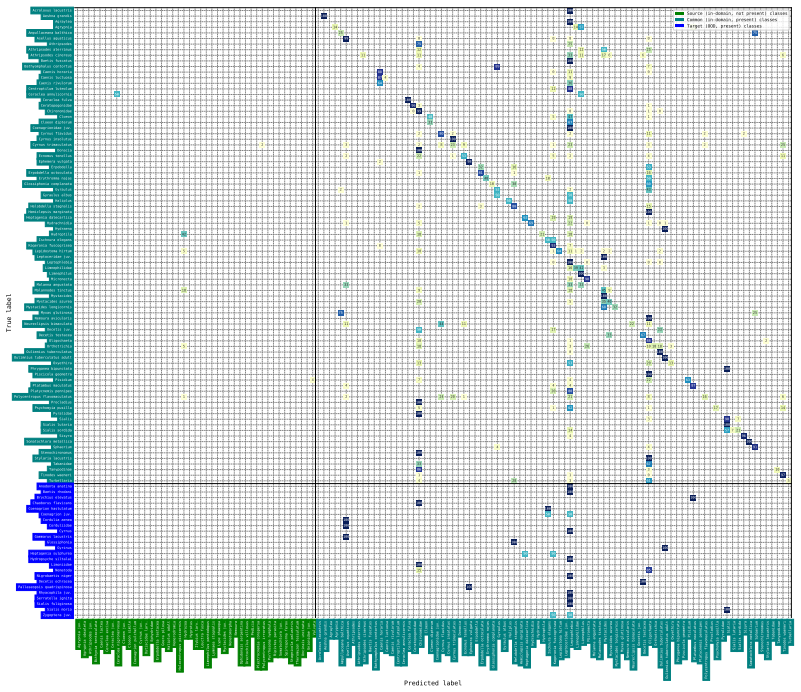
- [Sec. 4.1, Table 5, Fig. 4] The monitoring benchmark conclusions are based on a test set whose representativeness is compromised by the coverage gaps. In particular, the OOD detection evaluation uses only 72 specimens from 24 OOD classes (Sec. A.3). With such a small outlier set, the reported AUROC values (e.g., 0.80 for the ensemble) have wide confidence intervals and are sensitive to the species composition of the missing 2022 specimens. The paper should discuss how the absence of 6 lakes and 9 taxa in the imaged data affects the difficulty and realism of the OOD and classification results, and should avoid stating that the benchmark 'includes all the challenges encountered in an operational monitoring setting' without qualification.
minor comments (4)
- [Sec. A.4.1] The text says 'all but 17 containers from the year 2021' twice; the second occurrence should presumably refer to 2022. Please correct this typo.
- [Sec. 3.2.2 and Sec. A.4.1] The phrase 'the dataset remains unbiased' in Sec. A.4.1 is used in a different sense than the abstract's 'unbiased setup.' The supplementary definition (imaging all received specimens without selection) does not imply statistical representativeness. Please use distinct terminology to avoid confusion.
- [Table 3] The distinction between 'Unique' and 'Labeled to this level' is not immediately clear from the caption; a short explanation in the table caption would help.
- [Fig. 9] The figure lists nine missing taxa, but the caption does not state whether these are the only missing taxa or just a summary; please clarify that this is the complete list referenced in Sec. 3.2.2.
Circularity Check
No significant circularity: the dataset's benchmarks use held-out temporal splits, and the self-citations are contextual rather than load-bearing.
full rationale
The paper's central contribution is a dataset and benchmark suite, not a derivation from fitted parameters or a uniqueness argument. The monitoring benchmark trains on all 2021 specimens and evaluates on 2022 specimens, including 24 classes absent from the training year, so the reported classification and OOD-detection numbers are measured on data not used for fitting. The classification and few-shot benchmarks use predefined stratified cross-validation splits, and the baselines are standard supervised models evaluated on held-out folds. This is normal dataset-paper practice, not circular. The paper cites prior work by overlapping authors (BIODISCOVER [3], FINBenthic2 [4], Høye et al. [36], Impiö and Raitoharju [38]), but these citations are contextual: they identify the imaging device, earlier smaller datasets, and related DNA-based OOD methods. None of these citations is invoked as a uniqueness theorem, an ansatz-justifying authority, or the sole support for the dataset's central claims. The 'unbiased setup' language in the abstract is in tension with the paper's own coverage analysis in Sec. A.4.1, which reports that only 16/41 (2021) and 21/29 (2022) sites are well-represented, that 72.65% of 2022 specimens were imaged, and that nine taxa were not imaged because they were too large or too small. That is a representativeness or validity limitation of the dataset claim, not a circularity: no benchmark result is produced by re-stating a fitted input. The biomass transfer experiment using 'AquaMonitor' classification weights is a transfer-learning comparison rather than a self-defined prediction, and no equation or split is shown to reduce the reported biomass error to the classification training objective. Overall, the paper is self-contained in its evaluation design, and the identified concerns belong to correctness risk, not circularity.
Assumptions & free parameters
assumptions (4)
- domain assumption Expert morphological identification provides accurate ground-truth labels for all specimens.
- domain assumption The BIODISCOVER imaging setup captures images with sufficient visual information for species identification.
- domain assumption The EU Water Framework Directive kick-sampling protocol yields representative samples of the aquatic invertebrate community.
- domain assumption Specimens that could not be imaged (too large, too small, lost, or used for other purposes) do not introduce a systematic bias that undermines the benchmark.
Cite this review
Pith. "Pith review of AquaMonitor: A multimodal multi-view image sequence dataset for real-life aquatic invertebrate biodiversity monitoring." pith.science (2026). https://pith.science/paper/THNQQAL5
@misc{pith2026250522065,
  author       = {Pith},
  title        = {Pith review of: AquaMonitor: A multimodal multi-view image sequence dataset for real-life aquatic invertebrate biodiversity monitoring},
  year         = {2026},
  howpublished = {\url{https://pith.science/paper/THNQQAL5}},
  note         = {Machine review of arXiv:2505.22065}
}
read the original abstract
This paper presents the AquaMonitor dataset, the first large computer vision dataset of aquatic invertebrates collected during routine environmental monitoring. While several large species identification datasets exist, they are rarely collected using standardized collection protocols, and none focus on aquatic invertebrates, which are particularly laborious to collect. For AquaMonitor, we imaged all specimens from two years of monitoring whenever imaging was possible given practical limitations. The dataset enables the evaluation of automated identification methods for real-life monitoring purposes using a realistically challenging and unbiased setup. The dataset has 2.7M images from 43,189 specimens, DNA sequences for 1358 specimens, and dry mass and size measurements for 1494 specimens, making it also one of the largest biological multi-view and multimodal datasets to date. We define three benchmark tasks and provide strong baselines for these: 1) Monitoring benchmark, reflecting real-life deployment challenges such as open-set recognition, distribution shift, and extreme class imbalance, 2) Classification benchmark, which follows a standard fine-grained visual categorization setup, and 3) Few-shot benchmark, which targets classes with only few training examples from very fine-grained categories. Advancements on the Monitoring benchmark can directly translate to improvement of aquatic biodiversity monitoring, which is an important component of regular legislative water quality assessment in many countries.
Figures


Figures from the paper (17 more)






Reference graph
Works this paper leans on
-
[1]
Encyclopedia of life, 2023
2023
-
[2]
GBIF: The Global Biodiversity Information Facility, 2024
2024
-
[3]
J. Ärje, C. Melvad, M. R. Jeppesen, S. A. Madsen, J. Raitoharju, M. S. Rasmussen, A. Iosifidis, V . Tirronen, M. Gabbouj, K. Meissner, and T. T. Høye. Automatic image-based identification and biomass estimation of invertebrates.Methods in Ecology and Evolution, 11(8), 2020
2020
-
[4]
J. Ärje, J. Raitoharju, A. Iosifidis, V . Tirronen, K. Meissner, M. Gabbouj, S. Kiranyaz, and S. Kärkkäinen. Human experts vs. machines in taxa recognition.Signal Processing: Image Communication, 87, 2020
2020
-
[5]
Badirli, Z
S. Badirli, Z. Akata, G. Mohler, C. Picard, and M. Dundar. Fine-Grained Zero-Shot Learning with DNA as Side Information. InNeural Information Processing Systems, 2021
2021
-
[6]
S. Beery, A. Agarwal, E. Cole, and V . Birodkar. The iWildCam 2021 Competition Dataset. arXiv preprint 10.48550/arXiv.2105.03494, 2021
-
[7]
Besson, J
M. Besson, J. Alison, K. Bjerge, T. E. Gorochowski, T. T. Høye, T. Jucker, H. M. R. Mann, and C. F. Clements. Towards the fully automated monitoring of ecological communities.Ecology Letters, 25(12), 2022
2022
-
[8]
Bjerge, J
K. Bjerge, J. Alison, M. Dyrmann, C. E. Frigaard, H. M. R. Mann, and T. T. Høye. Accurate detection and identification of insects from camera trap images with deep learning.PLOS Sustainability and Transformation, 2(3), 2023
2023
Show all 101 references
-
[9]
Bjerge, H
K. Bjerge, H. Karstoft, H. M. R. Mann, and T. T. Høye. A deep learning pipeline for time-lapse camera monitoring of insects and their floral environments.Ecological Informatics, 84, 2024
2024
-
[10]
Buchner and F
D. Buchner and F. Leese. BOLDigger – a Python package to identify and organise sequences with the Barcode of Life Data systems.Metabarcoding and Metagenomics, 4, 2020
2020
-
[11]
Buchner, T.-H
D. Buchner, T.-H. Macher, and F. Leese. APSCALE: Advanced pipeline for simple yet comprehensive analyses of DNA metabarcoding data.Bioinformatics, 38(20), 2022
2022
-
[12]
BugNet: Global research network on invertebrate impact on plant communities and ecosystems, 2023
BugNet Consortium. BugNet: Global research network on invertebrate impact on plant communities and ecosystems, 2023
2023
-
[13]
Caron, H
M. Caron, H. Touvron, I. Misra, H. Jégou, J. Mairal, P. Bojanowski, and A. Joulin. Emerging Properties in Self-Supervised Vision Transformers. InIEEE/CVF International Conference on Computer Vision, 2021
2021
-
[14]
G. Chu, B. Potetz, W. Wang, A. Howard, Y . Song, F. Brucher, T. Leung, and H. Adam. Geo- Aware Networks for Fine-Grained Recognition. InIEEE/CVF International Conference on Computer Vision Workshop, 2019
2019
-
[15]
P. J. A. Cock, C. J. Fields, N. Goto, M. L. Heuer, and P. M. Rice. The Sanger FASTQ file format for sequences with quality scores, and the Solexa/Illumina FASTQ variants.Nucleic Acids Research, 38(6), 2010
2010
-
[16]
de Schaetzen, M
F. de Schaetzen, M. Impiö, B. Wagner, P. Nienaltowski, M. Arnold, M. Huber, M. Meyer, J. Raitoharju, L. G. M. Silva, and R. Stocker. The Riverine Organism Drift Imager: A new technology to study organism drift in rivers and streams.Methods in Ecology and Evolution, 2023
2023
- [17]
-
[18]
Dosovitskiy, L
A. Dosovitskiy, L. Beyer, A. Kolesnikov, D. Weissenborn, X. Zhai, T. Unterthiner, M. De- hghani, M. Minderer, G. Heigold, S. Gelly, J. Uszkoreit, and N. Houlsby. An Image is Worth 16x16 Words: Transformers for Image Recognition at Scale. InInternational Conference on Learning ...
2021
-
[19]
European Commission et al. Directive 2000/60/EC of the European Parliament and of the Council of 23 October 2000 establishing a framework for Community action in the field of water policy.Official Journal of the European Communities, 327(43):1–72, 2000
2000
-
[20]
Falcon and The PyTorch Lightning team
W. Falcon and The PyTorch Lightning team. PyTorch lightning, Mar. 2019
2019
-
[21]
Geissmann, P
Q. Geissmann, P. K. Abram, D. Wu, C. H. Haney, and J. Carrillo. Sticky Pi is a high-frequency smart trap that enables the study of insect circadian activity under natural conditions.PLOS Biology, 20(7), 2022
2022
-
[22]
Geng, S.-J
C. Geng, S.-J. Huang, and S. Chen. Recent Advances in Open Set Recognition: A Survey. IEEE Transactions on Pattern Analysis and Machine Intelligence, 43(10), 2021
2021
-
[23]
Gharaee, Z
Z. Gharaee, Z. Gong, N. Pellegrino, I. Zarubiieva, J. B. Haurum, S. C. Lowe, J. T. McKeown, C. C. Ho, J. McLeod, Y .-Y . C. Wei, J. Agda, S. Ratnasingham, D. Steinke, A. X. Chang, G. W. Taylor, and P. Fieguth. A step towards worldwide biodiversity assessment: The BIOSCAN-1M in...
2023
-
[24]
Gharaee, S
Z. Gharaee, S. C. Lowe, Z. Gong, P. A. M. Arias, N. Pellegrino, A. Wang, J. B. Haurum, I. Zarubiieva, L. Kari, D. Steinke, G. W. Taylor, P. W. Fieguth, and A. X. Chang. BIOSCAN- 5M: A Multimodal Dataset for Insect Biodiversity. InNeural Information Processing Systems, 2024
2024
-
[25]
Z. Gong, A. Wang, X. Huo, J. B. Haurum, S. C. Lowe, G. W. Taylor, and A. X. Chang. CLIBD: Bridging Vision and Genomics for Biodiversity Monitoring at Scale. InInternational Conference on Learning Representations, 2024
2024
-
[26]
Gonzalez, J
A. Gonzalez, J. M. Chase, and M. I. O’Connor. A framework for the detection and attribution of biodiversity change.Philosophical Transactions of the Royal Society B: Biological Sciences, 378(1881), 2023
2023
-
[27]
Gonzalez, P
A. Gonzalez, P. Vihervaara, P. Balvanera, A. E. Bates, et al. A global biodiversity observing system to unite monitoring and guide action.Nature Ecology & Evolution, 7(12), 2023
2023
-
[28]
C. A. Hallmann, M. Sorg, E. Jongejans, H. Siepel, N. Hofland, H. Schwan, W. Stenmans, A. Müller, H. Sumser, T. Hörren, D. Goulson, and H. de Kroon. More than 75 percent decline over 27 years in total flying insect biomass in protected areas.PLOS ONE, 12(10), 2017
2017
-
[29]
Hamdi, S
A. Hamdi, S. Giancola, and B. Ghanem. MVTN: Multi-View Transformation Network for 3D Shape Recognition. InIEEE/CVF International Conference on Computer Vision, pages 1–11, 2021
2021
-
[30]
O. L. P. Hansen, J.-C. Svenning, K. Olsen, S. Dupont, B. H. Garner, A. Iosifidis, B. W. Price, and T. T. Høye. Species-level image classification with convolutional neural network enables insect identification from habitus images.Ecology and Evolution, 10(2), 2020
2020
-
[31]
K. He, X. Zhang, S. Ren, and J. Sun. Deep Residual Learning for Image Recognition. InIEEE Conference on Computer Vision and Pattern Recognition, 2016
2016
-
[32]
J. Held, A. Cioppa, S. Giancola, A. Hamdi, B. Ghanem, and M. Van Droogenbroeck. V ARS: Video Assistant Referee System for Automated Soccer Decision Making From Multiple Views. InIEEE/CVF Conference on Computer Vision and Pattern Recognition, 2023
2023
-
[33]
Hendrycks, S
D. Hendrycks, S. Basart, M. Mazeika, A. Zou, J. Kwon, M. Mostajabi, J. Steinhardt, and D. Song. Scaling Out-of-Distribution Detection for Real-World Settings. InInternational Conference on Machine Learning, 2022
2022
-
[34]
Howard, M
A. Howard, M. Sandler, B. Chen, W. Wang, L.-C. Chen, M. Tan, G. Chu, V . Vasudevan, Y . Zhu, R. Pang, H. Adam, and Q. Le. Searching for MobileNetV3. InIEEE International Conference on Computer Vision, 2019
2019
-
[35]
T. T. Høye, J. Ärje, K. Bjerge, O. L. P. Hansen, A. Iosifidis, F. Leese, H. M. R. Mann, K. Meissner, C. Melvad, and J. Raitoharju. Deep learning and computer vision will transform entomology.Proceedings of the National Academy of Sciences, 118(2), 2021. 12
2021
-
[36]
T. T. Høye, M. Dyrmann, C. Kjær, J. Nielsen, M. Bruus, C. L. Mielec, M. S. Vesterdal, K. Bjerge, S. A. Madsen, M. R. Jeppesen, and C. Melvad. Accurate image-based identification of macroinvertebrate specimens using deep learning—How much training data is needed? PeerJ, 10, 2022
2022
-
[37]
Ilharco, M
G. Ilharco, M. Wortsman, R. Wightman, C. Gordon, N. Carlini, R. Taori, A. Dave, V . Shankar, H. Namkoong, J. Miller, H. Hajishirzi, A. Farhadi, and L. Schmidt. OpenCLIP, 2021
2021
-
[38]
Impiö and J
M. Impiö and J. Raitoharju. Improving Taxonomic Image-based Out-of-distribution Detection With DNA Barcodes. InEuropean Signal Processing Conference, 2024
2024
-
[39]
A. Jain, F. Cunha, M. J. Bunsen, J. S. Cañas, et al. Insect Identification in the Wild: The AMI Dataset. InEuropean Conference on Computer Vision, 2024
2024
-
[40]
Jiang, R
H. Jiang, R. Lei, S.-W. Ding, and S. Zhu. Skewer: A fast and accurate adapter trimmer for next-generation sequencing paired-end reads.BMC Bioinformatics, 15(1), June 2014
2014
-
[41]
Keasar, M
T. Keasar, M. Yair, D. Gottlieb, L. Cabra-Leykin, and C. Keasar. STARdbi: A pipeline and database for insect monitoring based on automated image analysis.Ecological Informatics, 80, 2024
2024
-
[42]
P. W. Koh, S. Sagawa, H. Marklund, S. M. Xie, et al. WILDS: A Benchmark of in-the-Wild Distribution Shifts. InInternational Conference on Machine Learning, 2020
2020
-
[43]
N. Lang, V . Snæbjarnarson, E. Cole, O. Mac Aodha, C. Igel, and S. Belongie. From Coarse to Fine-Grained Open-Set Recognition. InIEEE/CVF Conference on Computer Vision and Pattern Recognition, 2024
2024
-
[44]
S. Liu, R. Garrepalli, T. Dietterich, A. Fern, and D. Hendrycks. Open Category Detection with PAC Guarantees. InInternational Conference on Machine Learning, 2018
2018
-
[45]
W. Liu, X. Wang, J. Owens, and Y . Li. Energy-based Out-of-distribution Detection. InNeural Information Processing Systems, volume 33, 2020
2020
-
[46]
Z. Liu, Y . Lin, Y . Cao, H. Hu, Y . Wei, Z. Zhang, S. Lin, and B. Guo. Swin Transformer: Hier- archical Vision Transformer using Shifted Windows. InIEEE/CVF International Conference on Computer Vision, 2021
2021
-
[47]
Loshchilov and F
I. Loshchilov and F. Hutter. SGDR: Stochastic Gradient Descent with Warm Restarts. In International Conference on Learning Representations, 2017
2017
-
[48]
Loshchilov and F
I. Loshchilov and F. Hutter. Decoupled Weight Decay Regularization. InInternational Conference on Learning Representations, 2019
2019
-
[49]
Lu and P
C. Lu and P. Koniusz. Few-shot Keypoint Detection with Uncertainty Learning for Unseen Species. InIEEE/CVF Conference on Computer Vision and Pattern Recognition, 2022
2022
-
[50]
Mäder, D
P. Mäder, D. Boho, M. Rzanny, M. Seeland, H. C. Wittich, A. Deggelmann, and J. Wäldchen. The Flora Incognita app – Interactive plant species identification.Methods in Ecology and Evolution, 12(7), 2021
2021
-
[51]
A. C. R. Marques, M. M. Raimundo, E. M. B. Cavalheiro, L. F. P. Salles, C. Lyra, and F. J. V . Zuben. Ant genera identification using an ensemble of convolutional neural networks.PLOS ONE, 13(1), 2018
2018
-
[52]
Martineau, D
M. Martineau, D. Conte, R. Raveaux, I. Arnault, D. Munier, and G. Venturini. A survey on image-based insect classification.Pattern Recognition, 65, 2017
2017
-
[53]
Maruf, A
M. Maruf, A. Daw, K. S. Mehrab, H. B. Manogaran, et al. VLM4Bio: A Benchmark Dataset to Evaluate Pretrained Vision-Language Models for Trait Discovery from Biological Images. InNeural Information Processing Systems, 2024. 13
2024
-
[54]
Miloševi´c, A
D. Miloševi´c, A. Milosavljevi ´c, B. Predi ´c, A. S. Medeiros, D. Savi ´c-Zdravkovi´c, M. Sto- jkovi´c Piperac, T. Kosti´c, F. Spasi´c, and F. Leese. Application of deep learning in aquatic bioassessment: Towards automated identification of non-biting midges.Science of The To...
2020
-
[55]
S. G. Müller and F. Hutter. TrivialAugment: Tuning-Free Yet State-of-the-Art Data Augmenta- tion. InIEEE/CVF Conference on Computer Vision and Pattern Recognition, pages 774–782, 2021
2021
-
[56]
Nguyen, T.-D
H.-Q. Nguyen, T.-D. Truong, X. B. Nguyen, A. Dowling, X. Li, and K. Luu. Insect-Foundation: A Foundation Model and Large-Scale 1M Dataset for Visual Insect Understanding. In IEEE/CVF Conference on Computer Vision and Pattern Recognition, 2024
2024
-
[57]
Nilsback and A
M.-E. Nilsback and A. Zisserman. Automated Flower Classification over a Large Number of Classes. InIndian Conference on Computer Vision, Graphics & Image Processing, 2008
2008
-
[58]
J. A. Noriega, J. Hortal, F. M. Azcárate, M. P. Berg, N. Bonada, M. J. I. Briones, I. Del Toro, D. Goulson, S. Ibanez, D. A. Landis, M. Moretti, S. G. Potts, E. M. Slade, J. C. Stout, M. D. Ulyshen, F. L. Wackers, B. A. Woodcock, and A. M. C. Santos. Research trends in ecosyst...
2018
-
[59]
M. S. Norouzzadeh, D. Morris, S. Beery, N. Joshi, N. Jojic, and J. Clune. A deep active learning system for species identification and counting in camera trap images.Methods in Ecology and Evolution, 12(1), 2021
2021
-
[60]
R. Y . Oliver, F. Iannarilli, J. Ahumada, E. Fegraus, N. Flores, R. Kays, T. Birch, A. Ranipeta, M. S. Rogan, Y . V . Sica, and W. Jetz. Camera trapping expands the view into global biodiversity and its change.Philosophical Transactions of the Royal Society B: Biological Scien...
2023
-
[61]
Oquab, T
M. Oquab, T. Darcet, T. Moutakanni, H. V . V o, et al. DINOv2: Learning Robust Visual Features without Supervision.Transactions on Machine Learning Research, 2023
2023
-
[62]
S. Pawar. Taxonomic Chauvinism and the Methodologically Challenged.BioScience, 53(9), 2003
2003
-
[63]
Radford, J
A. Radford, J. W. Kim, C. Hallacy, A. Ramesh, G. Goh, S. Agarwal, G. Sastry, A. Askell, P. Mishkin, J. Clark, et al. Learning transferable visual models from natural language supervi- sion. InInternational Conference on Machine Learning, 2021
2021
-
[64]
Ratnasingham and P
S. Ratnasingham and P. D. N. Hebert. BOLD: The Barcode of Life Data System (http://www.barcodinglife.org).Molecular Ecology Notes, 7(3), 2007
2007
-
[65]
A. C. Rodríguez, S. D’Aronco, R. C. Daudt, J. D. Wegner, and K. Schindler. Recognition of Unseen Bird Species by Learning From Field Guides. InIEEE/CVF Winter Conference on Applications of Computer Vision, 2024
2024
-
[66]
Russakovsky, J
O. Russakovsky, J. Deng, H. Su, J. Krause, S. Satheesh, S. Ma, Z. Huang, A. Karpathy, A. Khosla, M. Bernstein, A. C. Berg, and L. Fei-Fei. ImageNet Large Scale Visual Recognition Challenge.International Journal of Computer Vision, 115(3), 2015
2015
-
[67]
W. J. Scheirer, A. de Rezende Rocha, A. Sapkota, and T. E. Boult. Toward Open Set Recogni- tion.IEEE Transactions on Pattern Analysis and Machine Intelligence, 35(7), 2013
2013
-
[68]
Schneider, G
S. Schneider, G. W. Taylor, S. C. Kremer, P. Burgess, J. McGroarty, K. Mitsui, A. Zhuang, J. R. deWaard, and J. M. Fryxell. Bulk arthropod abundance, biomass and diversity estimation using deep learning for computer vision.Methods in Ecology and Evolution, 13(2), 2022
2022
-
[69]
Schneider, G
S. Schneider, G. W. Taylor, S. C. Kremer, and J. M. Fryxell. Getting the bugs out of AI: Advancing ecological research on arthropods through computer vision.Ecology Letters, 26(7), 2023. 14
2023
-
[70]
Schuhmann, R
C. Schuhmann, R. Beaumont, R. Vencu, C. W. Gordon, R. Wightman, M. Cherti, T. Coombes, A. Katta, C. Mullis, M. Wortsman, P. Schramowski, S. R. Kundurthy, K. Crowson, L. Schmidt, R. Kaczmarczyk, and J. Jitsev. LAION-5b: An open large-scale dataset for training next generation i...
2022
-
[71]
Seeland and P
M. Seeland and P. Mäder. Multi-view classification with convolutional neural networks.PLOS ONE, 16(1), 2021
2021
-
[72]
Seibold, M
S. Seibold, M. M. Gossner, N. K. Simons, N. Blüthgen, J. Müller, D. Ambarlı, C. Ammer, J. Bauhus, M. Fischer, J. C. Habel, K. E. Linsenmair, T. Nauss, C. Penone, D. Prati, P. Schall, E.-D. Schulze, J. V ogt, S. Wöllauer, and W. W. Weisser. Arthropod decline in grasslands and f...
2019
-
[73]
Simovi´c, A
P. Simovi´c, A. Milosavljevi´c, K. Stojanovi´c, M. Radenkovi´c, D. Savi´c-Zdravkovi´c, B. Predi´c, A. Petrovi´c, M. Božani´c, and D. Miloševi´c. Automated identification of aquatic insects: A case study using deep learning and computer vision techniques.Science of The Total En...
2024
-
[74]
Stark, V
T. Stark, V . ¸ Stefan, M. Wurm, R. Spanier, H. Taubenböck, and T. M. Knight. YOLO object detection models can locate and classify broad groups of flower-visiting arthropods in images. Scientific Reports, 13(1), 2023
2023
-
[75]
Stevens, J
S. Stevens, J. Wu, M. J. Thompson, E. G. Campolongo, C. H. Song, D. E. Carlyn, L. Dong, W. M. Dahdul, C. Stewart, T. Berger-Wolf, W.-L. Chao, and Y . Su. BioCLIP: A Vision Foundation Model for the Tree of Life. InIEEE/CVF Conference on Computer Vision and Pattern Recognition, 2024
2024
-
[76]
H. Su, S. Maji, E. Kalogerakis, and E. Learned-Miller. Multi-View Convolutional Neural Networks for 3D Shape Recognition. InIEEE International Conference on Computer Vision, 2015
2015
-
[77]
Tan and Q
M. Tan and Q. Le. EfficientNet: Rethinking Model Scaling for Convolutional Neural Networks. InInternational Conference on Machine Learning, 2019
2019
-
[78]
Tschannen, A
M. Tschannen, A. Gritsenko, X. Wang, M. F. Naeem, I. Alabdulmohsin, N. Parthasarathy, T. Evans, L. Beyer, Y . Xia, B. Mustafa, O. Hénaff, J. Harmsen, A. Steiner, and X. Zhai. SigLIP 2: Multilingual Vision-Language Encoders with Improved Semantic Understanding, Localization, an...
-
[79]
D. Tuia, B. Kellenberger, S. Beery, B. R. Costelloe, S. Zuffi, B. Risse, A. Mathis, M. W. Mathis, F. Van Langevelde, T. Burghardt, R. Kays, H. Klinck, M. Wikelski, I. D. Couzin, G. Van Horn, M. C. Crofoot, C. V . Stewart, and T. Berger-Wolf. Perspectives in machine learning fo...
2022
-
[80]
Vamos, V
E. Vamos, V . Elbrecht, and F. Leese. Short COI markers for freshwater macroinvertebrate metabarcoding.Metabarcoding and Metagenomics, 1, 2017
2017
-
[81]
Van Horn, S
G. Van Horn, S. Branson, R. Farrell, S. Haber, J. Barry, P. Ipeirotis, P. Perona, and S. Belongie. Building a bird recognition app and large scale dataset with citizen scientists: The fine print in fine-grained dataset collection. InIEEE Conference on Computer Vision and Patte...
2015
-
[82]
Van Horn, O
G. Van Horn, O. Mac Aodha, Y . Song, Y . Cui, C. Sun, A. Shepard, H. Adam, P. Perona, and S. Belongie. The INaturalist Species Classification and Detection Dataset. InIEEE/CVF Conference on Computer Vision and Pattern Recognition, 2018
2018
-
[83]
Van Horn, E
G. Van Horn, E. Cole, S. Beery, K. Wilber, S. Belongie, and O. MacAodha. Benchmarking Representation Learning for Natural World Image Collections. InIEEE/CVF Conference on Computer Vision and Pattern Recognition, 2021
2021
-
[84]
van Klink, T
R. van Klink, T. August, Y . Bas, P. Bodesheim, et al. Emerging technologies revolutionise insect ecology and monitoring.Trends in Ecology & Evolution, 37(10), 2022. 15
2022
-
[85]
van Klink, D
R. van Klink, D. E. Bowler, K. B. Gongalsky, M. Shen, S. R. Swengel, and J. M. Chase. Disproportionate declines of formerly abundant species underlie insect loss.Nature, 628 (8007), 2024
2024
-
[86]
van Klink, J
R. van Klink, J. K. Sheard, T. T. Høye, T. Roslin, L. A. Do Nascimento, and S. Bauer. Towards a toolkit for global insect biodiversity monitoring.Philosophical Transactions of the Royal Society B: Biological Sciences, 379, 2024
2024
-
[87]
S. Vaze, K. Han, A. Vedaldi, and A. Zisserman. Generalized Category Discovery. InIEEE/CVF Conference on Computer Vision and Pattern Recognition, 2022
2022
-
[88]
Vilmi, M
A. Vilmi, M. Järvinen, S. M. Karjalainen, K. Kulo, M. Kuoppala, S. Mitikka, J. Ruuhijärvi, T. Sutela, and J. Aroviita.Maa-ja metsätalouden kuormittamien pintavesien tila-MaaMet- seuranta 2008-2020, volume 50 ofSuomen ympäristökeskuksen raportteja. 2021
2008
-
[89]
H. Vu, O. Prabhune, U. Raskar, D. Panditharatne, H. Chung, C. Choi, and Y . Kim. MmCows: A Multimodal Dataset for Dairy Cattle Monitoring. InNeural Information Processing Systems, 2024
2024
-
[90]
S. Vyas, Y . S. Rawat, and M. Shah. Multi-view Action Recognition Using Cross-View Video Prediction. In A. Vedaldi, H. Bischof, T. Brox, and J.-M. Frahm, editors,European Conference on Computer Vision, 2020
2020
-
[91]
D. L. Wagner. Insect Declines in the Anthropocene.Annual Review of Entomology, 65(1), 2020
2020
-
[92]
C. Wah, S. Branson, P. Welinder, P. Perona, and S. Belongie. The Caltech-UCSD Birds- 200-2011 dataset. Technical Report CNS-TR-2011-001, California Institute of Technology, 2011
2011
-
[93]
Wang, S.-Y
Q.-J. Wang, S.-Y . Zhang, S.-F. Dong, G.-C. Zhang, J. Yang, R. Li, and H.-Q. Wang. Pest24: A large-scale very small object data set of agricultural pests for multi-target detection.Computers and Electronics in Agriculture, 175, 2020
2020
-
[94]
Y . Wang, Q. Yao, J. T. Kwok, and L. M. Ni. Generalizing from a Few Examples: A Survey on Few-shot Learning.ACM Computing Surveys, 53(3), 2020
2020
-
[95]
C. W. Wardhaugh. Estimation of biomass from body length and width for tropical rainforest canopy invertebrates.Australian Journal of Entomology, 52(4), 2013
2013
-
[96]
Wei, Y .-Z
X.-S. Wei, Y .-Z. Song, O. M. Aodha, J. Wu, Y . Peng, J. Tang, J. Yang, and S. Belongie. Fine-Grained Image Analysis With Deep Learning: A Survey.IEEE Transactions on Pattern Analysis and Machine Intelligence, 44(12), 2022
2022
-
[97]
Wightman
R. Wightman. PyTorch image models, 2019
2019
-
[98]
X. Wu, C. Zhan, Y .-K. Lai, M.-M. Cheng, and J. Yang. IP102: A Large-Scale Benchmark Dataset for Insect Pest Recognition. InIEEE/CVF Conference on Computer Vision and Pattern Recognition, 2019
2019
-
[99]
Wührl, C
L. Wührl, C. Pylatiuk, M. Giersch, F. Lapp, T. von Rintelen, M. Balke, S. Schmidt, P. Cerretti, and R. Meier. DiversityScanner: Robotic handling of small invertebrates with machine learning methods.Molecular Ecology Resources, 22(4), 2022
2022
-
[100]
X. Yu, Y . Zhao, Y . Gao, X. Yuan, and S. Xiong. Benchmark Platform for Ultra-Fine-Grained Visual Categorization Beyond Human Performance. InIEEE/CVF International Conference on Computer Vision, 2021
2021
-
[101]
jump out
X. Zhai, B. Mustafa, A. Kolesnikov, and L. Beyer. Sigmoid Loss for Language Image Pre-Training. InIEEE/CVF International Conference on Computer Vision, 2023. 16 A Supplementary material for Section 3 AquaMonitor dataset A.1 Lakes and sites Species counts per site are given in ...
2021
Reviewed August 7, 2026 · model on record in the stance chip above.
Discussion (0). Sign in to comment.