REVIEW 4 major objections 6 minor 15 references
Advancing Hearing Assessment: An ASR-Based Frequency-Specific Speech Test for Diagnosing Presbycusis
T0 review · 4 major / 6 minor · reviewed 2026-08-07 · deepseek-v4-flash
Pith's one-line read ASR-confusion word pairs separate simulated hearing-loss listeners
desk verdict A clean, readable pipeline description with a circular validation; the simulated diagnostic claim is an artifact of the setup, so the paper is not ready for peer review despite the plausible phoneme-confusion analysis. read the letter →
The pith
A machine-rendered reading of the paper's core claim, the machinery that carries it, and where it could break.
The reading
What carries the argument
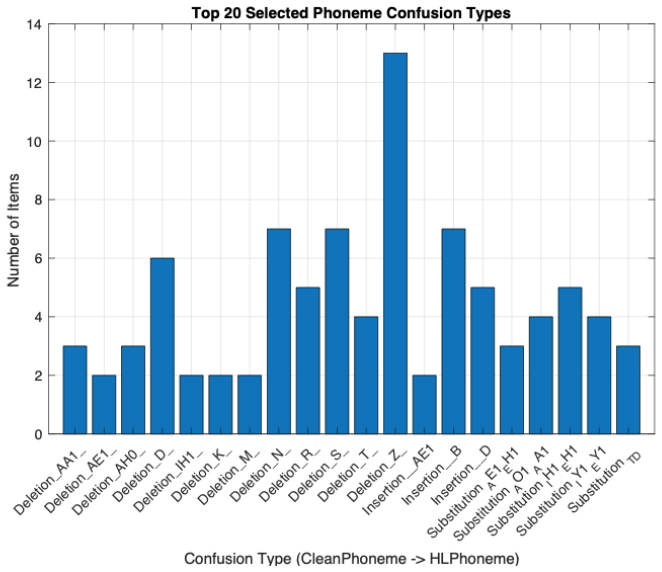
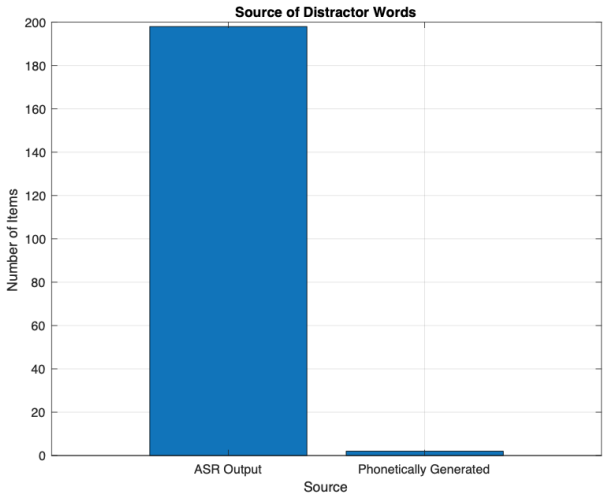
The load-bearing mechanism is the phoneme confusion matrix: aligning the ASR's clean transcription with its hearing-loss transcription and counting substitutions, deletions, and insertions via Levenshtein alignment. This matrix identifies which phoneme contrasts degrade under the simulated audiogram, and a reverse phonetic lexicon turns the top confusions into minimal word pairs. The curated 200-pair battery is then scored by a simulated listener whose response is chosen by phonetic Levenshtein distance, and group separation is quantified by ROC analysis with Youden's J selecting the operating threshold. The same ASR plus filtering pipeline is used to create the test and to evaluate it, which is what makes the simulation internally consistent.
What would settle it
A human validation study: recruit normal-hearing and presbycusis participants, administer the curated 200-pair test, and compare their error patterns and group separation against the ASR predictions. If human confusions do not resemble the ASR confusion matrix, or if the test fails to separate the groups with useful sensitivity and specificity, the central claim fails.
Extended reading notes
Core claim
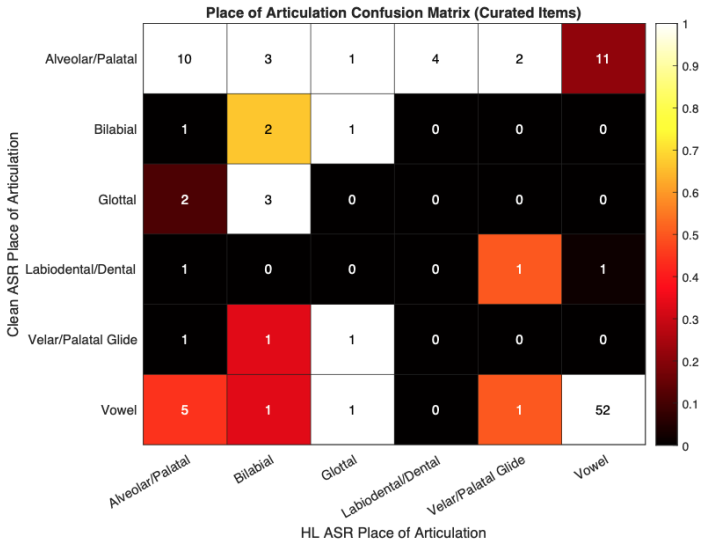
The paper's central claim is that phoneme-level errors made by an ASR system after mild-to-moderate sloping-loss filtering and pink noise are a usable proxy for the perceptual confusions of presbycusis, and that a test built from these errors can discriminate hearing-impaired from normal-hearing listeners. Under simulated moderate sloping loss the dominant error pattern is substitution of alveolar/palatal phonemes by labiodental ones (e.g., /s/ becomes /f/), along with frequent deletions of high-frequency consonants and vowel changes attributed to formant degradation. From roughly 30,000 phoneme discrepancies, the author curated 200 word pairs balanced across substitution (52.7%), deletion (34.9%), and insertion (12.4%) errors, each pair matched in syllable count and limited in lexical distance. In a simulated administration with 50 normal and 50 impaired virtual listeners, the percent-correct distributions separated and the test's ROC curve yielded a discriminative operating point, with an 80% correct threshold marking the trade-off between sensitivity and specificity. The paper presents this as evidence of diagnostic value in silico and explicitly calls for human validation as the next step.
Load-bearing premise
The load-bearing premise is that the phoneme errors an ASR makes after simple frequency filtering and pink noise match the errors a human with presbycusis would make, so test items chosen by ASR errors will diagnose human hearing loss; the paper states this proxy is unvalidated.
Editorial extensions
If this is right
- If the approach holds in humans, a patient could take a short two-alternative word test and receive a phoneme-confusion profile that points to specific frequency regions affected, rather than only an audiogram threshold.
- The observed confusions imply that high-frequency consonant cues (especially sibilants and alveolar/palatal stops) carry most of the diagnostic signal for moderate sloping loss, so test items can be weighted toward those sounds.
- Because the test uses ASR scoring, administration and scoring could be automated and standardized, reducing clinician time relative to manually scored speech tests.
- The diagnostic-difference metric (NH correct minus HL correct) provides a principled way to select or reject word pairs, and varying test length from 50 to 200 items allows trading test duration against discriminative power.
Reading between the lines
- A direct extension would be to run the same curation pipeline on ASR outputs after other simulated audiogram shapes, yielding confusion profiles that might reveal whether the test localizes the frequency region of loss rather than only detecting its presence.
- Because the simulation models audibility only, adding supra-threshold distortion models such as reduced frequency selectivity or temporal smearing would test whether the curated pairs remain discriminative when auditory distortion beyond attenuation is present.
- A stronger validation would be to administer the curated pairs to human listeners and to a second, independent ASR model not used for item selection; agreement between the two would indicate the confusions are general rather than idiosyncratic to the original recognizer.
Editorial analysis
A structured set of objections, weighed in public.
Referee Report
Summary. This manuscript proposes an ASR-based, frequency-specific speech test for presbycusis. The authors filter TIMIT words to simulate moderate sloping hearing loss, analyze phoneme-level ASR confusions, curate 200 word pairs that maximize the difference between ASR percent correct under normal-hearing and hearing-loss simulation, and then evaluate the curated battery by simulating 50 normal-hearing and 50 hearing-impaired listeners whose responses are generated by the same ASR model with the same filtering. They report confusion patterns (e.g., /S/→/F/), item characteristics, ROC curves, and AUC as evidence that the battery can differentiate simulated normal-hearing from hearing-impaired listeners. The paper explicitly frames human validation as future work, and its Limitations section acknowledges that the ASR proxy is unvalidated.
Significance. If the proposed method were shown to yield a speech test that discriminates human listeners with presbycusis from normal-hearing listeners, it could be a useful complement to pure-tone audiometry, particularly because the phoneme-level output could provide a 'confusion profile' rather than a single threshold. The paper's strengths are its clear modular pipeline, the use of a well-known corpus (TIMIT), the explicit reporting of many free parameters, and the candid acknowledgment that the ASR is an unvalidated proxy. However, the central diagnostic claim in the abstract and in Discussion RQ3 is not supported as it stands: the simulated evaluation is engineered by construction, so the reported ROC/AUC does not test whether the curated items have diagnostic value for humans or even for the ASR proxy in an independent sense.
major comments (4)
- [§2.5, Eq. (Diagnostic Difference) and §3.3] The load-bearing evaluation is circular. In §2.5, word pairs are included in the final battery only if 'Diagnostic Difference = NH Correct Percentage − HL Correct Percentage' exceeds a threshold, with both percentages computed from the same ASR-plus-filter model that is later used in §3.3 to simulate the NH and HI listeners. The simulated 'participants' are therefore not independent of the item selection criterion: the test battery is curated to maximize the exact quantity that the simulated experiment then measures. A meaningful validation would require held-out items, an independent response model, or human data; none of these are provided.
- [§3.3, HL impact factor] The simulated HI listener's psychometric function includes an explicit 'HL impact factor (0.05 per dB HL)' that mechanically lowers percent correct as the participant's audiometric loss increases. With this term present, any reasonable set of items will produce separation between the NH and HI groups, and the ROC/AUC in Figure 9 largely reflects the chosen penalty parameter rather than the diagnostic content of the curated phoneme confusions. The authors do not report the AUC that would be obtained without this term or with alternative penalty values, so the claimed discriminative power is not demonstrated to be attributable to the items.
- [§2.2 and Limitations] The validity of the entire pipeline depends on the premise that ASR errors after linear filtering and pink noise faithfully mimic the phoneme confusions of human listeners with presbycusis. The paper provides no human confusion data, no comparison against published human confusion matrices, and no quantitative justification for the chosen filter slopes, SNR, or the mapping from audiometric loss to ASR degradation. The Limitations section correctly states that the ASR proxy is unvalidated, but that acknowledgment does not rescue the simulation-based claim of diagnostic value; it highlights that the central claim rests on an unverified premise.
- [§3.3] The simulation parameters are numerous and the sensitivity of the results to them is not reported. The base audiogram, ±10 dB perturbation, sigmoid slope k=0.8, HL impact factor 0.05 per dB, test failure threshold 80%, and the Diagnostic Difference inclusion threshold are all free parameters. Since the reported ROC depends on these choices, the authors should provide a sensitivity analysis or a principled justification for each value. Without that, the quantitative claims (e.g., the AUC in Figure 9) are not reproducible conclusions but rather outputs of a particular parameter setting.
minor comments (6)
- [§2.1] The ASR model is described as 'e.g., based on wav2vec 2.0 architecture'; the specific model, checkpoint, and decoding settings should be identified precisely to make the experiment reproducible.
- [§2.2] The audiogram profiles are given only as endpoint values (e.g., 10 dB HL at 250 Hz to 70 dB HL at 8000 Hz); the interpolation rule and the FIR filter implementation should be specified.
- [§3.1] The passage describing Alveolar/Palatal confusions appears verbatim twice in the text, which should be corrected.
- [§2.4] The description of the ASR's 'choice' in the test administration simulation is incomplete: it mentions the smaller phonetic Levenshtein distance between the ASR output and the two options, but it does not explain how ties are broken or how the choice probabilities are converted into deterministic responses in the reported experiments.
- [Table 3] The table lists 53 of the 200 curated items; the complete list should be provided as supplementary material so that the item-selection criteria can be checked.
- [§4, Limitations] The claim that ASR errors correlate with 'known effects of presbycusis' is presented without a systematic comparison to the cited psychoacoustic literature; a brief quantitative link (e.g., confusion rates from published human studies) would strengthen the argument.
Circularity Check
Simulated diagnostic separation is engineered: the 200-pair battery is curated by the same ASR/filter model used to simulate patients, and the response model's explicit HL impact factor mechanically lowers hearing-impaired scores.
-
fitted input called prediction
[Section 2.5 (Performance Evaluation and Diagnostic Item Selection), evaluated in Section 3.3 (Simulated Test Administration Results)]
"A "Diagnostic Difference" was calculated as: Diagnostic Difference = NH Correct Percentage−HL Correct Percentage ... Only word pairs exceeding a predefined diagnostic difference threshold (e.g., 5%) were included in the final test battery."
The 200 word pairs are selected to maximize the exact quantity (NH minus HL percent correct) that Section 3.3 then reports as evidence of diagnostic value. The simulated NH and HI listeners are produced by the same ASR-pipeline-with-filtering/hearing-loss-simulation used to compute that difference (Sections 2.2 and 2.4), so the AUC and separation in Figures 7-9 are the in-sample value of the selection criterion. There is no held-out word set, independent model, or human data against which the curated battery is tested.
-
self definitional
[Section 3.3 (Simulated Test Administration Results)]
"The simulation parameters included a base moderate sloping HL audiogram for impaired participants with±10 dB variability, and a psychometric function incorporating phoneme Levenshtein distance with a sigmoid slope (k=0.8) and a HL impact factor (0.05 per dB HL)."
By construction, the simulated hearing-impaired listener's response function contains an explicit HL impact factor that reduces scores as audiometric loss increases, while NH listeners have no such factor. With any test items that have nonzero phoneme-distance structure, this term alone guarantees that HI scores fall below NH scores, so the reported ROC/AUC measures the imposed penalty rather than the diagnostic content of the curated pairs. The central RQ3 claim is therefore an input to the psychometric model, not an independent result.
full rationale
The paper's Limitations section honestly concedes that ASR is an unvalidated proxy and that no human validation was performed. That concession is important but does not repair the more fundamental circularity in the simulated evaluation. Item curation in Section 2.5 selects the 200 pairs by maximizing 'Diagnostic Difference = NH Correct Percentage − HL Correct Percentage' on the ASR/filter hearing-loss simulation, and Section 3.3 evaluates the battery by simulating NH and HI listeners with the same ASR/filter pipeline, adding an explicit 'HL impact factor (0.05 per dB HL)' to the HI psychometric function. The diagnostic separation in Figures 7-9 is therefore forced by construction: the items were chosen for their large predicted difference on this model, and the HI response model lowers scores mechanically with dB HL. The phoneme-confusion findings (e.g., /S/→/F/) may be plausible and consistent with known audibility effects, but the load-bearing claim of 'demonstrated diagnostic value' reduces to the selection criterion and the imposed penalty. No self-citation chain is involved, and the paper does not present any external benchmark that would break the circle.
Assumptions & free parameters
free parameters (7)
- Pink noise SNR =
10 dB typical; optimal from {5, 10, 20} dB chosen per item
- Sigmoid slope k of simulated listener response =
0.8
- HL impact factor =
0.05 per dB HL
- Test failure threshold =
80% correct
- Diagnostic difference inclusion threshold =
5%
- Moderate sloping HL base audiogram =
10 dB HL at 250 Hz to 70 dB HL at 8000 Hz
- HI audiogram perturbation range =
±10 dB
assumptions (5)
- domain assumption ASR phoneme errors under frequency-dependent attenuation plus pink noise approximate human phoneme confusions in presbycusis.
- domain assumption Hearing loss can be modeled by a linear FIR filter and additive noise.
- standard math Levenshtein alignment of phoneme sequences yields valid substitution, deletion, and insertion counts.
- domain assumption TIMIT read speech and CMUdict are adequate stimulus and lexicon sources for a clinical speech test.
- domain assumption The wav2vec 2.0-based ASR is a suitable stand-in for human speech perception.
Cite this review
Pith. "Pith review of Advancing Hearing Assessment: An ASR-Based Frequency-Specific Speech Test for Diagnosing Presbycusis." pith.science (2026). https://pith.science/paper/TV5I7JEW
@misc{pith2026250522231,
  author       = {Pith},
  title        = {Pith review of: Advancing Hearing Assessment: An ASR-Based Frequency-Specific Speech Test for Diagnosing Presbycusis},
  year         = {2026},
  howpublished = {\url{https://pith.science/paper/TV5I7JEW}},
  note         = {Machine review of arXiv:2505.22231}
}
read the original abstract
Traditional audiometry often fails to fully characterize the functional impact of hearing loss on speech understanding, particularly supra-threshold deficits and frequency-specific perception challenges in conditions like presbycusis. This paper presents the development and simulated evaluation of a novel Automatic Speech Recognition (ASR)-based frequency-specific speech test designed to provide granular diagnostic insights. Our approach leverages ASR to simulate the perceptual effects of moderate sloping hearing loss by processing speech stimuli under controlled acoustic degradation and subsequently analyzing phoneme-level confusion patterns. Key findings indicate that simulated hearing loss introduces specific phoneme confusions, predominantly affecting high-frequency consonants (e.g., alveolar/palatal to labiodental substitutions) and leading to significant phoneme deletions, consistent with the acoustic cues degraded in presbycusis. A test battery curated from these ASR-derived confusions demonstrated diagnostic value, effectively differentiating between simulated normal-hearing and hearing-impaired listeners in a comprehensive simulation. This ASR-driven methodology offers a promising avenue for developing objective, granular, and frequency-specific hearing assessment tools that complement traditional audiometry. Future work will focus on validating these findings with human participants and exploring the integration of advanced AI models for enhanced diagnostic precision.
Figures

Figures from the paper (7 more)




Reference graph
Works this paper leans on
-
[1]
Plomp, R. (1978).Auditory handicap of hearing impairment and the limited benefit of hearing aids.The Journal of the Acoustical Society of America, 63(2), 533-549
work page 1978
-
[2]
Humes, L. E. (2007).The Importance of Speech Audibility.The ASHA Leader, 12(6), 12-15
work page 2007
-
[3]
Oxenham, A. J. (2008). Cochlear compression: implications for hearing aids and listeners with hearing impairment.Trends in Amplification, 12(4), 289-301
work page 2008
-
[4]
Henry, K. S., & Heinz, M. G. (2022).Distorted Tonotopy Severely Degrades Neural Representations of Connected Speech in Noise following Acoustic Trauma.Journal of Neuroscience, 42(12), 2548-2565
work page 2022
-
[5]
Giguère, C., & Braida, L. D. (1995).Using phonetic confusions to estimate the shape of the audiogram.The Journal of the Acoustical Society of America, 98(2), 738-751
work page 1995
-
[6]
Jean et al. (2025). Automating Speech Audiometry in Quiet and in Noise Using a Deep Neural Network. MDPI Biology
2025
-
[7]
Meyer, B., etal.(2015).AutonomousMeasurementofSpeechIntelligibility: Potential and Limitations of Automatic Speech Recognition. Interspeech
work page 2015
-
[8]
Phoneme and Word Scoring in Speech-in-Noise Audiometry
Billings, C., (2016). Phoneme and Word Scoring in Speech-in-Noise Audiometry. American Journal of Audiology
work page 2016
Show all 15 references
-
[9]
Polspoel, D., et al. (2025). Automatic development of speech-in-noise hearing tests using machine learning. Nature
2025
-
[10]
Zhou, H., et al. (2025). Unveiling the Best Practices for Applying Speech Founda- tion Models to Speech Intelligibility Prediction for Hearing-Impaired People [cs.AI]. arXiv.org
2025
-
[11]
Yang, C.-K., et al. (2025). Towards Holistic Evaluation of Large Audio-Language Models: A Comprehensive Survey. arXiv.org
2025
-
[12]
Fontan, L., et al. (2022). Using Automatic Speech Recognition and Hearing-Loss Simulation to Optimize Hearing-Aid Fittings for Speech Identification by Older Lis- teners. Frontiers in Neuroscience
2022
-
[13]
D., et al
Borre, E. D., et al. (2022). Model-Projected Cost-Effectiveness of Adult Hearing Screening in the USA. J Gen Intern Med. 20
2022
-
[14]
(2024).Automatic Speech Recognition of Conversational Speech in Individuals With Disordered Speech
Tonin, J., et al. (2024).Automatic Speech Recognition of Conversational Speech in Individuals With Disordered Speech. Journal of Speech, Language, and Hearing Re- search
2024
-
[15]
Cooke, M., Barker, J., Cunningham, S., &Shao, X.(2006).Anaudio-visualcorpusfor speech perception and automatic speech recognition.The Journal of the Acoustical Society of America, 120(5), 2421-2424. 21
2006
Reviewed August 7, 2026 · model on record in the stance chip above.
Discussion (0). Sign in to comment.