REVIEW 4 major objections 6 minor 12 references
Thermophysical Properties and Phase Behavior of CO2 with Impurities: Insight from Molecular Simulations
T0 review · 4 major / 6 minor · reviewed 2026-08-07 · deepseek-v4-flash
Pith's one-line read Molecular simulations show that in CO2-rich mixtures, impurities such as N2, Ar, H2, and CH4 lower thermal expansion, compressibility, heat capacity, and Joule-Thomson coefficients in the gas phase but raise them in liquid and…
desk verdict A genuinely new simulation dataset for CO2-rich mixtures with plausible impurity trends, but the second-derivative errors are too large for 'good agreement' and the trends need a mixing-rule sensitivity check before being used as a reference. read the letter →
The pith
A machine-rendered reading of the paper's core claim, the machinery that carries it, and where it could break.
The reading
What carries the argument
The machinery is fluctuation thermodynamics in molecular simulation. Ensemble averages of volume, internal energy, and enthalpy fluctuations in NPT and NVT Monte Carlo runs yield isothermal compressibility, thermal expansion, and residual heat capacities; these feed the identities $c = \sqrt{v C_P / (M C_V \beta_T)}$ for speed of sound and $\mu_{JT} = V/C_P (T \alpha_P - 1)$ for the Joule-Thomson coefficient. Viscosities come from equilibrium molecular dynamics via the order-n OCTP algorithm. All interatomic interactions use 12-6 Lennard-Jones potentials with Lorentz-Berthelot combining rules and no binary interaction parameters.
What would settle it
A decisive test would be high-precision experimental speed-of-sound and density measurements for a 95/5 CO2/H2 mixture at, say, 273 K and 150 bar (liquid/supercritical) and at 313 K and 40 bar (gas), directly matching simulation state points; the central claim predicts opposite signs of the impurity shift in the two phases, so agreement with both would corroborate the phase-inversion mechanism while disagreement in either phase would falsify it.
Extended reading notes
Core claim
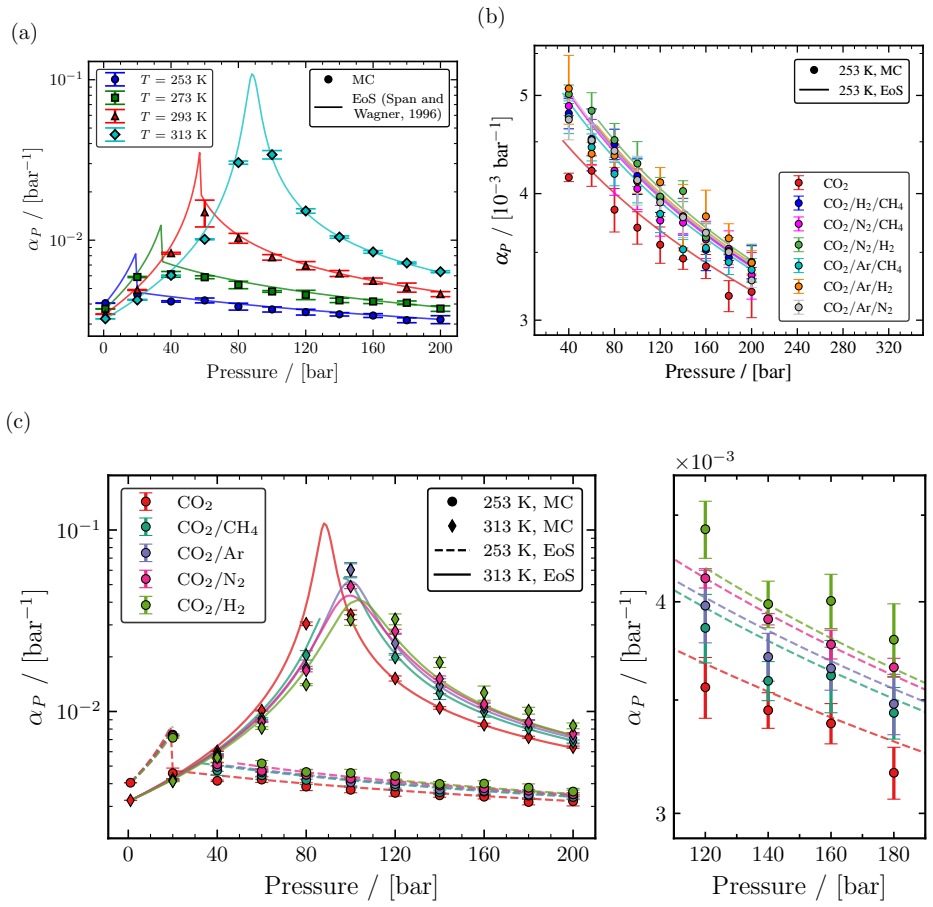
The central claim is that the influence of an impurity on CO2-rich mixture properties is not a single shift but a phase-symmetric inversion: impurities soften the gas-phase response (lower thermal expansion, isothermal compressibility, heat capacities, and Joule-Thomson coefficient; higher speed of sound) and stiffen the dense-phase response (higher thermal expansion, isothermal compressibility, heat capacities, and Joule-Thomson coefficient; lower speed of sound). The strength of the effect follows the impurity's critical temperature, with H2 the most influential and CH4 the least. The authors present the full data tables as a reference set for designing CO2 transport operations, and they validate the force-field-based approach against the Span-Wagner EoS for pure CO2, the GERG-2008 EoS for mixtures, and experimental VLE data for the four binary pairs.
Load-bearing premise
Everything hinges on the Lorentz-Berthelot combining rules for CO2-impurity interactions, used with no binary interaction parameters fitted to data; if those cross-interactions are systematically wrong, every mixture property inherits the error, and the phase-dependent impurity trends could be artifacts.
Editorial extensions
If this is right
- Pipeline transient models (startup, shutdown, depressurization) must include impurity-level-dependent thermal expansion, compressibility, Joule-Thomson coefficient, and speed of sound, since these change by up to roughly 20 percent and the impurity effect switches sign across the phase boundary.
- Equations of state validated mainly on gas-phase or pure-component data are at risk exactly where impurity effects invert, so the simulation tables provide a benchmark for refitting mixture EoS.
- H2 appears as the most influential impurity, meaning CO2 streams from pre-combustion capture or hydrogen-blended transport require the tightest operating-window constraints.
- The data set maps how the Widom line and the Joule-Thomson inversion pressure shift as impurity content grows, which is relevant for avoiding two-phase flow in pipelines.
Reading between the lines
- Editorial inference: because the impurity-order correlates with critical temperature, the same qualitative ranking likely holds for other light impurities (e.g., O2, CO) not simulated here, though magnitudes would need verification with their force fields.
- Editorial inference: the systematic overprediction of heat capacity and speed of sound near the saturation/Widom line suggests that a single fitted binary interaction parameter per CO2-impurity pair, calibrated on VLE data, could reduce the residual deviations the authors report.
- Editorial inference: the computed tables could be turned into a surrogate model for multiphase pipeline codes, since speed of sound measurements are a practical non-invasive way to detect phase transitions.
Editorial analysis
A structured set of objections, weighed in public.
Referee Report
Summary. The manuscript reports Monte Carlo and molecular dynamics simulations of pure CO2 and CO2-rich binary, ternary, and quaternary mixtures with N2, Ar, H2, and CH4 impurities at 1-10 mol%, over 235-313 K and 20-200 bar. The authors compute densities, thermal expansion coefficients, isothermal compressibilities, heat capacities, Joule-Thomson coefficients, speed of sound, and viscosities using standard fluctuation formulas, and compare them against the Span-Wagner, GERG-2008, and REFPROP/EoS references. The central claim is that impurities decrease thermal expansion coefficients, isothermal compressibilities, heat capacities, and Joule-Thomson coefficients in the gas phase, while increasing them in liquid and supercritical phases, and that the opposite holds for speed of sound. The paper also asserts that the computed data are in good agreement with the reference equations of state and provides an extensive data set for pipeline design.
Significance. If the reported trends are robust, the manuscript would provide a useful simulation-based data set for CO2 transportation design, filling a gap where experimental data for dilute impurities are scarce. The fluctuation formalism is standard and correctly implemented, and the open-source tools (Brick-CFCMC, LAMMPS/OCTP) are appropriate. The validation of pure-component VLE and densities is a strength. However, the central qualitative claim rests on the accuracy of unadjusted Lorentz-Berthelot cross interactions, and the paper's own reported deviations for second-derivative properties (up to 20-22%) are large enough that the trends must be shown to be insensitive to the mixing rule before the conclusions can be accepted as physical rather than force-field artifacts.
major comments (4)
- [§4.1.4, §4.1.5, §4.1.7] The abstract and §5 claim 'good agreement' with EoS for the mixture properties, but the body reports maximum relative deviations of ca. 22.5% for βT of CO2/H2 (§4.1.4), ca. 15.7% for cP of CO2/H2 (§4.1.5), and systematic overprediction of speed of sound by up to roughly 10% (§4.1.7). These are not 'good agreement' in the usual sense for second-derivative properties. The authors should replace the qualitative claim with a quantitative statement of the deviations, distinguish between first- and second-derivative properties, and indicate which properties and state points support the strongest version of the conclusion.
- [§4.1.3, §4.1.4] The text repeatedly excludes 'state points close to the critical point' (also called 'saturation/Widom line') when reporting maximum deviations, but no a priori criterion is given for identifying these points. This exclusion is post-hoc and could remove the very state points where the impurity effect is largest. The authors should define an objective criterion (e.g., distance from the critical point or Widom line based on density fluctuations) and show that the qualitative conclusions are unchanged when those points are either included or excluded under that criterion.
- [§4.1.1 and §4.1.2] The mixture validation relies on comparison with GERG-2008, which the authors themselves note was not developed for CO2-rich mixtures (§4). Since the cross-interactions are set by Lorentz-Berthelot rules with no binary interaction parameters (§4.1.1), the observed ordering of impurity effects (H2 > N2 > Ar > CH4) could be an artifact of the combining rules rather than a physical trend. The paper should provide a sensitivity test, e.g., by varying the cross-interaction εij by a few percent or using literature kij values, and demonstrate that the qualitative trends in βT, αP, cP, and speed of sound are unchanged. Binary VLE at 250-253 K alone is insufficient to validate second-derivative properties at 313 K and pressures up to 200 bar.
- [§4.1.3, §4.1.6] The central claim compares mixture properties to pure CO2 at the same T and P, but it is not always clear that the comparisons are made in the same phase. For example, at 253 K and 20-40 bar pure CO2 may be in a different phase regime than a mixture with 10 mol% H2, and near the saturation line the sign of the impurity effect may depend on whether the reference state is liquid, vapor, or supercritical. The authors should explicitly define how the gas/liquid/supercritical classification is assigned and verify that the reported 'impurities decrease in gas, increase in liquid/supercritical' pattern is not an artifact of comparing states of different phase identity.
minor comments (6)
- [Abstract and §4.1.2] The abstract states the temperature range as (235-313) K, while the text and figures use 253-313 K. Please reconcile these values throughout.
- [§4.1.5] The caption of Fig. 5(a) and the text of §4.1.5 list the temperatures as '253 K, 293 K, 293 K, and 313 K'; one of the 293 K entries should be 273 K. The same typo appears in the text of §4.1.4 and §4.1.6.
- [§4.1.8/§3 (if applicable)] The text refers to 'Joule-Thompson coefficient' in several places; the standard spelling is 'Joule-Thomson'. This affects Eqs. (12), Fig. 7, and the associated text.
- [§4.1.1] The statement that GERG-2008 'fails to converge for pressures larger than 170 bar' for CO2/H2 is interesting, but the source of the non-convergence (numerical vs. model limitation) and its implications for the use of GERG-2008 as a reference for the other mixtures should be stated more explicitly.
- [Table S11 / §4] The table listing EoS and correlation models in REFPROP is referenced as 'Table S11 of the Supporting Information', but the main text does not indicate which REFPROP models are used for each multicomponent mixture beyond GERG-2008. Please clarify the exact EoS used for each property comparison.
- [Various] The manuscript contains typographical inconsistencies such as 'NPTversion' (missing space), 'CO2' vs 'CO 2' formatting, and 'doi' not being resolved in the reference list. A careful proofreading pass is recommended.
Circularity Check
No significant circularity: the mixture property trends are genuine molecular-simulation predictions benchmarked against independent equations of state.
full rationale
The paper's derivation chain is self-contained. All thermodynamic and transport properties (densities, alpha_P, beta_T, c_P, c_V, mu_JT, speed of sound, viscosity) are computed from standard statistical-mechanical fluctuation formulas (Lagache et al., ref 45; Allen and Tildesley, ref 49) applied to force-field simulations, not by fitting outputs to the reference data. The force fields are taken from the literature (TraPPE for CO2/N2/CH4, Koster et al. for H2, Garcia-Perez et al. for Ar) with no binary interaction parameters adjusted to the target properties; the Lorentz-Berthelot combining rules are stated explicitly (Eqs. 18-19) and are a modeling assumption, not a fitted input. Validation is external: pure-component and binary VLE are compared to experimental data (refs 85-89) and to the GERG-2008 EoS, and the single-phase properties are compared to Span-Wagner, GERG-2008, REFPROP, and Laesecke et al. These references are independent of the simulation outputs and are not used to define the computed quantities. Self-citations occur (Brick-CFCMC software refs 51-53, OCTP ref 82, prior H2 force-field comparison ref 36, and Ramdin et al. ref 26), but none is load-bearing in a circular sense: Brick and OCTP are open-source tools, and ref 36 is a previously published comparative benchmark rather than an unverified premise invoked to force the present conclusions. The central impurity trends (decreases in alpha_P, beta_T, c_P, mu_JT and increases in speed of sound in the gas phase, with opposite behavior in liquid/supercritical phases) emerge from the simulations and are also seen in the independent EoS, but the simulations are not calibrated to produce them. Concerns about Lorentz-Berthelot accuracy are legitimate uncertainty and robustness issues, not circularity. Therefore the paper is not circular.
Assumptions & free parameters
assumptions (6)
- domain assumption Classical force fields with pairwise additive Lennard-Jones plus point charges accurately represent thermophysical properties of CO2, N2, Ar, H2, and CH4 across the studied range.
- domain assumption Lorentz-Berthelot combining rules without binary interaction parameters are adequate for CO2/N2, CO2/Ar, CO2/H2, and CO2/CH4 cross interactions.
- standard math Fluctuation formulas (Eqs. 8, 9, 11, 14) correctly relate ensemble fluctuations to thermodynamic derivatives.
- domain assumption System sizes of 300 molecules for MC and 100 to 400 molecules for MD are sufficient to represent bulk properties away from the critical point.
- domain assumption REFPROP/GERG-2008 and Span-Wagner EoS are accurate reference data for validation of the simulated properties.
- domain assumption Hydrogen can be modeled classically at temperatures above 250 K despite quantum effects at low temperatures.
Cite this review
Pith. "Pith review of Thermophysical Properties and Phase Behavior of CO2 with Impurities: Insight from Molecular Simulations." pith.science (2026). https://pith.science/paper/3RJVYBMK
@misc{pith2026250522268,
  author       = {Pith},
  title        = {Pith review of: Thermophysical Properties and Phase Behavior of CO2 with Impurities: Insight from Molecular Simulations},
  year         = {2026},
  howpublished = {\url{https://pith.science/paper/3RJVYBMK}},
  note         = {Machine review of arXiv:2505.22268}
}
read the original abstract
Experimentally determining thermophysical properties for various compositions commonly found in CO2 transportation systems is extremely challenging. To overcome this challenge, we performed Monte Carlo (MC) and molecular dynamics (MD) simulations of CO2 rich mixtures to compute thermophysical properties such as densities, thermal expansion coefficients, isothermal compressibilities, heat capacities, Joule-Thomson coefficients, speed of sound, and viscosities at temperatures (235-313) K and pressures (20-200) bar. We computed thermophysical properties of pure CO2 and CO2 rich mixtures with N2, Ar, H2, and CH4 as impurities (1-10) mol% and showed good agreement with available equations of state (EoS). We showed that impurities decrease the values of thermal expansion coefficients, isothermal compressibilities, heat capacities, and Joule-Thomson coefficients in the gas phase, while these values increase in the liquid and supercritical phases. In contrast, impurities increase the value of speed of sound in the gas phase and decrease it in the liquid and supercritical phases. We present an extensive data set of thermophysical properties for CO2 rich mixtures with various impurities, which will help to design the safe and efficient operation of CO2 transportation systems.
Figures


Figures from the paper (9 more)


Reference graph
Works this paper leans on
-
[1]
(1) Lee, H.; Calvin, K.; Dasgupta, D.; Krinner, G.; Mukherji, A.; Thorne, P.; Trisos, C.; Romero, J.; Aldunce, P.; Barrett, K.; Blanco, G.; Cheung, W. W. L.; Connors, S. L.; Denton, F.; Diongue-Niang, A.; Dodman, D.; Garschagen, M.; Geden, O.; Hayward, B.; Jones, C.; Jotzo, F.; Krug, T.; Lasco, R.; Lee, J.-Y.; Masson-Delmotte, V.; Mein- shausen, M.; Minte...
work page 2023
-
[4]
I.; Chen, L.; Yang, M.; Msigwa, G.; Farghali, M.; Fawzy, S.; Rooney, D
(5) Osman, A. I.; Chen, L.; Yang, M.; Msigwa, G.; Farghali, M.; Fawzy, S.; Rooney, D. W.; Yap, P.-S. Cost, environmental impact, and resilience of renewable energy under a changing climate: a review.Environmental Chemistry Letters2023,21, 741–764. (6) Boot-Handford, M. E.; Abanades, J. C.; Anthony, E. J.; Blunt, M. J.; Brandani, S.; Mac Dowell, N.; Fern´ ...
work page 2011
-
[6]
46 (14) Yang, Z.; Fahmi, A.; Drescher, M.; Teberikler, L.; Merat, C.; Solvang, S.; Rinde, O. J.; Norstrøm, J. G.; Dijkhuizen, W.; Haugset, T.; Brigadeaue, A.; Langsholtf, M.; Liu, L. Improved understanding of flow assurance for CO2 transport and injection.Proceedings of the 15th Greenhouse Gas Control Technologies Conference2021, 15–18. (15) Lund, H.; Fl ...
work page 2019
-
[8]
(20) Nazeri, M.; Haghighi, H.; Mckay, C.; Erickson, D.; Zhai, S. Impact of CO2 Specifications on Design and Operation Challenges of CO 2 Transport and Storage Systems in CCUS. Presented at the SPE Offshore Europe Conference and Exhibition2021, SPE–205472– MS. (21) Cresswell, A. J.; Wheatley, R. J.; Wilkinson, R. D.; Graham, R. S. Molecular simulation of t...
work page 2008
-
[11]
A single-site coarse grained model of carbon dioxide.Journal of Physical Chemistry B2011,115, 11154–11169. 52 (60) Potoff, J. J.; Siepmann, J. I. Vapor–liquid equilibria of mixtures containing alkanes, carbon dioxide, and nitrogen.AIChE Journal2001,47, 1676–1682. (61) Perez-Blanco, M. E.; Maginn, E. J. Molecular dynamics simulations of CO 2 at an ionic li...
work page 1995
-
[12]
(74) Garc ´ ıa-P´ erez, E.; Parra, J
United- atom description of n-alkanes.Journal of Physical Chemistry B1998,102, 2569–2577. (74) Garc ´ ıa-P´ erez, E.; Parra, J. B.; Ania, C. O.; Dubbeldam, D.; Vlugt, T. J. H.; Castillo, J. M.; Merkling, P. J.; Calero, S. Unraveling the argon adsorption processes in MFI-type zeolite.Journal of Physical Chemistry C2008,112, 9976–9979. (75) Panagiotopoulos,...
work page 2021
-
[44]
(35) Wilhelmsen, Ø.; Skaugen, G.; Jørstad, O.; Li, H. Evaluation of SPUNG* and other equations of state for use in carbon capture and storage modelling.Energy Procedia 2012,23, 236–245. (36) Rahbari, A.; Garcia-Navarro, J. C.; Ramdin, M.; Van Den Broeke, L. J.; Moultos, O. A.; Dubbeldam, D.; Vlugt, T. J. H. Effect of water content on thermodynamic propert...
work page 2012
-
[2012]
(4) Statistical Review of World Energy,Energy Institute. 2023;https://www.energyinst. org/__data/assets/pdf_file/0004/1055542/EI_Stat_Review_PDF_single_3.pdf, Accessed October 10,
work page 2023
Show all 12 references
-
[2013]
Transport of CO2: presentation of new thermophysical property measurements and phase diagrams.Energy Procedia2017,114, 6844–6859
(44) Coquelet, C.; Stringari, P.; Hajiw, M.; Gonzalez, A.; Pereira, L.; Nazeri, M.; Bur- gass, R.; Chapoy, A. Transport of CO2: presentation of new thermophysical property measurements and phase diagrams.Energy Procedia2017,114, 6844–6859. (45) Lagache, M.; Ungerer, P.; Boutin...
2001
-
[2021]
2023;https://www.porthosco2.nl/wp-content/ uploads/2021/09/CO2-specifications.pdf, Accessed March 22,
2023
-
[2023]
CO 2 Emissions in 2022, IEA
(2) Olivia, C.; Victor, G.; Arthur, R. CO 2 Emissions in 2022, IEA. 2023;https:// iea.blob.core.windows.net/assets/3c8fa115-35c4-4474-b237-1b00424c8844/ CO2Emissionsin2022.pdf, Accessed March 22,
2022
-
[2024]
(12) Li, H.; Jakobsen, J. P.; Wilhelmsen, Ø.; Yan, J.PVTxyproperties of CO 2 mixtures relevant for CO2 capture, transport and storage: Review of available experimental data and theoretical models.Applied Energy2011,88, 3567–3579. (13) Brownsort, P. A. 1 st Report of the Themat...
2017
Reviewed August 7, 2026 · model on record in the stance chip above.
Discussion (0). Sign in to comment.