REVIEW 5 major objections 5 minor 59 references
Predicting Human Depression with Hybrid Data Acquisition utilizing Physical Activity Sensing and Social Media Feeds
T0 review · 5 major / 5 minor · reviewed 2026-08-07 · deepseek-v4-flash
Pith's one-line read A hybrid pipeline fuses six smartphone accelerometer features with three Twitter sentiment features and sorts weekly GDS scores into three depression levels with 94% accuracy.
desk verdict Interesting hybrid-data idea, but the Twitter sentiment features are circularly constructed from keyword-filtered tweets and the headline accuracy doesn't match the paper's own numbers. read the letter →
The pith
A machine-rendered reading of the paper's core claim, the machinery that carries it, and where it could break.
The reading
What carries the argument
The load-bearing object is the aligned nine-feature vector built by the hybrid acquisition model: the SmartDataApp phone app collects accelerometer traces tagged by IMEI, the Twitter API harvest is tied to the same participant's twitter_id, and weekly GDS scores supply the label. Six features are activity durations produced by a depthwise-separable-convolution CNN, chosen because it cuts weights and computation relative to standard convolution; three are tweet-polarity counts produced by a Naive Bayes classifier using the tweet polarity score $TS_p = \sum_i w_i p_i$ with $w_i$ the tweet words and $p_i \in \{-1,0,+1\}$ their polarities. Wrapper feature selection over weekday, working-day, and weekend subgroups, a lasso-regularized linear regression for GDS prediction, and leave-one-participant-out cross-validation with subsampling carry the evaluation, and the SVM is the final classifier credited with the 94% figure.
What would settle it
Run the same nine-feature SVM pipeline on a sample whose depression severity is assigned by a structured clinical interview instead of GDS self-report: if accuracy on the severe class falls to near chance once class imbalance is controlled, or the reported correlations with sitting, jogging, and sentiment disappear, the 94% figure is an artifact of the questionnaire labels rather than a signal of depression.
Extended reading notes
Core claim
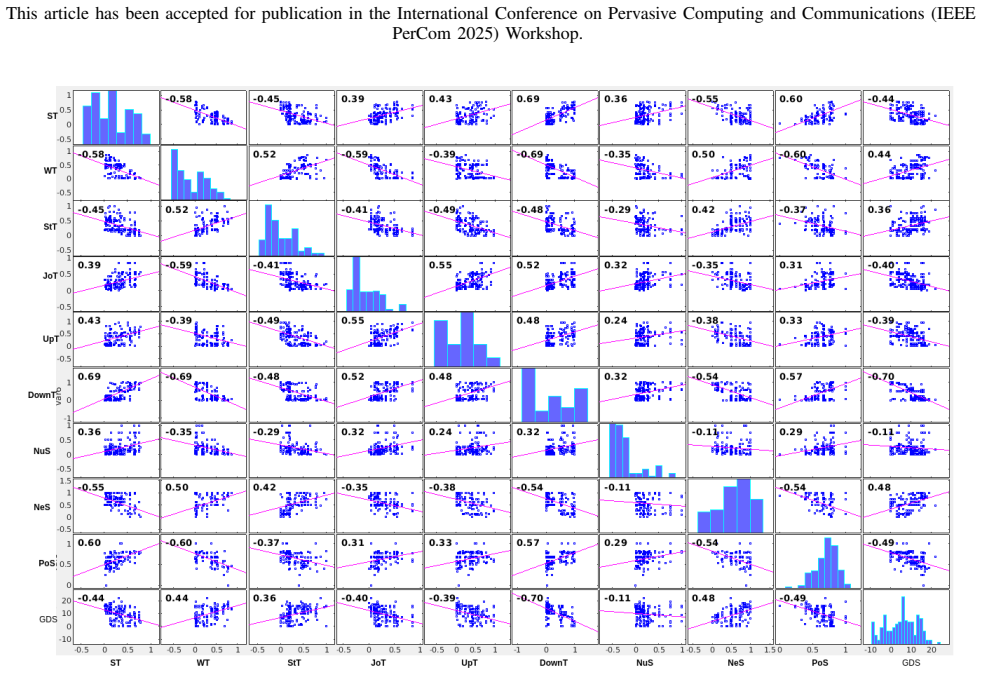
The central claim is that a support vector machine trained on nine weekly features—time spent sitting, walking, standing, jogging, going upstairs, and going downstairs, plus counts of negative, neutral, and positive tweets—classifies depression severity into three GDS-based levels (absent, mild/moderate, severe) with 94% accuracy and outperforms multilayer perceptron and k-nearest-neighbor alternatives. The activity features are produced by a depthwise-separable-convolution CNN that labels raw 20 Hz accelerometer windows, and the sentiment features by a Naive Bayes classifier on keyword-filtered tweets. The paper further reports that most of the nine features correlate significantly with GDS scores, that a lasso-regularized linear regression predicts the numeric GDS score with an RMSD of 3.356 after wrapper feature selection, and that evaluation is leave-one-participant-out cross-validation with subsampling of the over-represented class. In the authors' account, this makes a simple hybrid sensing pipeline a viable long-term, low-burden depression monitor.
Load-bearing premise
The results stand or fall on whether weekly Geriatric Depression Scale self-reports from 33 non-geriatric volunteers (mean age 24, none clinically diagnosed) are valid depression-severity labels; if they are not, the 94% accuracy says how well the features reproduce GDS answers, not how well they detect depression.
Editorial extensions
If this is right
- A phone's accelerometer alone can supply six behavior features that correlate with depression severity, so no wearable or clinic visit is needed for the sensing side.
- Combining social-media sentiment with physical activity yields the best classifier in this study: SVM beats both MLP and KNN on these nine features.
- Most of the nine features show significant correlations with GDS scores, so the signal is spread across both modalities rather than carried by one feature.
- The same app-plus-API collection design can be reused to synchronize multimodal data for other mental-health monitoring tasks.
Reading between the lines
- The strong correlations are between features and GDS self-reports, not clinical diagnosis, so the 94% should be read as reproducing questionnaire answers until clinical labels are tested.
- A longitudinal study with structured clinical interviews and class-imbalance control would be the direct test; the most decisive number is per-class accuracy on the severe group, which had only 3 of 33 participants at baseline.
- Because tweets were harvested with depression-related keywords, the sentiment features may capture self-disclosure about depression rather than mood itself; separating those would show whether Twitter adds information beyond the accelerometer.
- If the accuracy transfers, the same nine features could be packaged as an unobtrusive app that flags shifts in depression severity without any survey burden.
Editorial analysis
A structured set of objections, weighed in public.
Referee Report
Summary. The paper proposes a hybrid depression-monitoring pipeline that fuses smartphone accelerometer-derived physical activity features with Twitter sentiment features and weekly Geriatric Depression Scale (GDS) scores from 33 participants. The authors report a CNN-based activity recognition accuracy of about 95–98%, Naive Bayes sentiment classification accuracy of 95.6%, several statistically significant feature–GDS correlations, and an SVM-based three-level depression classifier claimed to reach 94% accuracy, outperforming MLP and KNN. The central claim is that a simple, passive hybrid sensing approach can monitor depression severity without clinical questionnaires. The manuscript also states, in the Discussion, that the sample was non-clinical and self-report based, which is relevant to assessing the validity of the results.
Significance. If the central claim were supported, the work would offer a low-cost, passive monitoring tool with clear practical value for longitudinal mental-health tracking. The data-acquisition protocol linking smartphone sensor data, social media data, and questionnaire scores on the same participants is a reasonable starting point, and the authors explicitly acknowledge the non-clinical, self-report nature of the sample. However, the claim is not supported by the evidence as presented: the Twitter sentiment features are circular with respect to the outcome, the severe-depression class contains only three participants, the reported accuracy figures are internally inconsistent, and the statistical analyses treat repeated weekly measures as independent. These are load-bearing issues that cannot be resolved by minor revision.
major comments (5)
- [Section II-C / IV-C] The Twitter sentiment features are constructed from tweets collected with stream.filter(track=['Depression','Anxiety','Sad','mental health']), and the polarity lexicon used in Eq. (5) explicitly codes words such as 'depressed' and 'suicide' as negative (Table III). The 'negative sentiment' feature therefore largely measures whether a participant tweets about depression-related topics, not a general emotional-expression trait. The reported correlation of this feature with GDS (p≈9.845e-78 in Section IV-C) and its use as an SVM input partially encode the outcome in the predictor, so the central claim of a passive hybrid signal is not supported. A necessary control is to repeat the analysis on unfiltered tweets or to remove the sentiment features and show that the physical-activity features alone retain predictive value.
- [Table VI / Abstract / Discussion] The headline 'very high accuracy of 94%' cannot be derived from the paper's own numbers. Table VI reports SVM accuracies of 93%, 85.6%, and 89.3% for the absence, mild/moderate, and severe classes, respectively, while Section V gives an overall accuracy of 89.2%. Neither the abstract nor the contributions specify how 94% is computed; if it is intended as the severe-class accuracy, it directly contradicts Table VI(C), which reports 89.3%. The authors should state the exact averaging or class-weighting formula used to obtain the headline figure.
- [Table I / Section III-E] Only 3 of the 33 participants fall in the severe depression class (Table I), yet the paper reports per-class SVM accuracy of 89.3% for severe depression and claims in the Introduction that SVM has the 'highest accuracy rate of 94% for severe depression.' The 'synthesized' oversampling mentioned in Section III-E is not specified (no method, parameters, or validation), and synthetic resampling cannot create independent evidence for severe-class performance. The severe-class result therefore has no statistical basis; the authors should report exact class counts per weekly observation and provide bootstrap or permutation confidence intervals.
- [Section II-B] The Geriatric Depression Scale is used on volunteers with mean age 24 years. The statement that GDS 'has been validated in previous research' refers to geriatric populations, and no validation for this age group is provided. Because GDS scores are the sole outcome labels, the reported correlations and classification accuracies may characterize responses to a questionnaire rather than depression. The Discussion's acknowledgment of the non-clinical sample is appropriate but does not repair the validity of the outcome measure for this population.
- [Section IV-C / III-E] The correlation analysis treats all weekly GDS assessments and feature windows as independent observations, but the data are repeated measures from 33 participants over many weeks. The extremely small p-values (e.g., 9.845e-78) are therefore not interpretable as evidence of association; a mixed-effects model or participant-level analysis is needed. Similarly, the LOOCV described in Section III-E appears to operate on weekly samples per participant, which does not prevent training/testing leakage across weeks from the same participant and may inflate accuracy estimates.
minor comments (5)
- [Section IV-B / Abstract] Section IV-B reports activity recognition accuracy of 'around 98%', while the Abstract and Introduction state 95%; these values should be reconciled.
- [Section IV-A / Table V] In Table V, the positive and neutral polarity rows do not sum to 100% across the two sentiment columns; the text should clarify whether neutral tweets are omitted and how the 'predictive depressive users' percentages in Figure 6 are derived.
- [Section IV-D] The text refers to 'Figure 13' when describing the results in Table VI, but the figure numbering in the manuscript appears to end at Figure 11; the citation should be corrected.
- [Eq. (5)] Equation (5) is typeset incompletely: the summation symbol and the weighting of word polarities should be written out explicitly so that the polarity score formula is unambiguous.
- [Introduction] The statement that the proposed method outperforms reference [49] by ~8% is not directly supported by the comparison, because [49] reports exploratory correlations rather than the same three-level classification task.
Circularity Check
The Twitter sentiment features are constructed from depression-keyword-filtered tweets, and the wrapper feature selection leaks GDS labels into the LOOCV evaluation, making part of the 94% claim circular.
-
self definitional
[Section II-C (Dataset II) and Section III-A / Table III (sentiment polarity)]
"The filter was designed to capture data by searching for keywords related to depression, anxiety, sadness, and mental health. Specifically, we used the following filter: stream.filter(track=['Depression', 'Anxiety', 'Sad', 'mental health'])."
The sentiment feature is not an independent measure of affect: the corpus consists only of tweets that matched a depression/anxiety/sadness keyword filter, and the polarity lexicon in Table III assigns negative polarity to words such as 'depressed' and 'suicide'. A participant who tweets about depression therefore receives a high negative-sentiment score by construction, regardless of their actual emotional expression. Consequently the reported strong correlation between negative sentiment and GDS severity (Section IV-C, p=9.845e-78) and the SVM's use of NeS/NuS/PoS partially encode the data-collection filter rather than an independent behavioral signal; predicting depression from these features is partly predicting depression from depression-related vocabulary.
-
fitted input called prediction
[Section III-C (Feature Selection) and Section III-E (Evaluation and Validation)]
"The chosen features were evaluated using regression and classification models. The evaluation process was carried out through tenfold cross-validation of the sample."
Feature selection is performed before and outside the LOOCV loop on the entire sample: Section III-C selects features with tenfold cross-validation using GDS-derived RMSD, and Section III-E then runs LOOCV on the same data. Each 'left-out' participant's GDS score and feature values therefore participated in choosing the feature subset, so the test fold is not independent. The reported 94% (and per-class accuracies) are thus an optimistic estimate of a model whose input features were fitted with access to the test labels, not a genuine out-of-sample prediction. This is a standard circular evaluation: the selected features are a fitted parameter, and the LOOCV accuracy is partly an artifact of fitting that parameter to the full dataset.
full rationale
Two concrete circular or leaky steps undermine the central claim. First, Section II-C filters the Twitter stream by depression-related keywords and the polarity model scores the same words as negative, so the 'negative sentiment' feature is a depression-topic proxy; correlating it with GDS and using it in the SVM encodes the outcome vocabulary by construction. Second, wrapper feature selection is run on the full sample before LOOCV, so each left-out participant's labels influenced the chosen feature subset and the reported accuracy is not independent out-of-sample performance. The physical-activity features and the CNN activity-recognition pipeline are independent and are not themselves circular; the GDS-in-a-young-population issue and the n=3 severe class are validity and power problems, not circularity. No load-bearing self-citation appears: reference [59] is only about future pruning work. The central hybrid claim therefore retains some independent content, but the Twitter-modality correlation and a material part of the accuracy estimate reduce by construction, warranting a partial-circularity score of 6.
Assumptions & free parameters
free parameters (5)
- CNN architecture hyperparameters =
first conv filter 60, depth 60; max-pool 20 stride 2; second conv filter 6; FC 1000; batch size 10; 12 epochs
- SVM hyperparameters =
not reported
- Lasso regularization strength =
not reported
- Naive Bayes smoothing gamma =
not reported (Laplace gamma=1 mentioned)
- Class-balance synthesis procedure =
unspecified
assumptions (5)
- domain assumption GDS scores are a valid measure of depression severity in a non-geriatric young adult sample.
- domain assumption Keyword-filtered tweets represent each participant's typical social media sentiment.
- ad hoc to paper A simple word-polarity sum with negation words excluded captures tweet sentiment.
- standard math Repeated weekly measurements from the same participants can be treated as independent for correlation tests.
- domain assumption The CNN can recognize six activity classes from 20 Hz accelerometer data at the reported accuracy.
Cite this review
Pith. "Pith review of Predicting Human Depression with Hybrid Data Acquisition utilizing Physical Activity Sensing and Social Media Feeds." pith.science (2026). https://pith.science/paper/73JXM6AE
@misc{pith2026250522779,
  author       = {Pith},
  title        = {Pith review of: Predicting Human Depression with Hybrid Data Acquisition utilizing Physical Activity Sensing and Social Media Feeds},
  year         = {2026},
  howpublished = {\url{https://pith.science/paper/73JXM6AE}},
  note         = {Machine review of arXiv:2505.22779}
}
read the original abstract
Mental disorders including depression, anxiety, and other neurological disorders pose a significant global challenge, particularly among individuals exhibiting social avoidance tendencies. This study proposes a hybrid approach by leveraging smartphone sensor data measuring daily physical activities and analyzing their social media (Twitter) interactions for evaluating an individual's depression level. Using CNN-based deep learning models and Naive Bayes classification, we identify human physical activities accurately and also classify the user sentiments. A total of 33 participants were recruited for data acquisition, and nine relevant features were extracted from the physical activities and analyzed with their weekly depression scores, evaluated using the Geriatric Depression Scale (GDS) questionnaire. Of the nine features, six are derived from physical activities, achieving an activity recognition accuracy of 95%, while three features stem from sentiment analysis of Twitter activities, yielding a sentiment analysis accuracy of 95.6%. Notably, several physical activity features exhibited significant correlations with the severity of depression symptoms. For classifying the depression severity, a support vector machine (SVM)-based algorithm is employed that demonstrated a very high accuracy of 94%, outperforming alternative models, e.g., the multilayer perceptron (MLP) and k-nearest neighbor. It is a simple approach yet highly effective in the long run for monitoring depression without breaching personal privacy.
Figures


Figures from the paper (6 more)




Reference graph
Works this paper leans on
-
[1]
World Health Organization, Mental Health Action Plan 2013-2020, http://apps.who.int/iris/bitstream/10665/89966/1/9789241506021 _eng.pdf? ua=1 [accessed 2018-04-25]
work page 2013
-
[2]
H.A. Whiteford, L. Degenhardt, J. Rehm, A.J. Baxter, A.J. Ferrari, H.E. Erskine, et al. Global burden of disease attributable to mental and substance use disorders: findings from the global burden of disease study 2010, Lancet;382(9904):1575-1586
work page 2010
-
[3]
A. Wongkoblap, M.A. Vadillo, V . Curcin. Researching mental health disorders in the era of social media: systematic review, J Med Internet Res;19(6): e228
-
[4]
World Health Organization. 2018. Depression: Key Facts URL: https://www.who.int/news-room/fact-sheets/detail/depression
work page 2018
-
[5]
World Health Organization, Depression: Let’s talk, SEARO. (2017). http://www.searo.who.int/bangladesh/enbanwhd2017/en/
work page 2017
-
[6]
R.C. Kessler, E.J. Bromet. The epidemiology of depression across cultures Annu. Rev. Public Health, 34 (2013), pp. 119-138
work page 2013
- [7]
-
[8]
I. Elkin, M.T. Shea, J.T. Watkins, S.D. Imber, S.M. Sotsky, J.F. Collins, D.R. Glass, P.A. Pilkonis, W.R. Leber, J.P. Docherty. National Institute of Mental Health treatment of depression collaborative research program: General effectiveness of treatments Arch. Gen. Psychiatry, 46 (1989), pp. 971-982
work page 1989
Show all 59 references
-
[9]
Mitchell, A
A.J. Mitchell, A. Vaze, S. Rao. Clinical diagnosis of depression in primary care: a meta-analysis, Lancet (2009), pp. 609-619
2009
-
[10]
Masud, Mohammed A
Mohammed T. Masud, Mohammed A. Mamun, K. Thapa, D.H. Lee, Mark D. Griffiths, S.-H. Yang. Unobtrusive monitoring of behavior and movement patterns to detect clinical depression severity level via smartphone. Journal of Biomedical Informatics, V olume 103, 2020
2020
-
[11]
Cepoiu, J
M. Cepoiu, J. McCusker, M.G. Cole, M. Sewitch, E. Belzile, A. Ciampi Recognition of depression by non-psychiatric physicians-a systematic literature review and meta-analysis, J. Gen. Intern. Med., 23 (2008), pp. 25-36
2008
-
[12]
Murthy, K.V .K
R.S. Murthy, K.V .K. Kumar, D. Chisholm, T. Thomas, K. Sekar, C.R. Chandrashekar Community outreach for untreated schizophrenia in rural India: a follow-up study of symptoms, disability, family burden and costs Psychol. Med., 35 (2005), pp. 341-351
2005
-
[13]
Kessler, P.A
R.C. Kessler, P.A. Berglund, M.L. Bruce, J.R. Koch, E.M. Laska, P.J. Leaf, R.W. Manderscheid, R.A. Rosenheck, E.E. Walters, P.S. Wang. The prevalence and correlates of untreated serious mental illness, Health Serv. Res., 36 (2001), pp. 987-1007
2001
-
[14]
https://www.statista.com/statistics/330695/number-of-smartphone-users- worldwide/
Statista, Number of smartphone mobile network subscriptions worldwide from 2016 to 2022, with forecasts from 2023 to 2028, (2023). https://www.statista.com/statistics/330695/number-of-smartphone-users- worldwide/. (accessed 2023)
2023
-
[15]
https://newzoo.com/insights/rankings/top-50-countries-by- smartphone-penetration-and-users/ (accessed 2019)
Newzoo, Top countries/markets by smartphone penetration & users, (2018). https://newzoo.com/insights/rankings/top-50-countries-by- smartphone-penetration-and-users/ (accessed 2019)
2018
-
[16]
Grünerbl, A
A. Grünerbl, A. Muaremi, V . Osmani, G. Bahle, S. Öhler, G. Tröster, O. Mayora, C. Haring, P. Lukowicz. Smartphone-based recognition of states and state changes in bipolar disorder patients, IEEE J. Biomed. Heal. Informatics., 19 (2015)
2015
-
[17]
Harari, N.D
G.M. Harari, N.D. Lane, R. Wang, B.S. Crosier, A.T. Campbell, S.D. Gosling. Using smartphones to collect behavioral data in psychological science: Opportunities, practical considerations, and challenges, Per- spect. Psychol. Sci., 11 (2016)
2016
-
[18]
Abdullah, T
S. Abdullah, T. Choudhury. Sensing technologies for monitoring serious mental illnesses, IEEE Multimedia, 25 (2018), pp. 61-75
2018
-
[19]
D.C. Mohr, M. Zhang, S.M. Schueller. Personal sensing: understanding mental health using ubiquitous sensors and machine learning, Annu. Rev. Clin. Psychol., 13 (2017), pp. 23-47
2017
-
[20]
Garcia-Ceja, V
E. Garcia-Ceja, V . Osmani, O. Mayora. Automatic stress detection in working environments from smartphones’ accelerometer data: a first step, IEEE J. Biomed. Heal. Informatics., 20 (2016), pp. 1053-1060
2016
-
[21]
R. Wang, A. Dasilva, J.F. Huckins, W.M. Kelley, T.F. Heatherton, A.T. Campbell, W. Wang, Todd, F. Heatherton. Tracking depression dynamics in college students using mobile phone and wearable sensing, Proc. ACM Interact. Mob. Wearable Ubiquitous Technol. 2, 1(2018) 1–26
2018
-
[22]
Craft, F.M
L.L. Craft, F.M. Perna. The benefits of exercise for the clinically depressed, Prim Care Companion J. Clin. Psychiatry., 6 (2004), pp. 104- 111
2004
-
[23]
V . Osmani. Smartphones in mental health: detecting depressive and manic episodes, IEEE Pervasive Comput., 14 (2015), pp. 10-13
2015
-
[24]
S. Saeb, M. Zhang, C.J. Karr, S.M. Schueller, M.E. Corden, K.P. Kording, D.C. Mohr. Mobile phone sensor correlates of depressive symptom severity in daily-life behavior: an exploratory study, J. Med. Internet Res., 17 (2015), p. e175
2015
-
[25]
George, D.G
L.K. George, D.G. Blazer, D.C. Hughes, N. Fowler. Social support and the outcome of major depression, Br. J. Psychiatry, 154 (1989), pp. 478- 485
1989
-
[26]
J.Y . Kim, N. Liu, H.X. Tan, C.H. Chu. Unobtrusive monitoring to detect depression for elderly with chronic illnesses, IEEE Sens. J., 17 (2017), pp. 5694-5704
2017
-
[27]
Andrews, A.J
J.A. Andrews, A.J. Astell, L.J.E. Brown, R.F. Harrison, M.S. Hawley. Technology for early detection of depression and anxiety in older people, Stud. Health Technol. Inform., 242 (2017), pp. 374-380
2017
-
[28]
Nguyen, B
T. Nguyen, B. O’Dea, M. Larsen, D. Phung, S. Venkatesh, H. Chris- tensen. Using linguistic and topic analysis to classify sub-groups of online depression communities, Multimed Tools Appl 2015
2015
-
[29]
Cavazos-Rehg, M.J
P.A. Cavazos-Rehg, M.J. Krauss, S. Sowles, S. Connolly, C. Rosas, M. Bharadwaj, L.J. Bierut. A content analysis of depression-related Tweets. Comput Human Behav. 2016;54:351-357,PMCID: PMC4574287
2016
-
[30]
Glen Coppersmith, Mark Dredze, Craig Harman, and Kristy Holling- shead. 2015. From ADHD to SAD: Analyzing the Language of Mental Health on Twitter through Self-Reported Diagnoses. In Proceedings of the 2nd Workshop on Computational Linguistics and Clinical Psychol- ogy: From L...
2015
-
[31]
Glen Coppersmith, Mark Dredze, and Craig Harman. 2014. Quantifying Mental Health Signals in Twitter. In Proceedings of the Workshop on Computational Linguistics and Clinical Psychology: From Linguistic Signal to Clinical Reality, pages 51–60, Baltimore, Maryland, USA. Associat...
2014
-
[32]
Radzikowski, A
J. Radzikowski, A. Stefanidis, K.H. Jacobsen, A. Croitoru, A. Crooks, P.L. Delamater. The measles vaccination narrative in Twitter: a quanti- tative analysis, JMIR Public Health Surveill 2016;2(1):e1
2016
-
[33]
Stefanidis, E
A. Stefanidis, E. Vraga, G. Lamprianidis, J. Radzikowski, P.L. Dela- mater, K.H. Jacobsen, D. Pfoser, A. Croitoru, A. Crooks. Zika in Twitter: Temporal Variations of Locations, Actors, and Concepts, JMIR Public Health Surveill. 2017 Apr 20
2017
-
[34]
Finch, K.R
K.C. Finch, K.R. Snook, C.H. Duke, K. Fu, Z.T. Tse, A. Adhikari, et al. Public health implications of social media use during natural disasters, environmental disasters, and other environmental concerns. Nat Hazards 2016 Apr 19;83(1):729-760
2016
-
[35]
Eysenbach
G. Eysenbach. Infodemiology and infoveillance: framework for an emerging set of public health informatics methods to analyze search, communication and publication behavior on the internet. J Med Internet Res 2009 Mar 27;11(1):e11
2009
-
[36]
M.J. Paul, M. Dredze. You Are What You Tweet: Analyzing Twitter for Public Health, In: Proceedings of the Fifth International AAAI Conference on Weblogs and Social Media. 2011 Presented at: AAAI’11; July 17-21, 2011; Barcelona, Spain p. 265-272. © 2025 IEEE. Personal use of th...
2011
-
[37]
M. Park, C. Cha, M. Cha. Depressive Moods of Users Portrayed in Twitter, In: Proceedings of the ACM SIGKDD Workshop on Health Informatics. 2012
2012
-
[38]
Conway, D
M. Conway, D. O’Connor. Social media, big data, and mental health: current advances and ethical implications. Curr Opin Psychol 2016;9:77- 82
2016
-
[39]
Jain, B.W
S.H. Jain, B.W. Powers, J.B. Hawkins, J.S. Brownstein. The digital phenotype. Nat Biotechnol 2015;33(5):462-463
2015
-
[40]
Statista. 2018. Number of Monthly Active Twitter Users Worldwide From 1st Quarter 2010 to 2nd Quarter 2018 (in Millions). Y .R. Tausczik, J.W. Pennebaker. The psychological meaning of words: LIWC and computerized text analysis methods, J Lang Soc Psychol 2009;29(1):24- 54
2018
-
[41]
Tausczik, J.W
Y .R. Tausczik, J.W. Pennebaker. The psychological meaning of words: LIWC and computerized text analysis methods, J Lang Soc Psychol 2009;29(1):24-54
2009
-
[42]
mirez-Esparza, C.K
N. mirez-Esparza, C.K. Chung, E. Kacewicz, J.W. Pennebaker. The Psychology of Word Use in Depression Forums in Englishin Spanish: Texting Two Text Analytic Approaches, In: Proceedings of the 2nd International Conference on Weblogs and Social Media. 2008
2008
-
[43]
Prieto, S
V .M. Prieto, S. Matos, M. Álvarez, F. Cacheda, J.L. Oliveira. Twitter: a good place to detect health conditions, PLoS One 2014;9(1):e86191
2014
-
[44]
Thackeray, S.H
R. Thackeray, S.H. Burton, C. Giraud-Carrier, S. Rollins, C.R. Draper. Using Twitter for breast cancer prevention: an analysis of breast cancer awareness month, BMC Cancer 2013;13:508
2013
-
[45]
Sherry A. Greenberg, The Geriatric Depression Scale (GDS), Hart- ford Institute for Geriatric Nursing, NYU College of Nursing, https://wwwoundcare.ca/Uploads/ContentDocuments/Geriatric%20 De- pression%20Scale.pdf
-
[46]
Usefulness of the Geriatric Depres- sion Scale 15-item version among very old people with and without cognitive impairment, Aging Ment Health
Mia Conradsson, Erik Rosendahl, Håkan Littbrand, Yngve Gustafson, Birgitta Olofsson, Hugo Lövheima. Usefulness of the Geriatric Depres- sion Scale 15-item version among very old people with and without cognitive impairment, Aging Ment Health. July, 2013
2013
-
[47]
Python-Twitter API, Getting your application tokens, https://python- twitter.readthedocs.io/en/latest/getting_started.html
-
[48]
Karantonis, M.R
D.M. Karantonis, M.R. Narayanan, M. Mathie, N.H. Lovell, B.G. Celler Implementation of a real-time human movement classifier using a triaxial accelerometer for ambulatory monitoring, IEEE Trans. Inf. Technol. Biomed., 10 (2006)
2006
-
[49]
S. Saeb, M. Zhang, C.J. Karr, S.M. Schueller, M.E. Corden, K.P. Kord- ing, D.C.Mohr. Mobile phone sensor correlates of depressive symptom severity in daily-life behavior: an exploratory study, J. Med. Internet Res., 17 (2015), p. e175, 10.2196/jmir.4273
2015 doi
-
[50]
Naive Bayes machine learning algorithm, scikit-learn ,https://scikit- learn.org/stable/modules/naive_bayes.html
-
[51]
Yang, M.H
S.-H. Yang, M.H. Kabir, M.R. Hoque. Mathematical modeling of smart space for context-aware system: linear algebraic representation of state- space method based approach, Math. Probl. Eng., 2016
2016
-
[52]
Tibshirani
R. Tibshirani. Regression shrinkage and selection via the lasso:a retro- spective, J. R. Stat. Soc. Ser. B., 73 (1996)
1996
-
[53]
I. H. Witten, E. Frank, ed. Data Mining: Practical Machine Learning Tools and Techniques, Fourth ed., Los Altos: Morgan Kaufmann, San Francisco, 2017
2017
-
[54]
D.W. Aha, D. Kibler, M.K. Albert. Instance-based learning algorithms, Mach. Learn., 6 (1991), pp. 37-66
1991
-
[55]
Prezioso, M.B
Bayat, F.M. Prezioso, M.B. Chakrabarti, et al. Implementation of multilayer perceptron network with highly uniform passive memristive crossbar circuits, Nat Commun 9, 2331 (2018)
2018
-
[56]
Kohavi, G.H
R. Kohavi, G.H. John. Wrappers for feature subset selection, Artif. Intell., 97 (1997), pp. 273-324
1997
-
[57]
Tekin Erguzel, C
T. Tekin Erguzel, C. Tas, M. Cebi. A wrapper-based approach for feature selection and classification of major depressive disorder-bipolar disorders Comput., Biol. Med. 64 (2015)
2015
-
[58]
Stone, K.L
L.E. Stone, K.L. Granier, D.L. Segal. (2019). Geriatric Depression Scale, In: Gu D., Dupre M. (eds) Encyclopedia of Gerontology and Population Aging. Springer, Cham
2019
-
[59]
Neural network pruning: An effective way to reduce the initial network for deep learning based human activity recognition,
M. H. Uddin, J. M. K. Ara, M. H. Rahman and S. H. Yang, "Neural network pruning: An effective way to reduce the initial network for deep learning based human activity recognition," 2021 International Con- ference on Electronics, Communications and Information Technology (ICECI...
2021
Reviewed August 7, 2026 · model on record in the stance chip above.
Discussion (0). Sign in to comment.