REVIEW 3 major objections 5 minor 15 references
Sodium and Potassium Linewidths as an Atmospheric Escape Diagnostic at Mercury
T0 review · 3 major / 5 minor · reviewed 2026-08-07 · deepseek-v4-flash
Pith's one-line read The paper shows Mercury's tail linewidths, ~1200 K on the dayside, widening to ~7500 K downtail because gravity filters out slow atoms, with the 3.5-radii plateau marking the bound-to-escaping transition—a new escape diagnostic.
desk verdict Fresh observations of Mercury's K tail and Na/K linewidth trends, but the ballistic-apex interpretation needs Monte Carlo backing before it can stand. read the letter →
The pith
A machine-rendered reading of the paper's core claim, the machinery that carries it, and where it could break.
The reading
What carries the argument
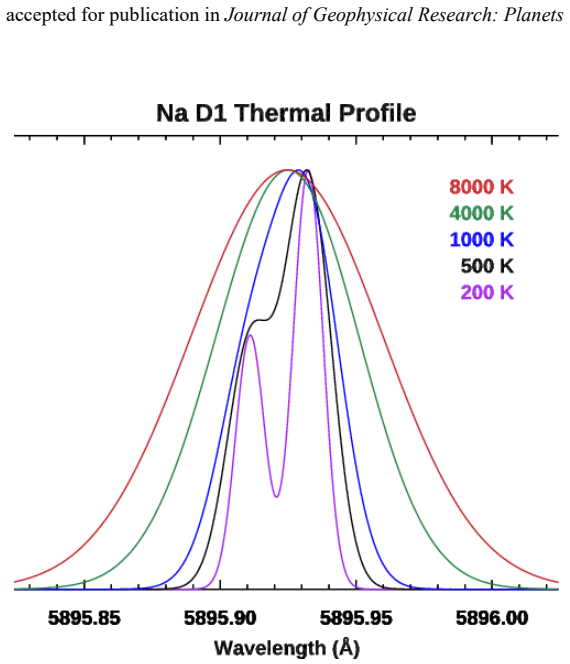
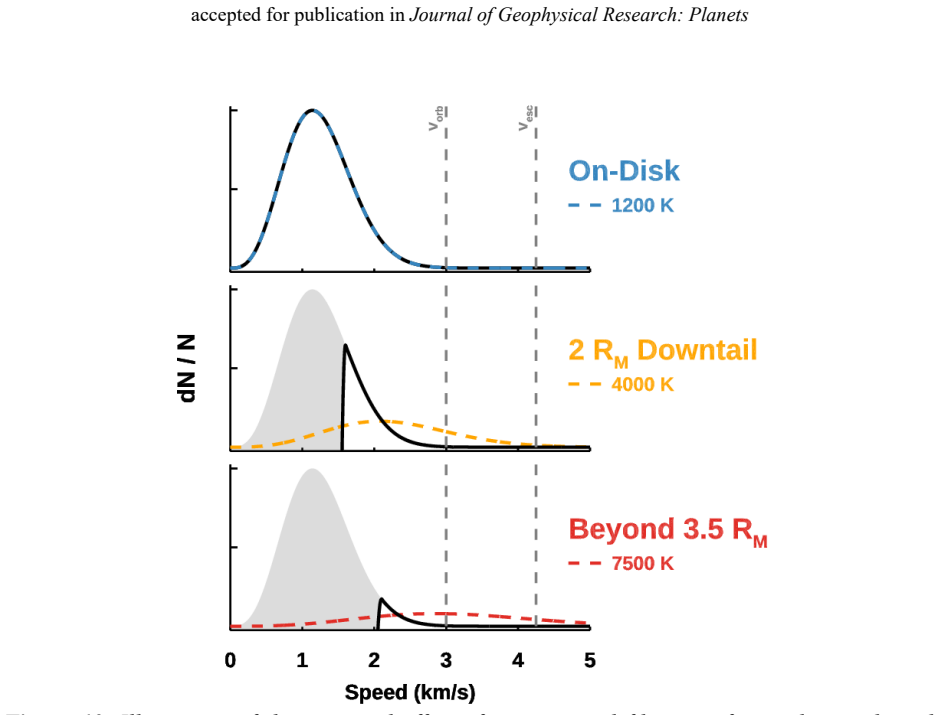
The load-bearing object is the Doppler-broadened D-line profile, reconstructed by summing hyperfine components (four for sodium D1, six for D2, two for each potassium line) and convolving with the instrumental line-spread function, then fitting the measured profile with the Gaussian Doppler width $\Delta\lambda_D = \sqrt{8kT\ln 2/m}\,\lambda_0/c$ to retrieve an effective temperature. The mechanism carrying the interpretation is gravitational filtering: the velocity distribution seen at any altitude is the nascent surface population—a loosely Maxwellian ~1200 K sodium flux whose energy is consistent with laboratory photon-stimulated desorption measurements—minus the atoms too slow to reach that altitude, which fall back and are largely adsorbed on the surface. Moving the spectrometer from the disk toward the tail raises the energy threshold of this filter, so the surviving gas looks hotter, becomes non-Maxwellian with a depleted line core, and ends as a nearly monoenergetic escaping population that produces a boxcar profile. The flattening of the retrieved temperature with distance marks where the bound population is exhausted, and radiation acceleration, rather than causing the broadening, sets where that filter completes and how the plateau temperature varies with season.
What would settle it
Run the planned Monte Carlo model of Mercury's sodium exosphere with photon-stimulated desorption as the only source and real radiation pressure, and compare synthesized line profiles at 1 to 5 Mercury radii downtail with the observed 2023 (true anomaly 56 degrees) profiles: the gravitational-filtering claim requires the modeled width to plateau near 3.5 radii at roughly 7500 K and to reproduce the boxcar shape, while a model that yields no plateau, or a plateau at a different distance, would undercut the ballistic-apex inference, as would an observation of line widths still climbing beyond 3.5 radii during a season of weak radiation pressure.
Extended reading notes
Core claim
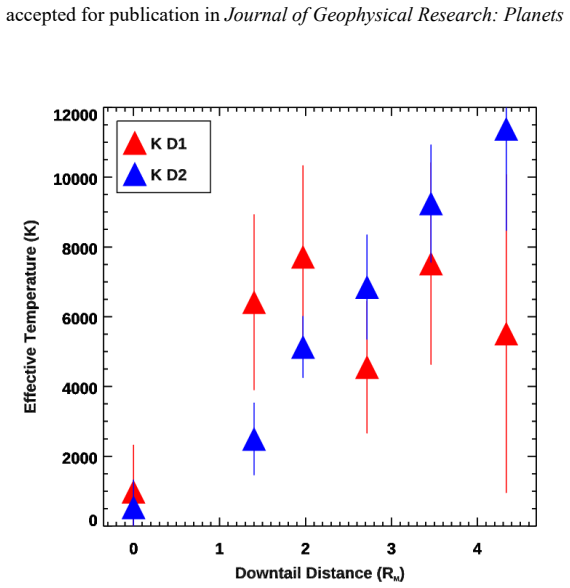
Seen from the paper's own position, the central discovery is that Mercury's alkali emission lines carry a record of gravitational escape written in their shape. On the dayside, sodium effective temperatures of 1228 ± 48 K and potassium temperatures of 758 ± 585 K match the cold, photon-stimulated-desorption source population; pointed antisunward, the same lines broaden continuously, sodium to an average 7464 K and potassium to 8451 K by 4.3 $R_M$, while the sodium line core flattens and the profile becomes boxcar-shaped. No heating is required: at each altitude the observed gas is the source distribution with the low-energy atoms removed, because those atoms lack the energy to climb that high and have re-impacted the surface, where most adsorb. The sodium effective temperature becoming invariant between 3.5 and 4.3 $R_M$ means the filter is complete there, so essentially all sodium beyond 3.5 $R_M$ is escaping, placing the ballistic apex of bound trajectories at less than 3.5 $R_M$ in this season. The paper concludes that emission-line morphology—width plus shape across the bound-to-escaping transition—is a new observational probe of atmospheric escape that has not been reported for any exosphere before, and it flags detailed Monte Carlo modeling as the planned test of the quantitative picture.
Load-bearing premise
The interpretation stands or falls on the premise that the broadened emission lines measured in Mercury's tail come from gravity straining out slow atoms from an initially cold (~1200 K) sodium population, with essentially no help from light absorption in the gas, sources spread through altitude, or radiation pressure reshaping atomic speeds in ways the paper's simple picture leaves out.
Editorial extensions
If this is right
- The leveling off of sodium effective temperature at about 3.5 Mercury radii provides a direct observational measure of the ballistic apex of bound exospheric trajectories, giving escape models a linewidth-based quantity to match rather than only scale heights.
- A measured Na/K ratio of about 95 in the tail, nearly the same as on the disk, means potassium's stronger radiation acceleration and its lower launch energy roughly cancel, and that cancellation constrains the relative supply and loss rates of the two species.
- The Gaussian-to-boxcar evolution of the line shape gives a spectral signature of the bound-to-escaping transition that can be searched for in other surface-bounded exospheres without needing to resolve individual altitudes.
- The seasonal change in plateau temperature (about 7500 K at true anomaly 56 degrees versus 5000 K at 80 degrees) ties the diagnostic to radiation pressure strength, so repeated observations across Mercury's year could map how escape vigor varies with season.
Reading between the lines
- If gravitational filtering is the mechanism, the linewidth-versus-distance curve is essentially the survival function of the surface velocity distribution, and fitting its full shape rather than just the effective temperature could expose the hot secondary sodium component estimated at 5000-20000 K that has so far evaded Doppler measurements.
- The same line-morphology diagnostic should transfer to other alkali-bearing exospheres, such as the Moon or transiting exoplanets with resolved sodium lines, where the altitude of the Gaussian-to-boxcar transition would directly encode the escape energy of that gravity well.
- The paper's finding that high-altitude Doppler temperatures above the poles (1451 ± 71 K) fall well below scale-height temperatures implies the two classic thermometers weight different parts of the velocity distribution, and quantifying that difference could serve as a general cross-calibration of remote exosphere temperature measurements.
- The redward line skew beyond 3 Mercury radii, tied to the dawnside cold-pole source, hints that line centroid shifts, once corrected for the ~0.6 km/s solar gravitational redshift, could map which surface longitudes feed the escaping gas.
Editorial analysis
A structured set of objections, weighed in public.
Referee Report
Summary. The paper reports ground-based spectroscopic observations of Mercury's sodium and potassium exosphere, combining long-slit imaging (DeVeny) and high-resolution point spectroscopy (EXPRES and KPF). Effective temperatures are retrieved from Doppler-broadened D-line profiles via forward modeling that includes hyperfine structure and instrument line spread functions. The authors find dayside Na temperatures of ~1200-1300 K, consistent with MESSENGER scale-height analyses, and a disk K temperature of ~758 K. Down the exotail, Na effective temperatures increase to ~7500 K and K to ~8500 K by 4.3 Mercury radii, Na line profiles evolve from Gaussian to boxcar shapes, and the Na linewidths appear to level off beyond ~3.5 RM. The paper interprets these trends as gravitational filtering of the nascent velocity distribution, with the 3.5 RM plateau marking the ballistic apex of bound trajectories, and proposes emission line morphology as a new diagnostic for atmospheric escape.
Significance. The first detection of Mercury's potassium tail is a notable observational result, and the high-quality KPF sodium line profiles provide the most detailed disk maps of alkali effective temperatures to date. The good agreement between the retrieved Na dayside temperature and independent MESSENGER scale-height values gives credibility to the line-profile retrieval method. The paper also makes its data and analysis codes publicly available, and the forward model carefully treats hyperfine structure and instrumental broadening. If the gravitational-filtering interpretation is quantitatively confirmed, the linewidth-plateau diagnostic would be a genuinely novel probe of the bound-to-escaping transition in exospheres. However, the central interpretation currently rests on a qualitative illustration rather than on a model that includes radiation pressure, and the paper's own 'future work' statement identifies the missing coupled modeling; this gap directly affects the headline 3.5 RM ballistic-apex claim.
major comments (3)
- [7.2, Figure 11, Conclusion item 8] The inference that the 3.5 RM linewidth plateau marks the ballistic apex of bound sodium trajectories is not quantitatively supported. The paper argues against recoil heating by noting that Na atoms would not Doppler-shift into the solar continuum until >80 RM, but that argument addresses net acceleration, not the modification of the velocity distribution by the radiation-pressure force. The paper itself states that 'the velocity distribution will also evolve in time from radiation acceleration' and defers coupled modeling to future work. A simple estimate within the paper's own framework exposes the issue: for a 1200 K Maxwellian sodium source, the fraction of atoms with speeds high enough to reach 3.5 RM against Mercury's gravity is orders of magnitude smaller than what is needed to populate the observed tail, implying that radiation pressure must supply most of the escape energy and will reshape the line-of-sight velocity distribution downtail. Without a quantitative model—or at least a scaling argument—that treats gravity and radiation pressure together, the specific claim that the plateau at 3.5 RM is the end of bound ballistic apices (Abstract and Conclusion item 8) is not established; the plateau could equally mark where radiation pressure has imparted its terminal impulse to the escaping flow.
- [3, Table/Na-K ratio] The Na/K ratio of 95 in the tail is quoted without any uncertainty, despite the text noting that telluric O2 absorption 'severely limits results at low spectral resolution and strong artefacts remain' and that absolute flux calibration uncertainty 'cannot be quantified.' The subsequent discussion of the balance between gravitational binding and radiation acceleration for Na versus K, and the comparison with the disk ratio of 70-130, depends on this number. The authors should provide at least a plausible range or a propagation of the stated systematic uncertainties to support the claimed consistency and the 'out of coincidence' interpretation.
- [6, Conclusion item 5] The potassium disk effective temperature is reported as 758 ± 585 K, which is essentially unconstrained (the 1σ range spans from near zero to >1300 K), and the far-tail potassium line profiles are described as having 'insufficient signal to noise' for conclusions on line-shape thermality. Yet the abstract and conclusions quote a potassium increase from 758 K to 8451 K as a headline result. The authors should either provide a more robust determination of the disk K baseline (e.g., from multiple independent observations or a joint fit) or explicitly label the potassium increase as tentative, given that the baseline and the far-tail profiles are at the limits of the data quality.
minor comments (5)
- [7.1] The text states that the observed Na/K thermal velocity ratio of 1.66 is 'nearly the 1.30 ratio of their inverse root of atomic mass,' but 1.66 is not close to 1.30; please clarify whether the comparison is to the equal-energy expectation (sqrt(39/23) ≈ 1.30) or to the laboratory value of 1.54, and adjust the wording accordingly.
- [4, Eq. (2)] The remark that Brown & Yung (1976) omitted a factor of 2^2 inside the exponential is confusing as printed, because Eq. (2) already shows the factor 2 in the argument (2(λ−λ0)/ΔλD)^2. Please verify the typographical presentation of the equation and the legacy formula to make the comparison unambiguous.
- [2] The gravitational redshift offset of 0.633 km/s is described as shifting solar Fraunhofer lines relative to the exosphere; please specify the reference frame and clarify whether this shift also enters the telluric calibration or the subtraction of the reflected solar spectrum, since the same solar reference spectrum is used for both on-disk and tail observations.
- [6, Figure 9] The redward skew of the sodium profiles beyond 3 RM is interpreted as evidence of a dawn-to-dusk flow, but no quantitative measure (e.g., line centroid shift, bisector, or skewness with uncertainty) is provided. Adding such a statistic would strengthen this ancillary interpretation and allow comparison with future models.
- [3] The sentence 'This is consistent with the 70–130 ratio on Mercury's disk, but only out of coincidence' is unclear; please identify the source of the disk ratio range and briefly state why the agreement is coincidental rather than physically expected, so that readers can follow the logic.
Circularity Check
No circularity found: effective temperatures are fitted observables, and the gravitational-filtering interpretation is a causal inference that does not reduce to the fitted values.
full rationale
The paper's central measurements are Doppler-broadened effective temperatures obtained by forward-modeling line profiles (Section 4). These are fitted observables, not predicted outputs of the gravitational-filtering model; the same fitted values are not used to derive themselves. The interpretation (Section 7.2, Figure 13) takes the observed ~1200 K near-surface temperature as an input and qualitatively explains the downtail broadening by loss of low-energy atoms, but it does not fit the mechanism to the tail linewidths or claim a prediction that is identical to an input. The 3.5 RM plateau is an observational feature used to infer a ballistic apex; this is an interpretive step, not a definitional reduction. The one self-citation used quantitatively—Schmidt et al. (2010) for the >80 RM Doppler-shift criterion that rules out recoil heating—is an external model result, not a parameter fitted to the present data, and the main filtering argument is independently supported by the observed Gaussian-to-boxcar line-shape evolution. The paper explicitly acknowledges (Section 7.2; Future Work) that radiation-pressure evolution of the velocity distribution is left to future Monte Carlo modeling; that is a stated modeling limitation, not circular reasoning. The measurements are also checked against independent MESSENGER scale-height temperatures. No equation reproduces itself by construction, and no fitted parameter is renamed as a prediction.
Assumptions & free parameters
free parameters (2)
- Effective temperature T per line profile =
Varied per pointing; e.g., Na on-disk 1228 ± 48 K, Na at 4.3 RM about 7464 K, K on-disk 758 ± 585 K
- Gaussian instrumental line-spread-function width =
Not quoted; taken as the minimum width of Th-Ar hollow-cathode lines within 3 Å of each target line
assumptions (4)
- domain assumption Doppler broadening of emission lines can be represented as a hyperfine-resolved, Gaussian-convolved thermal profile to yield an effective temperature.
- domain assumption The exosphere is collisionless, so the energy distribution is not necessarily Maxwellian but effective temperature remains a meaningful metric.
- domain assumption Line-of-sight opacity is low enough that retrieved temperatures are not significantly biased, despite D2/D1 ratios below the expected 1.6 in some on-disk regions.
- ad hoc to paper The tail gas evolves from a roughly Maxwellian about 1200 K sodium surface source under gravitational filtering and radiation acceleration, with no significant heating contribution.
Cite this review
Pith. "Pith review of Sodium and Potassium Linewidths as an Atmospheric Escape Diagnostic at Mercury." pith.science (2026). https://pith.science/paper/Q4EVUIPL
@misc{pith2026250523915,
  author       = {Pith},
  title        = {Pith review of: Sodium and Potassium Linewidths as an Atmospheric Escape Diagnostic at Mercury},
  year         = {2026},
  howpublished = {\url{https://pith.science/paper/Q4EVUIPL}},
  note         = {Machine review of arXiv:2505.23915}
}
read the original abstract
The spatial distribution and linewidth of Mercury's sodium and potassium exosphere were observed using a combination of long-slit and high-resolution point spectroscopy. Effective temperatures were estimated from emission line profiles by forward modeling their Doppler broadening. These serve as an energy metric for collisionless gas that is inherently nonthermal. The Na gas at low and mid-latitudes ranges from 1200-1300 K along the noon meridian, in agreement with MESSENGER scale heights, increasing by ~200 K at the poles and terminator. This increase is attributed to the loss of low energy atoms to the surface during photon-driven transport antisunward. An escaping potassium tail was measured for the first time, observed to a distance of 10.4 RM with Na/K ~95 at 5.8 RM. Emission linewidths increase sharply between the dayside and escaping tail, with Na growing from about 1200 to 7500 K, and K from 750 to 8500 K by the time the gas reaches 4.3 RM downtail. Na D line profiles down the exotail also evolve from Gaussian to boxcar in shape. Both characteristics are interpreted as filtering of the nascent velocity distribution function, wherein low energy atoms on gravitationally bound trajectories are removed from the gas population, while high energy escaping atoms are retained. Na linewidths become invariant past 3.5 RM, placing this altitude as the ballistic apex of bound trajectories. In this way, Mercury's emissions prototype a novel technique towards a broader understanding of atmospheric escape, using emission line morphology to probe the transition between bound and escaping gas.
Figures


Figures from the paper (9 more)


Reference graph
Works this paper leans on
-
[1]
Bida, T. A., Killen2, R. M., & Morgan3, T. H. (2000). Discovery of calcium in Mercury’s atmosphere. NATURE (Vol. 404). Retrieved from www.nature.com Brown, R. A., & Yung, Y. L. (1976). Io, Its Atmosphere and OPTICAL EMISSIONS. Tucson: University of Arizona Press. Burger, M. H., Killen, R. M., Vervack, R. J., Bradley, E. T., McClintock, W. E., Sarantos, M....
work page 2000
-
[6]
https://doi.org/10.1016/J.PSS.2008.07.008
-
[36]
https://doi.org/10.1016/J.ICARUS.2010.10.019 Orsini, S., Mangano, V., Milillo, A., Plainaki, C., Mura, A., Raines, J. M., et al. (2018). Mercury sodium exospheric emission as a proxy for solar perturbations transit. NatSR, 8(1),
-
[87]
https://doi.org/10.3847/PSJ/AC5C4D Lierle, P., Schmidt, C., Baumgardner, J., Moore, L., & Lovett, E. (2023). Rapid Imaging Planetary Spectrograph. Publications of the Astronomical Society of the Pacific, 135(1051). https://doi.org/10.1088/1538-3873/acec9f Madey, T. E., Yakshinskiy, B. V., Ageev, V. N., & Johnson, R. E. (1998). Desorption of alkali atoms a...
-
[115]
https://doi.org/10.1016/j.pss.2015.04.001 Massetti, S., Mangano, V., Milillo, A., Mura, A., Orsini, S., & Plainaki, C. (2017). Short-term observations of double-peaked Na emission from Mercury’s exosphere. GeoRL, 44(7), 2970–2977. https://doi.org/10.1002/2017GL073090 McClintock, W. E., & Lankton, M. R. (2007). The mercury atmospheric and surface compositi...
-
[139]
https://doi.org/10.3847/PSJ/AC67DE Leblanc, F., Doressoundiram, A., Schneider, N., Massetti, S., Wedlund, M., Ariste, A. L., et al. (2009). Short-term variations of Mercury’s Na exosphere observed with very high spectral resolution. GeoRL, 36(7), L07201. https://doi.org/10.1029/2009GL038089 Leblanc, F., Schmidt, C., Mangano, V., Mura, A., Cremonese, G., R...
-
[175]
https://doi.org/10.3847/PSJ/AC1A19 Cassidy, Timothy A., Merkel, A. W., Burger, M. H., Sarantos, M., Killen, R. M., McClintock, W. E., & Vervack, R. J. (2015). Mercury’s seasonal sodium exosphere: MESSENGER orbital observations. Icarus,
-
[187]
https://doi.org/10.3847/1538- 3881/AB0D86 Lierle, P. (2025). Mercury Exosphere Linewidths Data 2017-2023 and Codes [Data set]. Zenodo. https://doi.org/10.5281/ZENODO.14728010 accepted for publication in Journal of Geophysical Research: Planets Lierle, P., Schmidt, C., Baumgardner, J., Moore, L., Bida, T., & Swindle, R. (2022). The Spatial Distribution and...
doi:10.3847/1538- 2025
Show all 15 references
-
[228]
E., Killen, R
https://doi.org/10.1016/j.icarus.2013.09.007 Potter, A. E., Killen, R. M., & Morgan, T. H. (2007). Solar radiation acceleration effects on Mercury sodium emission. Icarus, 186(2), 571–580. https://doi.org/10.1016/j.icarus.2006.09.025 Potter, A. E., Killen, R. M., Potter, A. E....
2007
-
[248]
E., Killen, R
https://doi.org/10.1016/j.icarus.2014.10.037 Cassidy, Timothy A., McClintock, W. E., Killen, R. M., Sarantos, M., Merkel, A. W., Vervack, R. J., & Burger, M. H. (2016). A cold-pole enhancement in Mercury’s sodium exosphere. Geophysical Research Letters, 43(21). https://doi.org...
2016 doi
-
[355]
https://doi.org/10.1016/j.icarus.2020.114179 Morton, D. C. (2003). Atomic Data for Resonance Absorption Lines. III. Wavelengths Longward of the Lyman Limit for the Elements Hydrogen to Gallium. ApJS, 149(1), 205–238. https://doi.org/10.1086/377639 Mouawad, N., Burger, M. H., K...
2003
-
[472]
Retrieved from https://ui.adsabs.harvard.edu/abs/1996ias..book.....E/abstract Falke, S., Tiemann, E., Lisdat, C., Schnatz, H., & Grosche, G. (2006). Transition frequencies of the D lines of K39, K40, and K41 measured with a femtosecond laser frequency comb. Physical Review A -...
2006 doi
-
[672]
https://doi.org/10.1126/SCIENCE.1188572 Yakshinskiy, Boris V., & Madey, T. E. (2005). Temperature-dependent DIET of alkalis from SiO2 films: Comparison with a lunar sample. In Surface Science (Vol. 593, pp. 202–209). https://doi.org/10.1016/j.susc.2005.06.062 Yakshinskiy, B. V...
2005 doi
-
[839]
https://doi.org/10.1086/175407 Suzuki, Y., Yoshioka, K., Murakami, G., & Yoshikawa, I. (2020). Seasonal Variability of Mercury’s Sodium Exosphere Deduced From MESSENGER Data and Numerical Simulation. Journal of Geophysical Research: Planets, 125(9). https://doi.org/10.1029/202...
2020 doi
-
[928]
https://doi.org/10.1038/S41598-018- 19163-X Orsini, S., Mangano, V., Milillo, A., Mura, A., Aronica, A., De Angelis, E., et al. (2024). Remote sensing of mercury sodium exospheric patterns in relation to particle precipitation and interplanetary magnetic field. NatSR, 14(1), 3...
2024 doi
Reviewed August 7, 2026 · model on record in the stance chip above.
Discussion (0). Sign in to comment.