REVIEW 4 major objections 6 minor 5 references
Estimation of Head Motion in Structural MRI and its Impact on Cortical Thickness Measurements in Retrospective Data
T0 review · 4 major / 6 minor · reviewed 2026-08-07 · deepseek-v4-flash
Pith's one-line read A motion score learned on synthetic artifacts transfers to real retrospective MRI scans.
desk verdict A well-validated synthetic-to-real motion score, but the claim that it measures motion rather than generic image quality is only partially supported because the authors skip the continuous vNavs ground-truth they already hold. read the letter →
The pith
A machine-rendered reading of the paper's core claim, the machinery that carries it, and where it could break.
The reading
What carries the argument
The mechanism is the synthetic motion-augmentation plus RMS labeling loop. Clean volumes are corrupted by sampling a sequence of rigid-body transforms, applying them in image domain, and blending the resulting k-space lines; the RMS deviation of the composed transform (Jenkinson's metric) provides a continuous, objective label for every corrupted volume. The network learns to regress this label from the corrupted image alone, and heavy dropout plus noise and contrast augmentation is what makes the regressor survive the shift to real scanners. The architecture details matter less than this labeling loop: a two-convolution SFCN with 50-bin soft classification and KL-divergence training.
What would settle it
Scan a cohort with simultaneous optical motion tracking during MPRAGE acquisition, run the model on each volume, and compute the Spearman correlation between predicted score and tracked motion magnitude; if it approaches zero or reverses sign, the synthetic-to-real transfer claim is refuted. A cheaper partial test: on MR-ART's paired clean and deliberately moved scans from the same subject, check that the model consistently assigns higher motion to the moved scan in every individual, not just on average.
Extended reading notes
Core claim
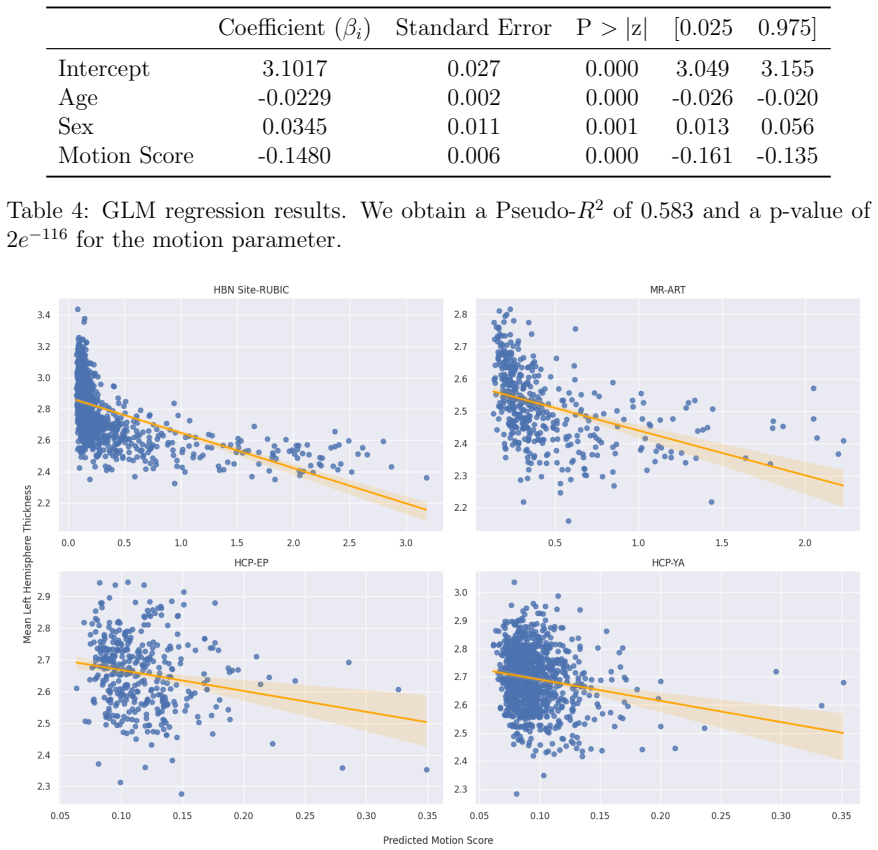
The authors build SFCN2, a lightweight 3D fully convolutional network that outputs a probability distribution over 50 motion bins and is trained by minimizing KL divergence to a Gaussian centered on the true motion label. The labels come from an entirely synthetic pipeline: 449 manually screened 'clean' T1 volumes from the Healthy Brain Network are repeatedly corrupted by TorchIO's k-space rigid-body motion augmentation, and each corrupted volume is labeled with the RMS deviation of the net transformation, an objective geometric quantity. Without any fine-tuning on real artifacts, the model ranks the MR-ART manual motion grades with Spearman 0.71, and its score shows a significant negative association with mean left-hemisphere cortical thickness in 12 of 15 held-out datasets (FDR-corrected), matching the known thickness-reducing effect of motion. The score also reproduces the established age pattern, with higher predicted motion in younger and older participants. The paper's central claim is that this synthetic-to-real transfer is genuine motion estimation, not just image-quality scoring.
Load-bearing premise
The approach stands or falls on the assumption that TorchIO's synthetic rigid-body k-space corruptions look enough like real head motion in MPRAGE scans that a network trained on them will score real scans correctly across scanner brands, protocols, and age groups.
Editorial extensions
If this is right
- Researchers can add the predicted motion score as a covariate in statistical models of cortical thickness, absorbing a bias that otherwise distorts group differences in pediatric and clinical populations.
- Quality control becomes an automated, continuous rating on already-acquired MPRAGE-like scans, replacing or complementing noisy manual review.
- The method transfers across scanner manufacturers and protocol variants without retraining, as shown by the significant associations on GE and Siemens datasets.
- Individual FreeSurfer estimates can be confidence-weighted or flagged when predicted motion is high, before downstream analyses are run.
- Studies whose subjects move more (children, ADHD, schizophrenia) can now quantify that motion post hoc, addressing a confound previously requiring prospective hardware.
Reading between the lines
- A natural next step the paper does not take is to threshold the continuous score into a formal inclusion or exclusion criterion; the current validation uses the score as a continuous covariate, not as a QC gate.
- The same synthetic-labeling loop could be extended to other artifact families (e.g., susceptibility, flow, ghosting) or other morphometric outputs (surface area, volume) by training separate regressors, since the label generation is modular.
- The transfer claim would be strengthened by a direct comparison against measured motion from vNavs or an optical tracker on the same subjects; the paper only validates against manual ratings and indirect thickness and age associations.
- Because the score is derived from a single volume, its per-subject reproducibility across repeated scans of the same person is untested; a test–retest study would clarify how much of the score is motion versus acquisition-specific noise.
Editorial analysis
A structured set of objections, weighed in public.
Referee Report
Summary. The paper trains a 3D convolutional neural network (SFCN2) to regress a scalar head-motion score from T1-weighted structural MRI. Training labels are RMS deviation values computed from synthetic rigid-body motion applied to clean HBN volumes using TorchIO. The model is evaluated on a synthetic test set, on MR-ART manual three-level motion grades, and on 15 real datasets by correlating predicted motion with FreeSurfer cortical thickness and age. The authors report a synthetic test R² of 0.94, a Spearman correlation of 0.71 with MR-ART labels, significant thickness–motion associations in 12/15 datasets after FDR correction, and age correlations consistent with prior literature.
Significance. If the central claim holds—that a model trained on synthetic motion artifacts yields a motion-specific score transferable across scanners and protocols—the work would provide a scalable, retrospective motion-assessment tool for structural MRI, with direct relevance to population studies of neurodevelopment and psychiatric disorders. Strengths include the unusually broad external evaluation (14 independent datasets plus one held-out site from the training cohort), explicit FDR correction across 525 fitted models, and publicly released code, model weights, manual labels, and an open-source CLI tool, all of which support reproducibility. The paper also demonstrates that simulated motion reproduces the known negative thickness–motion relationship in synthetic data, a useful internal consistency check.
major comments (4)
- [Abstract; §3.1.2] The abstract states that the method achieves "a representative R² = 0.65 versus manual labels," but the body reports only a Spearman rank correlation of 0.71 against MR-ART's three-level grades; no R² value is reported in Section 3.1.2 or anywhere else in the results. The authors must either report the actual R² and its computation (e.g., against which continuous variable, since MR-ART labels are ordinal) or correct the abstract, because the abstract's headline performance claim is currently unsupported by the presented evidence.
- [§2.1; §3.1.2] No validation is reported against continuous ground-truth motion, despite the availability of vNavs data. Section 2.1 states that CBIC and CUNY include T1w volumes acquired with vNavs-based prospective correction, and these same sites are used to generate synthetic training data. Yet the paper never compares predicted motion scores against the recorded vNavs motion estimates on those real volumes. Such a comparison would directly test whether the score tracks real in-scanner motion rather than generic image quality, and it is feasible with data already in the authors' possession. Without it, the claim that the model estimates head motion (Conclusion, Section 5) rather than a general artifact index is underdetermined.
- [§2.3.2, Eq. (1)] The RMS deviation label depends on an estimated brain radius Rc, but the paper never specifies how Rc is obtained. Because Rc scales the rotation contribution to the label, different choices change the label distribution and thus the learned score. Please state whether Rc is a fixed constant, derived from the affine-registered images, or taken from a template, and report its value; without this, the label definition is not fully reproducible.
- [§3.1.2; §3.2.2] The real-data validation strategy is indirect: MR-ART's three-level clinical-usability grades conflate motion with overall image quality, and the thickness and age correlations could plausibly be reproduced by any quality index that tracks blur or ghosting. The MR-ART dataset includes paired STAND/HM1/HM2 scans with known instructed motion levels, but the manuscript only reports the Spearman correlation against the three-level grade and does not report whether the predicted score discriminates the instructed motion condition in a paired analysis (e.g., STAND vs. HM1 vs. HM2). Adding such an analysis, or the vNavs comparison above, is necessary to support the conclusion that the model learns "purely synthetic motion artifacts" rather than a general quality score.
minor comments (6)
- [§2.2] The word "generalisabiliy" is misspelled and should be "generalizability."
- [§3.2.3] The sentence "These findings agree are in line with the literature" contains a duplicated verb; it should read "These findings are in line with the literature."
- [Figure 6 caption] The caption states "bottom left and top bottom"; the last phrase should be "bottom right" or similar.
- [§2.4; §2.5] Section 2.4 says the network is trained by minimizing KL divergence, while Section 2.5 says the validation selection criterion is Jensen-Shannon divergence; please clarify which objective is used for training and which for model selection.
- [§2.3.2] The variable name "emotion" is easily misread as "emotion" and should be renamed to something like "e_motion" or "target_motion" for clarity.
- [§5] The claim "This is the first attempt at correcting motion-related biases..." is stronger than what the paper demonstrates and could be softened to "a method for estimating motion that can be used to correct for motion-related biases."
Circularity Check
No significant circularity: the regressor is trained on synthetic RMS-deviation labels and validated on independent real-data outcomes (MR-ART labels, thickness in 15 datasets, age). One minor selection loop: the final model was chosen partly by its MR-ART correlation, which is then reported as headline validation.
-
other
[Section 3.1.3 (ablation, Table 3) selects the model; same labels are then reported as validation in Section 3.1.2.]
"On the MR-ART manual labels, the complete model outperforms the other variations by a large margin. This confirms that our model is more robust in real scenarios, even if its performance on synthetic data is lower."
Table 3 ranks four architecture/augmentation variants by their Spearman correlation with the MR-ART three-level labels, and the variant with the highest MR-ART correlation (0.71) is declared the complete model and used throughout the paper. The same MR-ART labels are then reported in Section 3.1.2 as validation evidence ('Our model achieves a high correlation of 0.71... demonstrating our model's capability for real motion prediction without fine-tuning on independent data'). The headline real-data correlation is thus partly self-referential: the configuration was selected because it maximized this very quantity, so the reported 0.71 is an optimistic selection-maximum rather than an unbiased prediction estimate.
full rationale
The paper's derivation chain is largely self-contained. The predicted quantity — the RMS deviation of simulated rigid-body k-space transforms (Eq. 1, Section 2.3.2) — is computed from the same transform matrices used to corrupt the clean volumes, so the synthetic labels are internally consistent by construction, and the network never sees cortical thickness, age, or manual ratings during training. Consequently, the real-data validations are genuinely out-of-sample: the Spearman 0.71 against MR-ART usability grades, the motion-thickness GLM coefficients (Eq. 2, Section 3.2.2), and the age regressions (Eq. 3, Section 3.2.3) all use predicted scores that the model could not have been fitted to reproduce. No fitted parameter is renamed as a prediction, no uniqueness theorem is imported from the authors, and no ansatz is smuggled in via self-citation. The self-citation (Bricout et al., 2025) is minor and not load-bearing — the SFCN architecture originates from Peng et al. (2021) and its motion-estimation use from Pollak et al. (2023). One minor self-referential step is flagged: the final configuration was selected partly by its MR-ART Spearman correlation (Table 3), and that same correlation is then presented as validation, modestly inflating the headline number. Two concerns noted in the manuscript are correctness risks rather than circularity: the Discussion's concession that creating 'more accurate artifact simulators' is future work, and the absence of validation against the continuous vNav motion measurements that the HBN CBIC/CUNY acquisitions (Section 2.1) could have supplied — the MR-ART three-level label conflates motion with general image quality. Score 2 reflects the minor selection loop; the central claim retains substantial independent evidence.
Assumptions & free parameters
free parameters (5)
- translation sampling coefficient =
max(emotion, 1)
- rotation sampling coefficient =
max(2*emotion, 1)
- transform tolerance =
0.02
- brain radius Rc =
not stated
- clean-volume QC cutoff =
449 of 4079 volumes
assumptions (5)
- domain assumption Synthetic motion via rigid-body transforms and k-space corruption mimics real head motion artifacts.
- domain assumption RMS deviation is an adequate scalar summary of motion severity.
- domain assumption Manual labels in MR-ART provide a valid ground truth for real motion.
- domain assumption Cortical thickness is linearly related to motion after adjusting for age and sex.
- domain assumption FreeSurfer cortical thickness estimates from processed volumes are used as ground truth.
Cite this review
Pith. "Pith review of Estimation of Head Motion in Structural MRI and its Impact on Cortical Thickness Measurements in Retrospective Data." pith.science (2026). https://pith.science/paper/XX7LUQYH
@misc{pith2026250523916,
  author       = {Pith},
  title        = {Pith review of: Estimation of Head Motion in Structural MRI and its Impact on Cortical Thickness Measurements in Retrospective Data},
  year         = {2026},
  howpublished = {\url{https://pith.science/paper/XX7LUQYH}},
  note         = {Machine review of arXiv:2505.23916}
}
abstract
Motion-related artifacts are inevitable in Magnetic Resonance Imaging (MRI) and can bias automated neuroanatomical metrics such as cortical thickness. These biases can interfere with statistical analysis which is a major concern as motion has been shown to be more prominent in certain populations such as children or individuals with ADHD. Manual review cannot objectively quantify motion in anatomical scans, and existing quantitative automated approaches often require specialized hardware or custom acquisition protocols. Here, we train a 3D convolutional neural network to estimate a summary motion metric in retrospective routine research scans by leveraging a large training dataset of synthetically motion-corrupted volumes. We validate our method with one held-out site from our training cohort and with 14 fully independent datasets, including one with manual ratings, achieving a representative $R^2 = 0.65$ versus manual labels and significant thickness-motion correlations in 12/15 datasets. Furthermore, our predicted motion correlates with subject age in line with prior studies. Our approach generalizes across scanner brands and protocols, enabling objective, scalable motion assessment in structural MRI studies without prospective motion correction. By providing reliable motion estimates, our method offers researchers a tool to assess and account for potential biases in cortical thickness analyses.
Figures


Figures from the paper (5 more)




Reference graph
Works this paper leans on
-
[1]
Shrout, P. E., & Fleiss, J. L. (1979). Intraclass correlations: Uses in assessing rater reliability. Psychological Bulletin , 86 (2), 420–428. https://doi.org/10.1037/ /0033-2909.86.2.420 Benjamini, Y., & Hochberg, Y. (1995). Controlling the False Discovery Rate: A Practi- cal and Powerful Approach to Multiple Testing.Journal of the Royal Statistical Soci...
arXiv 1979
-
[8]
https://doi.org/10.3389/fninf.2014.00044 Andre, J. B., Bresnahan, B. W., Mossa-Basha, M., Hoff, M. N., Smith, C. P., Anzai, Y., & Cohen, W. A. (2015). Toward Quantifying the Prevalence, Severity, and Cost Associated With Patient Motion During Clinical MR Examinations. Journal of the American College of Radiology , 12 (7), 689–695. https://doi. org/10.1016...
arXiv 2015
-
[15]
https://doi.org/10.3389/fninf.2021.689675 ´Ad´ am N´ arai, Petra Hermann, Tibor Auer, P´ eter Kemenczky, J´ anos Szalma, Istv´ an Homolya, Eszter Somogyi, P´ al Vakli, B´ ela Weiss, & Zolt´ an Vidny´ anszky. (2022). Movement-related artefacts (MR-ART) dataset of matched motion- corrupted and clean structural MRI brain scans. Nature. https://doi.org/10. 10...
-
[389]
https://doi.org/10.1002/mrm.23228 Fischl, B. (2012). FreeSurfer. NeuroImage, 62 (2), 774–781. https://doi.org/10.1016/ j.neuroimage.2012.01.021 Van Essen, D. C., Ugurbil, K., Auerbach, E., Barch, D., Behrens, T. E. J., Bucholz, R., Chang, A., Chen, L., Corbetta, M., Curtiss, S. W., Della Penna, S., Fein- berg, D., Glasser, M. F., Harel, N., Heath, A. C., ...
-
[418]
https://doi.org/10.1016/j.neuroimage.2017.12.059 Shaw, R., Sudre, C., Ourselin, S., & Cardoso, M. J. (2019). MRI k-Space Motion Arte- fact Augmentation: Model Robustness and Task-Specific Uncertainty [ISSN: 2640-3498]. Proceedings of The 2nd International Conference on Medical Imag- ing with Deep Learning , 427–436. Retrieved October 25, 2024, from https ...
arXiv 2019
Reviewed August 7, 2026 · model on record in the stance chip above.
Discussion (0). Sign in to comment.