REVIEW 2 major objections 6 minor 55 references
Photometric redshift estimation for emission line galaxies of DESI Legacy Imaging Surveys by CNN-MLP
T0 review · 2 major / 6 minor · reviewed 2026-08-07 · deepseek-v4-flash
Pith's one-line read A fused CNN-MLP network estimates emission-line galaxy redshifts with 1.4% scatter and a 2.57% outlier fraction.
desk verdict Competent multimodal ELG photo-z work undermined by an unsubstantiated abstract and lack of external comparisons; the headline metrics are dominated by bright low-z SDSS galaxies. read the letter →
The pith
A machine-rendered reading of the paper's core claim, the machinery that carries it, and where it could break.
The reading
What carries the argument
The load-bearing object is the CNN-MLP architecture with two deliberately separated image streams: one CNN processes seven-channel optical images (g, r, i, z plus optical colour differences) at 0.262 arcseconds per pixel, and a second, identically structured CNN processes three-channel infrared images (W1, W2, W1$-$W2) at 2.75 arcseconds per pixel. Each CNN uses an inception-module design adapted from earlier photometric-redshift networks, with the galactic extinction $E(B-V)$ concatenated into the image features; an MLP independently processes the 85 photometric features; and a final MLP fuses both streams into a 770-bin redshift classification. The mechanism that makes the fusion work is treating the resolution mismatch between optical and infrared images as a reason for separate branches: naive channel-wise concatenation of all ten image bands degrades performance below the optical-only case.
What would settle it
Take the DESI SV1/SV3 spectroscopic ELG subsample, restrict it to the DESI ELG colour-selection box and $z > 0.6$, and compute $\sigma_{\mathrm{NMAD}}$ and the outlier fraction on that subset; if the faint high-redshift metrics come out near the paper's own Table 5 value of roughly $\approx 0.048$ rather than the advertised $0.0140$, the central performance claim is shown not to transfer to the DESI target population.
Extended reading notes
Core claim
The central claim is that a multimodal network, with convolutional branches for optical and infrared images plus a multilayer perceptron for 85 photometric features, estimates photometric redshifts of emission-line galaxies more accurately than either data type alone. With a classification head that divides the redshift range 0 to 3.85 into 770 bins and takes the probability-weighted bin midpoint as the prediction, the model reports bias $=0.0002$, $\sigma_{\mathrm{NMAD}}=0.0140$, and an outlier fraction $\eta=0.0257$ on the test split, against $\sigma_{\mathrm{NMAD}}=0.0160$ and $\eta=0.0284$ for photometry alone and $\sigma_{\mathrm{NMAD}}=0.0164$ and $\eta=0.0316$ for images alone. The paper also finds that performance degrades for faint and high-redshift galaxies, that starforming galaxies are predicted most accurately, and that a single model trained on all magnitudes beats separately trained bright and faint models.
Load-bearing premise
The load-bearing premise is that a random split of this 192,375-galaxy sample, dominated by bright SDSS galaxies near $z \sim 0.1$ to $0.2$, represents the faint colour-selected DESI ELG population at $0.6 < z < 1.6$ for which the method is intended.
Editorial extensions
If this is right
- Adding images to photometry cuts $\sigma_{\mathrm{NMAD}}$ by about 12.5% relative to photometry alone and about 14.6% relative to images alone, with the outlier fraction dropping by roughly 0.3 to 0.6 percentage points.
- The classification formulation outputs a full redshift probability distribution for every galaxy, not just a point estimate, so the same model can support uncertainty-aware target selection.
- A single global model trained on all magnitudes outperforms a two-part bright/faint scheme, so the gains do not come from splitting the sample by brightness.
- The same image-plus-photometry fusion should transfer to other multi-band surveys with comparable image scales, such as LSST, CSST, and Euclid, which the paper names as downstream applications.
- The error analysis identifies faint galaxies and high-redshift sources as the residual problem, so future gains depend on better-represented faint training data rather than on further architectural changes.
Reading between the lines
- The paper's own Table 5 shows $\sigma_{\mathrm{NMAD}} \approx 0.048$ for the faint $r > 21.5$ subset, so the advertised 0.0140 describes the heterogeneous sample as a whole, not the faint colour-selected DESI ELG population at $0.6 < z < 1.6$.
- A decisive test the paper does not run is a holdout of DESI SV1/SV3 ELG spectra restricted to the DESI colour-selection box; it would settle whether the model transfers to the actual target population with the data already in hand.
- The outlier pattern, where faint low-redshift galaxies are predicted as high-redshift, suggests a redshift-stratified training weighting or synthetic faint-galaxy augmentation could shrink that error tail.
- Because the image-only branch still reaches $\sigma_{\mathrm{NMAD}}=0.0164$, image-based photometric redshifts could become viable for deep surveys that lack matched multi-band photometric catalogues, a direction the paper gestures at but does not demonstrate.
Editorial analysis
A structured set of objections, weighed in public.
Referee Report
Summary. The paper proposes a multimodal deep-learning model called CNN-MLP that combines convolutional neural networks on multi-band DESI Legacy Survey images with a multilayer perceptron on photometric features to estimate photometric redshifts of emission line galaxies. The model is trained and evaluated on a compiled sample of 192,375 ELGs with spectroscopic redshifts from 16 surveys, using a held-out test set. The authors report sigma_NMAD = 0.0140 and an outlier fraction of 2.57% on this test set, compare the full model against their own CNN-only and MLP-only baselines (Table 4), analyze performance as a function of redshift, magnitude, and ELG subtype, and examine outlier characteristics. The paper concludes that the method improves photo-z accuracy and 'directly benefits the target selection process for DESI.'
Significance. If the claims are properly supported, the paper would be a useful contribution to photometric redshift estimation for ELGs, a challenging population for DESI and future surveys. The evaluation uses standard metrics (bias, sigma_NMAD, outlier fraction) on a held-out test set with a redshift distribution matched to the training set, and the architecture and hyperparameter choices are described in sufficient detail to be reproducible. The ablation study against single-modality baselines is a reasonable first step. However, the central comparative claim in the abstract—'Compared to other models, CNN-MLP demonstrates a significant improvement'—is not substantiated by the experiments, which only compare against the authors' own baselines. Furthermore, the claim that the model directly benefits DESI target selection rests on an unvalidated domain-transfer assumption from a sample dominated by bright, low-redshift SDSS galaxies to the faint, high-redshift DESI ELG target population. These issues are load-bearing for the paper's main conclusions and require revision.
major comments (2)
- [Abstract; §5.1; Table 4] The abstract's claim that 'Compared to other models, CNN-MLP demonstrates a significant improvement' is not supported by the experiments reported in the paper. The only comparisons presented are against the authors' own MLP-only and CNN-only baselines (Table 4). No comparison is made to established photometric redshift codes such as EAZY, BPZ, or LePhare, nor to the DESI official photo-z used in target selection. The 15.78% outlier rate quoted from Zhou et al. (2025) in the Introduction refers to a different sample and a different evaluation context, and without reproducing that evaluation on the same test set it cannot substantiate a comparative improvement. The claim should either be supported by an external comparison on a common sample or revised to refer specifically to the single-modality baselines.
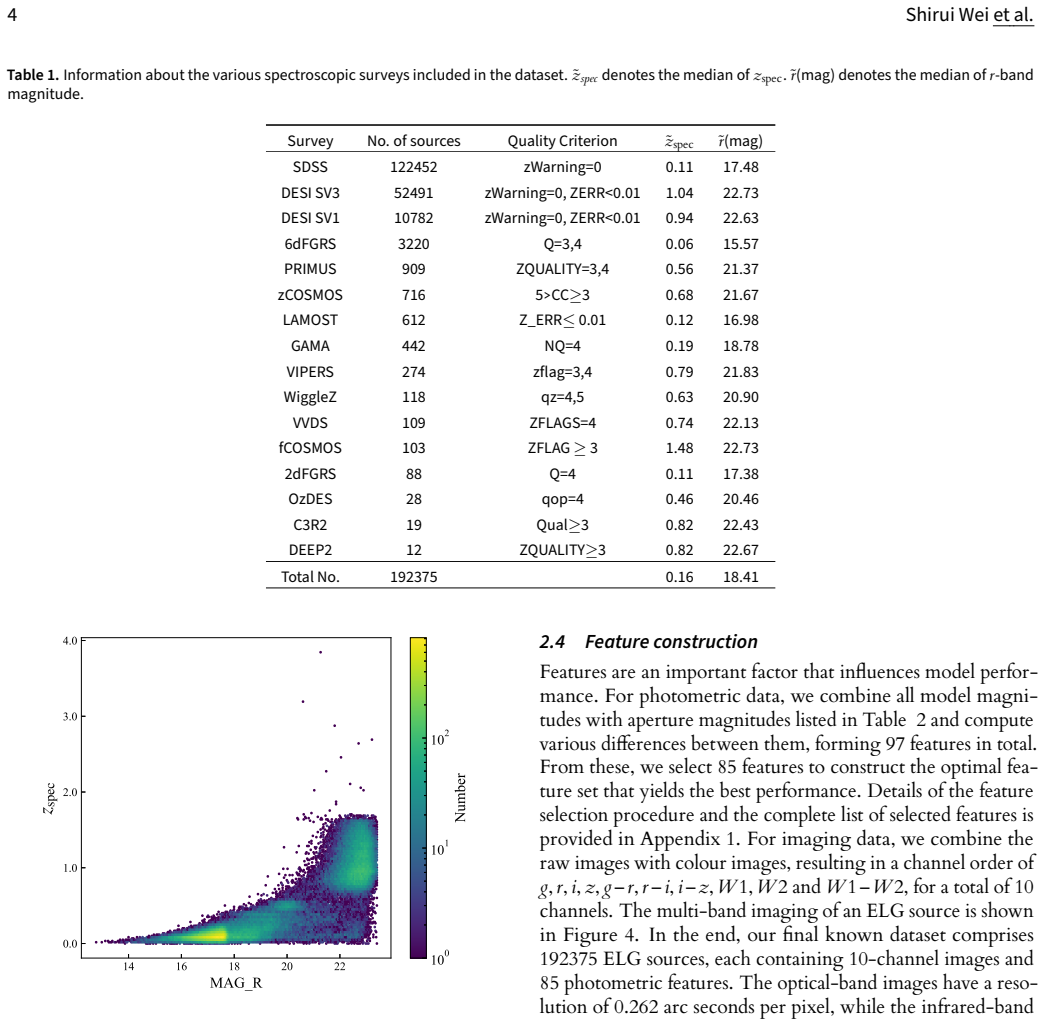
- [Section 6; Table 5; Section 2.3] The conclusion that the CNN-MLP model 'directly benefits the target selection process for DESI' is an extrapolation that is not validated by the data. The compiled sample is dominated by bright, low-redshift SDSS galaxies (median r = 18.41, median z = 0.16; Table 1), so the headline metrics on the test set do not represent performance on the DESI ELG target population (0.6 < z < 1.6, r ~ 22-23). Table 5 shows that for objects with MAG_R > 21.5, the one-part CNN-MLP model achieves sigma_NMAD = 0.0479 and an outlier fraction of 0.0691, several times worse than the headline values, and no validation is performed on a sample selected according to the DESI ELG target criteria of Raichoor et al. (2023). To support the DESI target-selection claim, the authors should either evaluate on a DESI-selected ELG sample or substantially qualify the statement.
minor comments (6)
- [§2.3 and §2.4] The text states that the downloaded image data have shape (192375, 6, 64, 64) for the six bands, but the model input has 10 channels (g, r, i, z, g-r, r-i, i-z, W1, W2, W1-W2). Please clarify that the colour-difference channels are constructed from the downloaded images before being fed to the network.
- [Equation (1)] The summation notation 'NcX k=1' appears corrupted in the manuscript; it should read 'z_phot = sum_{k=1}^{N_c} z_k P(z_k)'.
- [§5.4] In the sentence 'along with the outliers', 'alone' should be 'along'.
- [Table 5] The column header 'Model Sources' is unclear; consider renaming it to 'Sample subset' or 'Magnitude range' for readability.
- [Data Availability] The Data Availability statement provides access to the DESI LS10 catalogue but does not mention availability of the compiled training sample, the trained model weights, or the code. Sharing these would improve reproducibility.
- [References] There is a typo in the reference to York et al. (2000): 'Y ork' should be 'York'. Additionally, the header 'Publications of the Astronomical Society of Australia (2022)' appears to be a template artifact; the correct year should be used.
Circularity Check
No circularity: the photometric-redshift metrics are evaluated on a held-out test set with external spectroscopic labels; the main concerns are generalisation and overclaiming, not circular reasoning.
full rationale
The paper's core result (sigma_NMAD = 0.0140, eta = 0.0257) is obtained by training a CNN-MLP on 144,663 sources and evaluating on a separate 38,475-source test set whose labels are spectroscopic redshifts from external surveys (SDSS, DESI SV, etc.). No equation defines zphot in terms of the fitted outputs, no fitted parameter is renamed as a prediction, and no uniqueness or ansatz result is imported from the authors' prior work to force the model choice. The self-citations (e.g., Li et al. 2022, 2024) appear only as background/motivation and are not load-bearing. Two flagged concerns are correctness issues, not circularity: the abstract's 'compared to other models' claim is supported only by the authors' own single-modality baselines, and the DESI target-selection benefit is extrapolated from a sample dominated by bright low-z SDSS galaxies (Table 1) while the faint-subset metrics (sigma_NMAD = 0.0479, eta = 0.0691 in Table 5) are much worse. In addition, the classification-vs-regression choice in Appendix 2 appears to be evaluated on the test set, which is a model-selection-on-test concern; it inflates optimism but does not make the test prediction equivalent to the training inputs. Overall, the derivation is self-contained against an external label benchmark, so there is no significant circularity.
Assumptions & free parameters
free parameters (4)
- Redshift binning =
770 bins, width 0.005, range 0 to 3.85
- Photometric feature subset =
85 features selected from 97
- Hyperparameters =
See Table 3
- Train/validation/test split =
75:5:20
assumptions (4)
- domain assumption Spectroscopic redshifts used as labels are accurate and of sufficient quality.
- domain assumption DESI LS10 photometry and images are correctly calibrated and co-registered across bands.
- domain assumption The compiled spec-z sample is representative of the ELG population for the intended use.
- standard math PyTorch's implementation of convolutions, pooling, softmax, and cross-entropy is correct.
Cite this review
Pith. "Pith review of Photometric redshift estimation for emission line galaxies of DESI Legacy Imaging Surveys by CNN-MLP." pith.science (2026). https://pith.science/paper/HIMAAM57
@misc{pith2026250524175,
  author       = {Pith},
  title        = {Pith review of: Photometric redshift estimation for emission line galaxies of DESI Legacy Imaging Surveys by CNN-MLP},
  year         = {2026},
  howpublished = {\url{https://pith.science/paper/HIMAAM57}},
  note         = {Machine review of arXiv:2505.24175}
}
abstract
Emission Line Galaxies (ELGs) are crucial for cosmological studies, particularly in understanding the large-scale structure of the Universe and the role of dark energy. ELGs form an essential component of the target catalogue for the Dark Energy Spectroscopic Instrument (DESI), a major astronomical survey. However, the accurate selection of ELGs for such surveys is challenging due to the inherent uncertainties in determining their redshifts with photometric data. In order to improve the accuracy of photometric redshift estimation for ELGs, we propose a novel approach CNN-MLP that combines Convolutional Neural Networks (CNNs) with Multilayer Perceptrons (MLPs). This approach integrates both images and photometric data derived from the DESI Legacy Imaging Surveys Data Release 10. By leveraging the complementary strengths of CNNs (for image data processing) and MLPs (for photometric feature integration), the CNN-MLP model achieves a $\sigma_{\mathrm{NMAD}}$ (normalised median absolute deviation) of 0.0140 and an outlier fraction of 2.57%. Compared to other models, CNN-MLP demonstrates a significant improvement in the accuracy of ELG photometric redshift estimation, which directly benefits the target selection process for DESI. In addition, we explore the photometric redshifts of different galaxy types (Starforming, Starburst, AGN, Broadline). Furthermore, this approach will contribute to more reliable photometric redshift estimation in ongoing and future large-scale sky surveys (e.g. LSST, CSST, Euclid), enhancing the overall efficiency of cosmological research and galaxy surveys.
Figures


Figures from the paper (7 more)



Reference graph
Works this paper leans on
-
[1]
2022, ApJS, 259, 35
Abdurro’uf, Accetta, K., Aerts, C., et al. 2022, ApJS, 259, 35
2022
-
[2]
Ansel, J., Yang, E., He, H., et al. 2024, in 29th ACM International Conference on Architectural Support for Programming Languages and Operating
work page 2024
-
[3]
1999, MNRAS, 310, 540
Arnouts, S., Cristiani, S., Moscardini, L., et al. 1999, MNRAS, 310, 540
1999
-
[4]
Baum, W. A. 1962, in IAU Symposium, V ol. 15, Problems of Extra-Galactic Research, ed. G. C. McVittie, 390 Benítez, N. 2000, ApJ, 536, 571
work page 1962
-
[5]
2020, Experiment Tracking with Weights and Biases, software available from wandb.com
Biewald, L. 2020, Experiment Tracking with Weights and Biases, software available from wandb.com
work page 2020
-
[6]
M., & Pelló, R
Bolzonella, M., Miralles, J. M., & Pelló, R. 2000, A&A, 363, 476
2000
-
[7]
B., van Dokkum, P
Brammer, G. B., van Dokkum, P. G., & Coppi, P. 2008, ApJ, 686, 1503
2008
-
[8]
Carliles, S., Budavári, T., Heinis, S., Priebe, C., & Szalay, A. S. 2010, ApJ, 712, 511
work page 2010
Show all 55 references
-
[9]
G., Hogg, D
Cohen, J. G., Hogg, D. W., Blandford, R., et al. 2000, ApJ, 538, 29
2000
-
[10]
L., Blanton, M
Coil, A. L., Blanton, M. R., Burles, S. M., et al. 2011, ApJ, 741, 8
2011
-
[11]
A., Jackson, C., et al
Colless, M., Peterson, B. A., Jackson, C., et al. 2003, arXiv e-prints, arXiv:0306581
2003
-
[12]
J., Moustakas, J., Blanton, M
Cool, R. J., Moustakas, J., Blanton, M. R., et al. 2013, ApJ, 767, 118
2013
-
[13]
J., et al
Csabai, I., Budavári, T., Connolly, A. J., et al. 2003, AJ, 125, 580
2003
-
[14]
2012, Research in Astronomy and Astrophysics, 12, 1197 Dark Energy Survey Collaboration, Abbott, T., Abdalla, F
Cui, X.-Q., Zhao, Y.-H., Chu, Y.-Q., et al. 2012, Research in Astronomy and Astrophysics, 12, 1197 Dark Energy Survey Collaboration, Abbott, T., Abdalla, F. B., et al. 2016, MNRAS, 460, 1270 DESI Collaboration, Aghamousa, A., Aguilar, J., et al. 2016a, arXiv e-prints, arXiv:16...
2012 arXiv
-
[15]
J., Lang, D., et al
Dey, A., Schlegel, D. J., Lang, D., et al. 2019, AJ, 157, 168
2019
-
[16]
H., Newman, J
Dey, B., Andrews, B. H., Newman, J. A., et al. 2022, MNRAS, 515, 5285
2022
-
[17]
J., Jurek, R
Drinkwater, M. J., Jurek, R. J., Blake, C., et al. 2010, MNRAS, 401, 1429
2010
-
[18]
L., Nidever, D
Drlica-Wagner, A., Carlin, J. L., Nidever, D. L., et al. 2021, ApJS, 256, 2 Euclid Collaboration, Mellier, Y., Abdurro’uf, et al. 2024, arXiv e-prints, arXiv:2405.13491
2021
-
[19]
M., Porciani, C., et al
Feldmann, R., Carollo, C. M., Porciani, C., et al. 2006, MNRAS, 372, 565
2006
-
[20]
T., Honscheid, K., et al
Flaugher, B., Diehl, H. T., Honscheid, K., et al. 2015, AJ, 150, 150
2015
-
[21]
2022, MNRAS, 512, 1696
Henghes, B., Thiyagalingam, J., Pettitt, C., Hey, T., & Lahav, O. 2022, MNRAS, 512, 1696
2022
-
[22]
2012, MNRAS, 421, 2355
Hildebrandt, H., Erben, T., Kuijken, K., et al. 2012, MNRAS, 421, 2355
2012
-
[23]
2016, Astronomy and Computing, 16, 34
Hoyle, B. 2016, Astronomy and Computing, 16, 34
2016
-
[24]
J., et al
Ilbert, O., Arnouts, S., McCracken, H. J., et al. 2006, A&A, 457, 841 Ivezić, Ž., Kahn, S. M., Tyson, J. A., et al. 2019, ApJ, 873, 111
2006
-
[25]
H., Read, M
Jones, D. H., Read, M. A., Saunders, W., et al. 2009, MNRAS, 399, 683
2009
-
[26]
D., Sanders, D., et al
Kashino, D., Silverman, J. D., Sanders, D., et al. 2019, ApJS, 241, 10 14 Shirui Wei et al. Le Fèvre, O., Cassata, P., Cucciati, O., et al. 2013, A&A, 559, A14
2019
-
[27]
1998, Proceedings of the IEEE, 86, 2278
Lecun, Y., Bottou, L., Bengio, Y., & Haffner, P. 1998, Proceedings of the IEEE, 86, 2278
1998
-
[28]
2013, arXiv e-prints, arXiv:1308.0847
Levi, M., Bebek, C., Beers, T., et al. 2013, arXiv e-prints, arXiv:1308.0847
2013 arXiv
-
[29]
2017, proceedings IAU Symposium No
Li, C., Cui, C., Mi, L., & et al. 2017, proceedings IAU Symposium No. 325, Astroinformatics
2017
-
[30]
2022, MNRAS, 509, 2289 —
Li, C., Zhang, Y., Cui, C., et al. 2022, MNRAS, 509, 2289 —. 2024, AJ, 168, 233
2022
-
[31]
E., Davis, T
Lidman, C., Tucker, B. E., Davis, T. M., et al. 2020, MNRAS, 496, 19
2020
-
[32]
J., Le Brun, V., Maier, C., et al
Lilly, S. J., Le Brun, V., Maier, C., et al. 2009, ApJS, 184, 218
2009
-
[33]
K., Driver, S
Liske, J., Baldry, I. K., Driver, S. P., et al. 2015, MNRAS, 452, 2087
2015
-
[34]
L., Zhao, Y.-H., Zhao, G., et al
Luo, A. L., Zhao, Y.-H., Zhao, G., et al. 2015, Research in Astronomy and Astrophysics, 15, 1095
2015
-
[35]
M., et al
Mainzer, A., Bauer, J., Cutri, R. M., et al. 2014, ApJ, 792, 30
2014
-
[36]
C., Stern, D
Masters, D. C., Stern, D. K., Cohen, J. G., et al. 2017, ApJ, 841, 111
2017
-
[37]
2018, arXiv e-prints, arXiv:1802.03426
McInnes, L., Healy, J., & Melville, J. 2018, arXiv e-prints, arXiv:1802.03426
2018 arXiv
-
[38]
A., & Gruen, D
Newman, J. A., & Gruen, D. 2022, ARA&A, 60, 363
2022
-
[39]
A., Cooper, M
Newman, J. A., Cooper, M. C., Davis, M., et al. 2013, ApJS, 208, 5
2013
-
[40]
2019, A&A, 621, A26
Pasquet, J., Bertin, E., Treyer, M., Arnouts, S., & Fouchez, D. 2019, A&A, 621, A26
2019
-
[41]
A., et al
Raichoor, A., Moustakas, J., Newman, J. A., et al. 2023, AJ, 165, 126
2023
-
[42]
2024, A&A, 692, A260
Roster, W., Salvato, M., Krippendorf, S., et al. 2024, A&A, 692, A260
2024
-
[43]
2019, Nature Astronomy, 3, 212
Salvato, M., Ilbert, O., & Hoyle, B. 2019, Nature Astronomy, 3, 212
2019
-
[44]
2018, A&A, 609, A84
Scodeggio, M., Guzzo, L., Garilli, B., et al. 2018, A&A, 609, A84
2018
-
[45]
R., Blum, R
Silva, D. R., Blum, R. D., Allen, L., et al. 2016, in American Astronomical So- ciety Meeting Abstracts, V ol. 228, American Astronomical Society Meeting Abstracts #228, 317.02
2016
-
[46]
2024, MNRAS, 527, 651
Treyer, M., Ait Ouahmed, R., Pasquet, J., et al. 2024, MNRAS, 527, 651
2024
-
[47]
2005, PASP, 117, 79
Wadadekar, Y. 2005, PASP, 117, 79
2005
-
[48]
L., et al
Yao, L., Qiu, B., Luo, A. L., et al. 2023, MNRAS, 523, 5799 Y ork, D. G., Adelman, J., Anderson, J. E., & et al. 2000, AJ, 120, 1579
2023
-
[49]
2011, Scientia Sinica Physica, Mechanica & Astronomica, 41, 1441
Zhan, H. 2011, Scientia Sinica Physica, Mechanica & Astronomica, 41, 1441
2011
-
[50]
2024, AJ, 168, 244
Zhang, C., Wang, W., Qu, M., Jiang, B., & Zhang, Y. 2024, AJ, 168, 244
2024
-
[51]
2013, The Astronom- ical Journal, 146, 22
Zhang, Y., Ma, H., Peng, N., Zhao, Y., & bing Wu, X. 2013, The Astronom- ical Journal, 146, 22
2013
-
[52]
2012, Re- search in Astronomy and Astrophysics, 12, 723
Zhao, G., Zhao, Y.-H., Chu, Y.-Q., Jing, Y.-P., & Deng, L.-C. 2012, Re- search in Astronomy and Astrophysics, 12, 723
2012
-
[53]
Zhou, R., Ferraro, S., White, M., et al. 2023, J. Cosmology Astropart. Phys., 2023, 097
2023
-
[54]
2025, MNRAS, 536, 2260
Zhou, X., Li, N., Zou, H., et al. 2025, MNRAS, 536, 2260
2025
-
[55]
2017, AJ, 153, 276 Appendix 1
Zou, H., Zhang, T., Zhou, Z., et al. 2017, AJ, 153, 276 Appendix 1. Photometric features Photometric data provide rich information on galaxy lumi- nosities across multiple bands. To fully exploit this information for zphot estimation, we construct a set of 97 features by com- ...
2017
Reviewed August 7, 2026 · model on record in the stance chip above.
Discussion (0). Sign in to comment.