REVIEW 4 major objections 6 minor 1 cited by
Numerical simulation of oscillatory magnetic reconnection modulated by solar convective motions
T0 review · 4 major / 6 minor · reviewed 2026-08-07 · deepseek-v4-flash
Pith's one-line read Solar convective motions, not the reconnection itself, drive oscillatory current-sheet reversals, and the longest simulated oscillation period matches the observed 30-minute period.
desk verdict A novel radiative MHD simulation with a plausible but under-supported convective-driving mechanism; worth refereeing with major revisions. read the letter →
The pith
A machine-rendered reading of the paper's core claim, the machinery that carries it, and where it could break.
The reading
What carries the argument
The central mechanism is the quasi-periodic external force exerted on the reconnection region by convectively driven flux emergence, realized through self-consistent convection in the upper convection zone and photosphere that modulates the plasma pressure gradient, Lorentz force, and gravity under the lower reconnection outflow region. The driving signal is carried by the emergence of the inserted Gold-Hoyle flux rope, a uniformly twisted flux tube model with central field strength $B_1 = 6400$ G, twist $b = 3.0$, and decay factor $c = 0.055$. The diagnostic that carries the argument is the repeated collapse of the current sheet and its regrowth in the perpendicular direction, with the force balance at the current sheet determining which orientation is favored.
What would settle it
Run the same setup in a wider horizontal domain (for example 40 Mm or 80 Mm wide) and with different flux-rope twist and field strength values, then check whether the 30-minute first period and the 100-400 s reconnection-rate oscillations persist; if the periods shift substantially, the convective-driving claim is undermined. Also compare against a control run with the flux rope inserted at a different depth or with convection suppressed below the photosphere.
Extended reading notes
Core claim
In a 2.5D radiative MHD simulation that includes convective motions self-consistently, the current sheet at the interface between an emerging Gold-Hoyle flux rope and a vertical background field repeatedly shrinks to zero and regrows in the perpendicular direction. Over 5771 s the sheet orientation reverses 41 times, giving 40 oscillation periods whose first and longest period is about 30 minutes, matching the period reported by Hong et al. (2019). Force analysis shows the accumulated hot outflows produce only weak forces in the reconnection region; instead the orientation reversal is controlled by changes in gas pressure gradient, Lorentz force, and gravity below the lower outflow region, driven by the emergence of plasma and magnetic fields from the convection zone. The alternating inflow and outflow regions shift the upward reconnection outflows horizontally, explaining observed parallel shifting jets, and the reconnection rate at the main X-point oscillates with a 100-400 s period similar to p-mode oscillations.
Load-bearing premise
The load-bearing premise is that the quasi-periodic forcing comes from self-consistent convection rather than from the artificial insertion of the flux rope, the periodic side boundaries, or numerical diffusivity.
Editorial extensions
If this is right
- Observed ~30-minute current-sheet oscillation periods can be produced by convective modulation, without invoking a self-sustained oscillator inside the reconnection site.
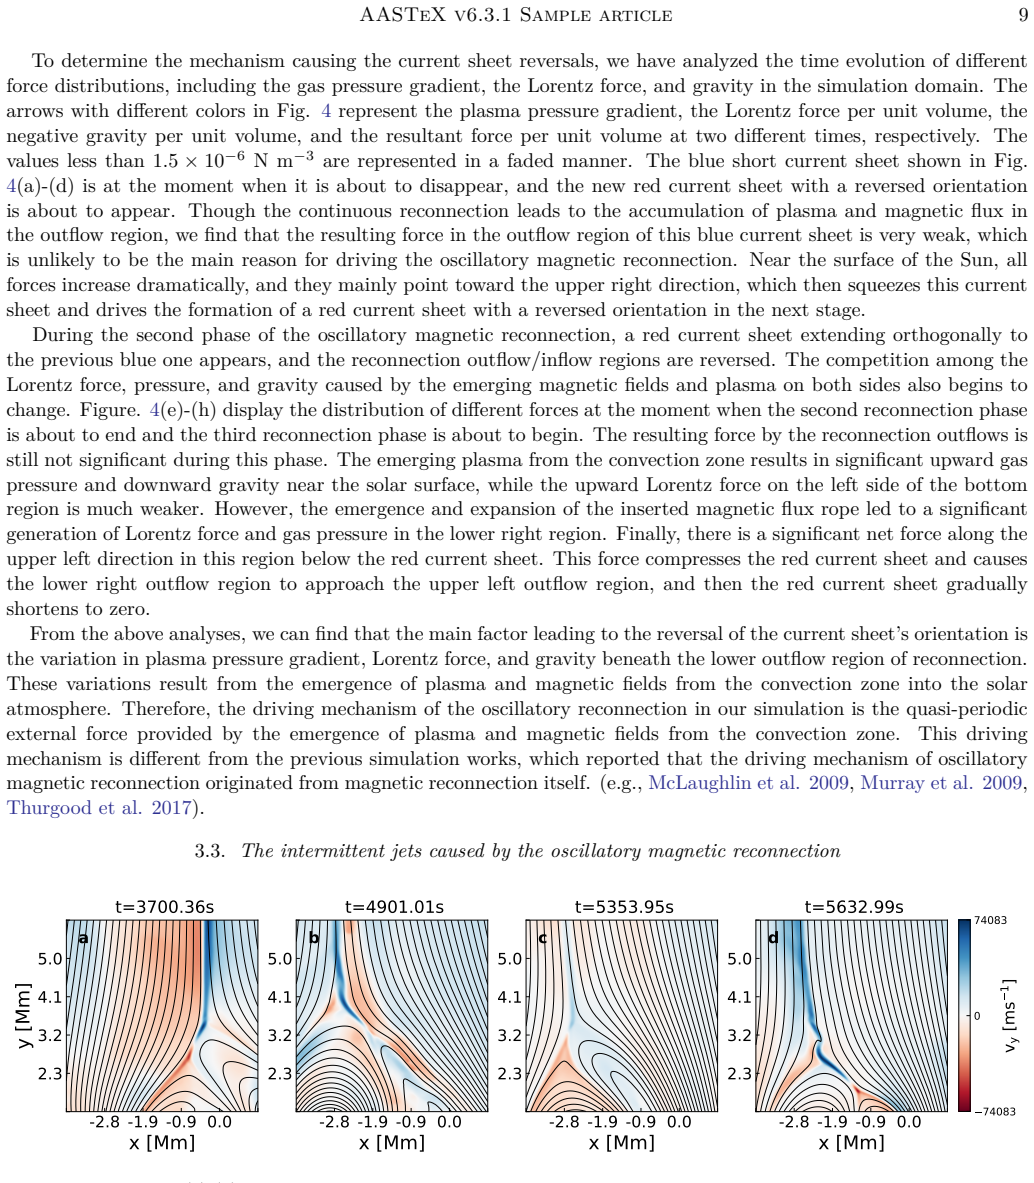
- Parallel shifting jets observed in EUV and H-alpha bands can be explained by alternating outflow regions at a single reconnection site, rather than by multiple independent ejection sites.
- 100-400 s oscillations in reconnection rate can explain 2.5-5 minute quasi-periodic brightenings and connect them to p-mode oscillations generated in the convection zone.
- Because the driver is external, the oscillation period depends on the convective and emergence environment, so periods should vary with height and with the strength of the background magnetic field.
- The modulation effect weakens for reconnection events at higher altitude, so the model predicts that the longest, most regular orientation-reversal periods occur low in the corona or near the base of open-field regions.
Reading between the lines
- If convective driving is the controlling factor, observed oscillatory reconnection periods should correlate with the local granulation and p-mode power spectrum; this is testable by combining helioseismic observations with coronal imaging of reconnecting current sheets.
- The single flux-rope insertion and 20 Mm-wide domain leave open the possibility that the 30-minute period is set by the emergence timescale of the specific inserted rope rather than by a universal convective timescale; more realistic continuous flux emergence could produce a spectrum of periods.
- The model implies that oscillatory reconnection periods are not an intrinsic property of reconnection, so scaling laws based only on X-point plasma parameters may need to be supplemented by descriptions that couple the reconnection site to the external driver.
- The synthesized AIA 17.1 nm images matching observed current sheets suggest that forward modeling of such simulations can help observers distinguish externally driven from internally driven oscillatory reconnection.
Editorial analysis
A structured set of objections, weighed in public.
Referee Report
Summary. The paper presents 2.5D radiative MHD simulations of magnetic flux emergence from the convection zone into the lower corona, using the NIRVANA code with Spitzer-type resistivity, stratified radiative cooling, and field-aligned thermal conduction. A Gold-Hoyle flux rope (Eqs. 21-23) is inserted at t=2048 s into a convecting domain, and reconnection with a vertical 10 G background field produces 41 current-sheet orientation reversals over about 5771 s. The authors report a longest period of about 30 minutes matching Hong et al. (2019), parallel shifting jets in synthetic AIA 171 images, and 100-400 s oscillations in the X-point current density interpreted as p-mode-related. They attribute the reversals primarily to quasi-periodic external forces from convective emergence (Section 3.2), in contrast to earlier intrinsic back-pressure mechanisms.
Significance. If correct, the work would establish a new external-driving route to oscillatory reconnection: modulation by convective flux emergence, rather than the internal back-pressure mechanism of McLaughlin et al. (2009) and Murray et al. (2009). The 30-minute first period is an emergent output rather than an input parameter, which gives the comparison with Hong et al. (2019) real weight, and the synthetic AIA 171 images provide a concrete observable connection. The parallel-jet interpretation is a useful, falsifiable prediction. However, the central causal mechanism is currently supported only by qualitative force snapshots at two times, and the robustness of the periods to resolution and initial conditions is untested.
major comments (4)
- [3.2, Fig. 4] The claim that quasi-periodic external forcing from convection is the main cause of current-sheet reversals is inferred from force arrows at only two times (t=4763.78 s and t=5097.2 s). No time-resolved series of the pressure-gradient, Lorentz, and gravitational forces below the current sheet is provided, and no phase analysis links these forces to the 41 reversal events. The presented snapshots therefore cannot exclude the intrinsic reconnection-outflow back-pressure mechanism of McLaughlin et al. (2009) and Murray et al. (2009), nor can they rule out a dominant role of numerical or coronal diffusion in setting the reconnection timescale. I request a quantitative force-budget time series (for example, integrated forces in a control volume below the X-point) and their cross-correlation with reversal times, or a control simulation with the convection disabled.
- [2.3, Eqs. (21)-(23); 3.1] The 20-Mm-wide periodic domain and the hand-inserted Gold-Hoyle flux rope (B1=6400 G, b=3.0, c=0.055) introduce several free parameters, and no sensitivity study or convergence test is reported. The 30-minute first period could be a transient of the rope insertion or of the periodic side boundaries rather than a robust convective signature. The statement that the current sheet is far from the side boundaries does not test whether the periodic boundary condition or the domain width affects the oscillation period or the force balance. I recommend additional runs at higher resolution and with varied domain width and rope parameters to establish that the 30-minute and 100-400 s periods are robust.
- [1, 3.1, 4] There is an internal inconsistency in the novelty claim. Section 1 states that Murray et al. (2009) 'mentioned that there is an oscillatory reconnection period lasting up to 30 minutes in the late reconnection phase,' while Section 3.1 says 'Such a long period of 30 minutes has not been displayed in the previous papers' and Section 4 repeats this. The authors should either credit Murray et al. (2009) explicitly as having produced a 30-minute period and then state what is new here, or correct the Section 1 description; as written, the claim of uniqueness is not self-consistent.
- [3.4, Fig. 6] The 100-400 s reconnection-rate oscillation is presented with a wavelet analysis using a 69% confidence threshold, which is low, and the attribution to p-mode oscillations is based on similarity to literature periods rather than on a demonstrated causal link within the simulation. The authors should report the wavelet significance more conservatively, show whether the 100-400 s peaks are robust to the choice of time-series window and detrending, and ideally test for a causal connection by comparing with the photospheric velocity spectrum in the same run.
minor comments (6)
- [3.1] The 41 listed phase durations sum to 5646 s, not to the stated 5771 s or to the interval from t=3357 s to t=9130 s (5773 s); please reconcile the phase list with the stated total duration.
- [2.1, Eq. (9)] The collision frequency is written as 'v_en' in Eq. (9) and surrounding text although the symbol is presumably ν_en; please make the notation consistent.
- [2.3] The claim that the system reaches a 'dynamic equilibrium state after 2000 s' is not supported by any diagnostics; a brief quantification of the temperature, density, or velocity drift before the flux-rope insertion would help.
- [Fig. 6 caption] The caption contains a typo: 'reconnetcion' should be 'reconnection'.
- [4] In conclusion item 4, 'solar ares' should be 'solar flares'.
- [Title page] The first author's name is rendered as 'Yifu W ang' in the header; the spacing should be corrected to 'Yifu Wang'.
Circularity Check
No significant circularity: the oscillation periods and force-balance conclusion are emergent outputs of a radiative MHD simulation, not fitted inputs or self-referential definitions.
full rationale
The paper's central quantitative claims are measured outputs rather than fitted parameters. The 30-minute first period is obtained by counting 41 current-sheet orientation reversals between t=3357 s and t=9130 s and summing adjacent phase durations; the 100-400 s reconnection-rate oscillation comes from a wavelet analysis of the time series of current density at the X-point. Neither quantity is used to adjust the simulation setup. The flux-rope parameters (B1=6400 G, b=3.0, c=0.055, Eq. 21-23), domain size, and boundary conditions are specified before the measurement and are not tuned to reproduce Hong et al. (2019); the agreement with the observed 30-minute period is post hoc. The causal attribution of the reversals to quasi-periodic external forcing is an interpretation of two force snapshots in Sec. 3.2, and one may question whether two snapshots establish a robust time-resolved mechanism, but that is an evidence-strength issue, not circularity: the conclusion is not encoded in the equations or initial conditions by construction. The self-citations to Ni et al. (2022) and Cheng et al. (2024) support the NIRVANA code and radiative-cooling implementation; they do not supply the periods or the force-balance result. No load-bearing step reduces to its own input, and no prediction is equivalent to a fitted value by definition.
Assumptions & free parameters
free parameters (6)
- B1 (peak flux rope field) =
6400 G
- b (flux rope twist) =
3.0
- c (flux rope decay factor) =
0.055
- flux rope center (x0,y0) =
2e6 m, -1e6 m
- background field By =
10 G
- initial density perturbation =
not specified
assumptions (5)
- domain assumption MHD with Spitzer resistivity and radiative cooling models from Carlsson & Leenaarts (2012) and Abbett & Fisher (2012) adequately captures the low solar atmosphere.
- domain assumption The 2.5D setup with a uniform out-of-plane direction captures the essential reconnection dynamics of the 3D Sun.
- ad hoc to paper After 2000 s the non-equilibrium initial state reaches a dynamic equilibrium with self-consistently generated convection, and the inserted flux rope is a realistic representation of emerging flux.
- domain assumption Numerical diffusivity in the corona, though larger than Spitzer diffusivity, does not dominate the reconnection oscillation periods.
- domain assumption The periodic side boundaries over 20 Mm do not artificially set the oscillation periods.
Cite this review
Pith. "Pith review of Numerical simulation of oscillatory magnetic reconnection modulated by solar convective motions." pith.science (2026). https://pith.science/paper/C5BIQL2Q
@misc{pith2026250524335,
  author       = {Pith},
  title        = {Pith review of: Numerical simulation of oscillatory magnetic reconnection modulated by solar convective motions},
  year         = {2026},
  howpublished = {\url{https://pith.science/paper/C5BIQL2Q}},
  note         = {Machine review of arXiv:2505.24335}
}
read the original abstract
Oscillatory magnetic reconnection is a periodic magnetic reconnection process, during which the current sheet's orientation and the magnetic connections change periodically. This periodic variation is generally considered to originate from the magnetic reconnection itself rather than from external driving processes. We conduct 2.5-dimensional radiative magnetohydrodynamic simulations to investigate the emergence of a magnetic flux tube from the convection zone into the lower corona, where the emerging magnetic fields reconnect with background ones. During the reconnection process within 5771 s, the current sheet's orientation has been reversed 41 times, corresponding to 40 oscillation periods. Notably, the longest period is 30 minutes, which is consistent with the previous observational results. We find that the main factor leading to the reversal of the current sheet's orientation is the quasi-periodic external force provided by the emergence of plasma and magnetic fields from the convection zone. We also find the shifting of the upward outflows from the reconnection region along the horizontal direction due to the alternating changes of the reconnection inflow and outflow regions. In addition to the quasi-periodic change of the current sheet orientation, the reconnection rate at the main X-point also oscillates with a period between 100-400 s, which corresponds to the period of p-mode oscillations.
Figures


Figures from the paper (3 more)


Forward citations
Cited by 1 Pith paper
-
Oscillatory reconnection and resonant response to wave excitation in 2D coronal null points
In stratified coronal simulations, null-point reconnection oscillates at the null point's resonant-cavity frequency, distinct from the external driver frequency.
Reference graph
Works this paper leans on
-
[1]
Abbett, W. P., & Fisher, G. H. 2012, SoPh, 277, 3, doi: 10.1007/s11207-011-9817-3
-
[2]
Avrett, E. H., & Loeser, R. 2008, ApJS, 175, 229, doi: 10.1086/523671
doi:10.1086/523671 2008
-
[3]
1963, ApJ, 137, 901, doi: 10.1086/147566
Bahng, J., & Schwarzschild, M. 1963, ApJ, 137, 901, doi: 10.1086/147566
-
[4]
2024, A&A, 682, A183, doi: 10.1051/0004-6361/202348053
Cai, Q., Ruan, G., Zheng, C., et al. 2024, A&A, 682, A183, doi: 10.1051/0004-6361/202348053
-
[5]
2012, A&A, 539, A39, doi: 10.1051/0004-6361/201118366
Carlsson, M., & Leenaarts, J. 2012, A&A, 539, A39, doi: 10.1051/0004-6361/201118366
-
[6]
Carlsson, M., & Stein, R. F. 2002, ApJ, 572, 626, doi: 10.1086/340293
doi:10.1086/340293 2002
-
[7]
2021, A&A, 650, A6, doi: 10.1051/0004-6361/202039510
Cattell, C., Glesener, L., Leiran, B., et al. 2021, A&A, 650, A6, doi: 10.1051/0004-6361/202039510
-
[8]
Chen, F., Cheung, M. C. M., Rempel, M., & Chintzoglou, G. 2023, ApJ, 949, 118, doi: 10.3847/1538-4357/acc8c5
Show all 68 references
-
[9]
F., & Priest, E
Chen, P. F., & Priest, E. R. 2006, SoPh, 238, 313, doi: 10.1007/s11207-006-0215-1
2006 doi
- [10]
-
[11]
2022, ApJ, 933, 148, doi: 10.3847/1538-4357/ac73ef
Chen, Y., Ye, J., Mei, Z., et al. 2022, ApJ, 933, 148, doi: 10.3847/1538-4357/ac73ef
2022 doi
-
[12]
2024, A&A, 685, A2, doi: 10.1051/0004-6361/202347012
Cheng, G., Ni, L., Chen, Y., & Lin, J. 2024, A&A, 685, A2, doi: 10.1051/0004-6361/202347012
2024 doi
-
[13]
2021, Research in Astronomy and Astrophysics, 21, 229, doi: 10.1088/1674-4527/21/9/229
Cheng, G.-C., Ni, L., Chen, Y.-J., Ziegler, U., & Lin, J. 2021, Research in Astronomy and Astrophysics, 21, 229, doi: 10.1088/1674-4527/21/9/229
2021 doi
-
[14]
Cheung, M. C. M., & Isobe, H. 2014, Living Reviews in Solar Physics, 11, 3, doi: 10.12942/lrsp-2014-3
2014 doi
-
[15]
2012, Astronomische Nachrichten, 333, 872, doi: 10.1002/asna.201211738
Collados, M., L´ opez, R., P´ aez, E., et al. 2012, Astronomische Nachrichten, 333, 872, doi: 10.1002/asna.201211738
2012 doi
-
[16]
Craig, I. J. D., & McClymont, A. N. 1991, ApJL, 371, L41, doi: 10.1086/185997 AASTeX v6.3.1 Sample article13 Del Zanna, G., Dere, K. P., Young, P. R., Landi, E., &
1991 doi
-
[17]
Mason, H. E. 2015, A&A, 582, A56, doi: 10.1051/0004-6361/201526827
2015 doi
-
[18]
Frazier, E. N. 1968, ApJ, 152, 557, doi: 10.1086/149572
1968 doi
-
[19]
V., Carlsson, M., Hansteen, V
Gudiksen, B. V., Carlsson, M., Hansteen, V. H., et al. 2011, A&A, 531, A154, doi: 10.1051/0004-6361/201116520
2011 doi
-
[20]
2019, A&A, 626, A33, doi: 10.1051/0004-6361/201935376
Hansteen, V., Ortiz, A., Archontis, V., et al. 2019, A&A, 626, A33, doi: 10.1051/0004-6361/201935376
2019 doi
-
[21]
H., Archontis, V., Pereira, T
Hansteen, V. H., Archontis, V., Pereira, T. M. D., et al. 2017, ApJ, 839, 22, doi: 10.3847/1538-4357/aa6844
2017 doi
-
[22]
Gallagher, P. T. 2020, ApJ, 895, 50, doi: 10.3847/1538-4357/ab8d40
2020 doi
-
[23]
2019, ApJ, 874, 146, doi: 10.3847/1538-4357/ab0c9d
Hong, J., Yang, J., Chen, H., et al. 2019, ApJ, 874, 146, doi: 10.3847/1538-4357/ab0c9d
2019 doi
-
[24]
2022, ApJ, 928, 153, doi: 10.3847/1538-4357/ac590c
Hong, Z., Wang, Y., & Ji, H. 2022, ApJ, 928, 153, doi: 10.3847/1538-4357/ac590c
2022 doi
-
[25]
2015, ApJL, 812, L30, doi: 10.1088/2041-8205/812/2/L30
Iijima, H., & Yokoyama, T. 2015, ApJL, 812, L30, doi: 10.1088/2041-8205/812/2/L30
2015 doi
-
[26]
E., Inhester, B., Axford, W
Innes, D. E., Inhester, B., Axford, W. I., & Wilhelm, K. 1997, Nature, 386, 811, doi: 10.1038/386811a0
1997 doi
-
[27]
2017, SoPh, 292, 152, doi: 10.1007/s11207-017-1176-2
Joshi, R., Schmieder, B., Chandra, R., et al. 2017, SoPh, 292, 152, doi: 10.1007/s11207-017-1176-2
2017 doi
-
[28]
A., Botha, G
Karampelas, K., McLaughlin, J. A., Botha, G. J. J., & R´ egnier, S. 2022a, ApJ, 925, 195, doi: 10.3847/1538-4357/ac3b53 —. 2022b, ApJ, 933, 142, doi: 10.3847/1538-4357/ac746a —. 2023, ApJ, 943, 131, doi: 10.3847/1538-4357/acac90
2023 doi
-
[29]
1994, Stellar Structure and Evolution
Kippenhahn, R., & Weigert, A. 1994, Stellar Structure and Evolution
1994
-
[30]
N., Kosovichev, A
Kitiashvili, I. N., Kosovichev, A. G., Lele, S. K., Mansour, N. N., & Wray, A. A. 2013, ApJ, 770, 37, doi: 10.1088/0004-637X/770/1/37
2013 doi
-
[31]
T., Yurchyshyn, V., DeVore, C
Kumar, P., Karpen, J. T., Yurchyshyn, V., DeVore, C. R., & Antiochos, S. K. 2024, ApJ, 973, 74, doi: 10.3847/1538-4357/ad63a2
2024 doi
-
[32]
E., Lukin, V
Leake, J. E., Lukin, V. S., & Linton, M. G. 2013, Physics of Plasmas, 20, 061202, doi: 10.1063/1.4811140
2013 doi
-
[33]
2020, ApJ, 893, 7, doi: 10.3847/1538-4357/ab7cd1
Li, D., Lu, L., Ning, Z., et al. 2020, ApJ, 893, 7, doi: 10.3847/1538-4357/ab7cd1
2020 doi
-
[34]
G., & Isenberg, P
Lin, J., Forbes, T. G., & Isenberg, P. A. 2001, J. Geophys. Res., 106, 25053, doi: 10.1029/2001JA000046
2001 doi
-
[35]
2023, Research in Astronomy and Astrophysics, 23, 035006, doi: 10.1088/1674-4527/acafc3
Liu, M., Ni, L., Cheng, G.-C., Ziegler, U., & Lin, J. 2023, Research in Astronomy and Astrophysics, 23, 035006, doi: 10.1088/1674-4527/acafc3
2023 doi
-
[36]
2001, ApJ, 549, 608, doi: 10.1086/319073 Mart´ ınez-Sykora, J., De Pontieu, B., Carlsson, M., et al
Magara, T. 2001, ApJ, 549, 608, doi: 10.1086/319073 Mart´ ınez-Sykora, J., De Pontieu, B., Carlsson, M., et al. 2017a, ApJ, 847, 36, doi: 10.3847/1538-4357/aa8866 Mart´ ınez-Sykora, J., De Pontieu, B., Hansteen, V. H., et al. 2017b, Science, 356, 1269, doi: 10.1126/science.aah5412
2001 doi
-
[37]
A., De Moortel, I., Hood, A
McLaughlin, J. A., De Moortel, I., Hood, A. W., & Brady, C. S. 2009, A&A, 493, 227, doi: 10.1051/0004-6361:200810465
2009 doi
-
[38]
A., Thurgood, J
McLaughlin, J. A., Thurgood, J. O., & MacTaggart, D. 2012a, A&A, 548, A98, doi: 10.1051/0004-6361/201220234
-
[39]
A., Verth, G., Fedun, V., & Erd´ elyi, R
McLaughlin, J. A., Verth, G., Fedun, V., & Erd´ elyi, R. 2012b, ApJ, 749, 30, doi: 10.1088/0004-637X/749/1/30
-
[40]
M., Del Zanna, G., & Mason, H
Mulay, S. M., Del Zanna, G., & Mason, H. 2017, A&A, 606, A4, doi: 10.1051/0004-6361/201730429
2017 doi
-
[41]
J., van Driel-Gesztelyi, L., & Baker, D
Murray, M. J., van Driel-Gesztelyi, L., & Baker, D. 2009, A&A, 494, 329, doi: 10.1051/0004-6361:200810406
2009 doi
-
[42]
2021, A&A, 646, A88, doi: 10.1051/0004-6361/202039239
Ni, L., Chen, Y., Peter, H., Tian, H., & Lin, J. 2021, A&A, 646, A88, doi: 10.1051/0004-6361/202039239
2021 doi
-
[43]
2022, A&A, 665, A116, doi: 10.1051/0004-6361/202243304
Ni, L., Cheng, G., & Lin, J. 2022, A&A, 665, A116, doi: 10.1051/0004-6361/202243304
2022 doi
-
[44]
2015, ApJ, 812, 92, doi: 10.1088/0004-637X/812/2/92
Ni, L., Lin, J., Mei, Z., & Li, Y. 2015, ApJ, 812, 92, doi: 10.1088/0004-637X/812/2/92
2015 doi
-
[45]
Ni, L., & Lukin, V. S. 2018, ApJ, 868, 144, doi: 10.3847/1538-4357/aaeb97
2018 doi
-
[46]
A., & Lin, J
Ni, L., Zhang, Q.-M., Murphy, N. A., & Lin, J. 2017, ApJ, 841, 27, doi: 10.3847/1538-4357/aa6ffe
2017 doi
-
[47]
2014, SoPh, 289, 1239, doi: 10.1007/s11207-013-0405-6
Ning, Z. 2014, SoPh, 289, 1239, doi: 10.1007/s11207-013-0405-6
2014 doi
-
[48]
2022, SoPh, 297, 2, doi: 10.1007/s11207-021-01935-w
Ning, Z., Wang, Y., Hong, Z., & Li, D. 2022, SoPh, 297, 2, doi: 10.1007/s11207-021-01935-w
2022 doi
-
[49]
D., Thompson, B
Pesnell, W. D., Thompson, B. J., & Chamberlin, P. C. 2012, SoPh, 275, 3, doi: 10.1007/s11207-011-9841-3
2012 doi
-
[50]
2014, Science, 346, 1255726, doi: 10.1126/science.1255726
Peter, H., Tian, H., Curdt, W., et al. 2014, Science, 346, 1255726, doi: 10.1126/science.1255726
2014 doi
-
[51]
J., & Iglesias, C
Rogers, F. J., & Iglesias, C. A. 1992, ApJS, 79, 507, doi: 10.1086/191659
1992 doi
-
[52]
Schiavo, L. A. C. A., Botha, G. J. J., & McLaughlin, J. A. 2024a, ApJ, 975, 10, doi: 10.3847/1538-4357/ad7600
-
[53]
Schiavo, L. A. C. A., Stewart, J., & Browning, P. K. 2024b, Physics of Plasmas, 31, 102903, doi: 10.1063/5.0226068
-
[54]
Shen, C., Lin, J., & Murphy, N. A. 2011, ApJ, 737, 14, doi: 10.1088/0004-637X/737/1/14
2011 doi
-
[55]
2007, Science, 318, 1591, doi: 10.1126/science.1146708
Shibata, K., Nakamura, T., Matsumoto, T., et al. 2007, Science, 318, 1591, doi: 10.1126/science.1146708
2007 doi
-
[56]
1962, Physics of Fully Ionized Gases
Spitzer, L. 1962, Physics of Fully Ionized Gases
1962
-
[57]
K., & Gordovskyy, M
Stewart, J., Browning, P. K., & Gordovskyy, M. 2022, MNRAS, 513, 5224, doi: 10.1093/mnras/stac1286
2022 doi
-
[58]
2023, ApJ, 944, 161, doi: 10.3847/1538-4357/acaa3e
Sun, X., Yan, X., Liang, H., et al. 2023, ApJ, 944, 161, doi: 10.3847/1538-4357/acaa3e
2023 doi
-
[59]
A., Botha, G
Talbot, J., McLaughlin, J. A., Botha, G. J. J., & Hancock, M. 2024, ApJ, 965, 133, doi: 10.3847/1538-4357/ad2a5d
2024 doi
-
[60]
O., Pontin, D
Thurgood, J. O., Pontin, D. I., & McLaughlin, J. A. 2017, ApJ, 844, 2, doi: 10.3847/1538-4357/aa79fa 14W ang et al. —. 2019, A&A, 621, A106, doi: 10.1051/0004-6361/201834369
2017 doi
-
[61]
2016, ApJ, 824, 96, doi: 10.3847/0004-637X/824/2/96
Tian, H., Xu, Z., He, J., & Madsen, C. 2016, ApJ, 824, 96, doi: 10.3847/0004-637X/824/2/96
2016 doi
-
[62]
Torrence, C., & Compo, G. P. 1998, Bulletin of the American Meteorological Society, 79, 61, doi: 10.1175/1520-0477(1998)079⟨0061: APGTWA⟩2.0.CO;2
1998 doi
-
[63]
2019, ApJL, 874, L27, doi: 10.3847/2041-8213/ab1135
Xue, Z., Yan, X., Jin, C., et al. 2019, ApJL, 874, L27, doi: 10.3847/2041-8213/ab1135
2019 doi
-
[64]
2020, ApJ, 897, 64, doi: 10.3847/1538-4357/ab93b5
Ye, J., Cai, Q., Shen, C., et al. 2020, ApJ, 897, 64, doi: 10.3847/1538-4357/ab93b5
2020 doi
-
[65]
R., Tian, H., Peter, H., et al
Young, P. R., Tian, H., Peter, H., et al. 2018, SSRv, 214, 120, doi: 10.1007/s11214-018-0551-0
2018 doi
-
[66]
M., Dai, J., Xu, Z., et al
Zhang, Q. M., Dai, J., Xu, Z., et al. 2020, A&A, 638, A32, doi: 10.1051/0004-6361/202038233
2020 doi
-
[67]
2008, Computer Physics Communications, 179, 227, doi: 10.1016/j.cpc.2008.02.017
Ziegler, U. 2008, Computer Physics Communications, 179, 227, doi: 10.1016/j.cpc.2008.02.017
2008 doi
-
[68]
V., McLaughlin, J
Zimovets, I. V., McLaughlin, J. A., Srivastava, A. K., et al. 2021, SSRv, 217, 66, doi: 10.1007/s11214-021-00840-9
2021 doi
Reviewed August 7, 2026 · model on record in the stance chip above.
Discussion (0). Sign in to comment.