REVIEW 4 major objections 7 minor 38 references
HLSAD: Hodge Laplacian-based Simplicial Anomaly Detection
T0 review · 4 major / 7 minor · reviewed 2026-08-07 · deepseek-v4-flash
Pith's one-line read HLSAD uses Hodge Laplacian spectra to detect anomalies in time-evolving simplicial complexes, outperforming graph-only baselines on higher-order and lifted data.
desk verdict A clean first step for anomaly detection on temporal simplicial complexes; higher-order spectra help in the tested regimes, but the evaluation has a metric muddle and an unprobed localized-anomaly blind spot. read the letter →
The pith
A machine-rendered reading of the paper's core claim, the machinery that carries it, and where it could break.
The reading
What carries the argument
The load-bearing object is the spectrum of the combinatorial Hodge Laplacians $\mathbf{L}_k$, whose kernel has dimension equal to the $k$-th Betti number, so the spectrum encodes topological features such as components, cycles, and higher holes. The key trick is to look at both components of each Laplacian: the down-Laplacian $\mathbf{B}_k^\top\mathbf{B}_k$ records how $k$-simplices decompose into $(k-1)$-simplices, while the up-Laplacian $\mathbf{B}_{k+1}\mathbf{B}_{k+1}^\top$ records how they combine into $(k+1)$-simplices. Singular values are invariant under reordering of vertices and simplices, so the feature vector works without node alignment, and truncated SVD on sparse Laplacians keeps the cost at $O(T \sum_{k=0}^{K} n_k^2 \log \ell)$ with randomized SVD.
What would settle it
Construct a synthetic sequence in which the only anomaly is a small, localized rewiring — say, moving a single triangle from one community to another in a 500-node stochastic block model — so that the top few singular values of $\mathbf{L}_0,\mathbf{L}_1,\mathbf{L}_2$ change by less than numerical noise. If HLSAD's score never exceeds a threshold calibrated on the normal segment for that snapshot, then the top-$\ell$ singular-value fingerprint is not sufficient for the general sensitivity the paper claims.
Extended reading notes
Core claim
Formally, HLSAD computes the combinatorial Hodge Laplacians $\mathbf{L}_k = \mathbf{B}_k^\top\mathbf{B}_k + \mathbf{B}_{k+1}\mathbf{B}_{k+1}^\top$ for ranks $0$ through $K$ at each time step, extracts the $\ell$ largest singular values from each (padding with zeros when the complex is thin), and concatenates them into a feature vector $\boldsymbol{\sigma}^{(t)}$. A context window of past snapshots is summarized by the leading left singular vector of the matrix of their normalized spectra, and the current snapshot is scored by its angular distance to the short-term and long-term typical spectra. The final anomaly score is the maximum of the two deviations, with isolated high scores classified as events and persistent elevations as change points. The central claim is that this higher-order spectral fingerprint detects anomalies that graph-only spectral methods miss, and that on clique-lifted dyadic data it reaches comparable accuracy with fewer singular values, hence lower cost.
Load-bearing premise
The method assumes that the top $\ell$ singular values of the first $K$ Hodge Laplacians form a complete fingerprint, so that every meaningful structural anomaly changes at least one of these values enough to move the angular score.
Editorial extensions
If this is right
- An anomaly that changes only triangle-level structure, with no edge-level change, still moves the score because the rank-2 Hodge Laplacian spectrum is part of the feature vector.
- On dyadic data, lifting the graph to its clique complex before scoring yields higher Hits@N with fewer singular values, so the higher-order representation is more accurate and cheaper per unit of accuracy.
- Because the score takes the maximum of short- and long-window deviations, isolated spikes are classified as events while sustained elevations are classified as change points, without fitting a second model.
- The method needs no node alignment and no fixed node count, so it applies to growing networks and to datasets where simplex identities cannot be tracked across time.
- On the tested real datasets, the method reaches perfect Hits@10 on the UCI messages data and Hits@2 on the Senate co-sponsorship data, and on the Reality Mining data it matches the model-based baseline's precision at zero delay while exceeding its recall.
Reading between the lines
- A stress test the paper does not run is a localized anomaly that leaves the top-$\ell$ singular values nearly unchanged; if that score stays below threshold, detection sensitivity is bounded by the spectral gap rather than by structural change.
- Because the down-Laplacian at rank $k+1$ records how $(k+1)$-simplices attach to $k$-simplices, HLSAD could in principle flag the onset of higher-order community formation before it is visible in the graph skeleton; this is an untested extrapolation.
- The concatenated up/down singular values form a general simplicial-temporal feature vector that could be fed to any downstream classifier or change-point model, turning HLSAD into a feature extractor rather than a standalone detector.
Editorial analysis
A structured set of objections, weighed in public.
Referee Report
Summary. The paper proposes HLSAD, a method for anomaly detection in temporal sequences of simplicial complexes. For each snapshot, HLSAD computes Hodge Laplacians up to a user-specified rank K, extracts the ℓ largest singular values from the up- and down-Laplacian components, concatenates and ℓ2-normalizes them into a feature vector, and assigns an anomaly score via the angular distance between the current vector and characteristic vectors computed from short- and long-term sliding windows. The method is evaluated on four synthetic settings (hybrid, resampled, large, triangle-closing) and three real-world datasets (UCI messages, Senate co-sponsorship, MIT Reality Mining), with comparisons to LAD, EdgeMonitoring, Activity Vector, TENSORSPLAT, and LetoChange. The paper claims to present the first methodology for anomaly detection in temporal sequences of simplicial complexes and reports that the simplicial representation yields improved accuracy and efficiency over graph-only baselines.
Significance. If the claims are established, the paper fills a genuine gap by extending spectral graph anomaly-detection methods to higher-order simplicial structures, and it provides a public implementation. The experimental results suggest that Hodge-Laplacian spectra can be more discriminative than graph spectra in settings where group interactions carry the signal, and the method inherits desirable properties such as permutation invariance and tolerance to varying node sets. However, the evaluation has serious weaknesses: the Hits@N metric is used inconsistently, no replicate runs or error bars are reported, hyperparameters appear to be selected per dataset without a validation protocol, and the sensitivity to localized anomalies is never tested. These issues currently preclude accepting the paper's broad claims.
major comments (4)
- [Section 6, first paragraph; Figure 4 caption; Table 1] The Hits@N metric is defined as the proportion of the top-N detected points that are true anomalies (i.e., precision@N), and the text notes that when N equals the number of ground-truth anomalies, Hits@N equals recall. Under this definition, the reported Hits@10 = 1.0 for the UCI dataset, which has only two labeled events, is impossible (the top-10 list cannot consist entirely of true anomalies when only two exist). Likewise, the Figure 4 caption describes the dashed line as 'Hits@N+2 ... accuracy with up to 2 false positives,' which is a recall-style interpretation and cannot reach 1.0 under the precision definition. The paper must clarify whether Hits@N is precision@N, recall@N, or a binary 'all anomalies in top N' success indicator, and all reported values and captions must be made consistent with that choice. This is load-bearing because every quantitative comparison in the paper rests on this metric.
- [Section 6.1 and Figure 4] No replicate runs, random seeds, or error bars are reported for any synthetic or real-world experiment. The datasets generated from the stochastic block model and the triangle-closing process are stochastic, and the real-world ground-truth event lists are fixed, yet all plots and tables appear to reflect a single run. In the resampled setting, for example, the paper states that LAD reaches Hits@7 = 0.8 with 250 singular values while HLSAD requires about 320 singular values; without multiple trials it is impossible to know whether this difference is meaningful. The authors should report means and standard deviations over multiple random seeds, or justify why a single run suffices.
- [Sections 5.2, 6.2, 6.3, and Appendix C] The method has several free parameters (maximum rank K, number of singular values ℓ, short and long window sizes w_s and w_l, anomaly threshold τ or number of top detections k, and the choice of up versus down Laplacian components). The paper does not describe a validation protocol for selecting these parameters. Section 6.3 reports Senate results 'using only the top 6 singular values,' Section 6.2 fixes UCI windows 'following the arguments outlined in previous works,' and Appendix C shows that performance varies substantially with window size and states that 'the context window sizes can have significant influence on the performance of HLSAD' and that one should 'fine-tune the context window size specifically for the dataset at hand.' This suggests that parameters may have been chosen on the labeled test data, which would make the reported superiority circular. Please specify exactly how each parameter was selected, ideally through a training/validation split, and provide a sensitivity analysis over the parameter ranges.
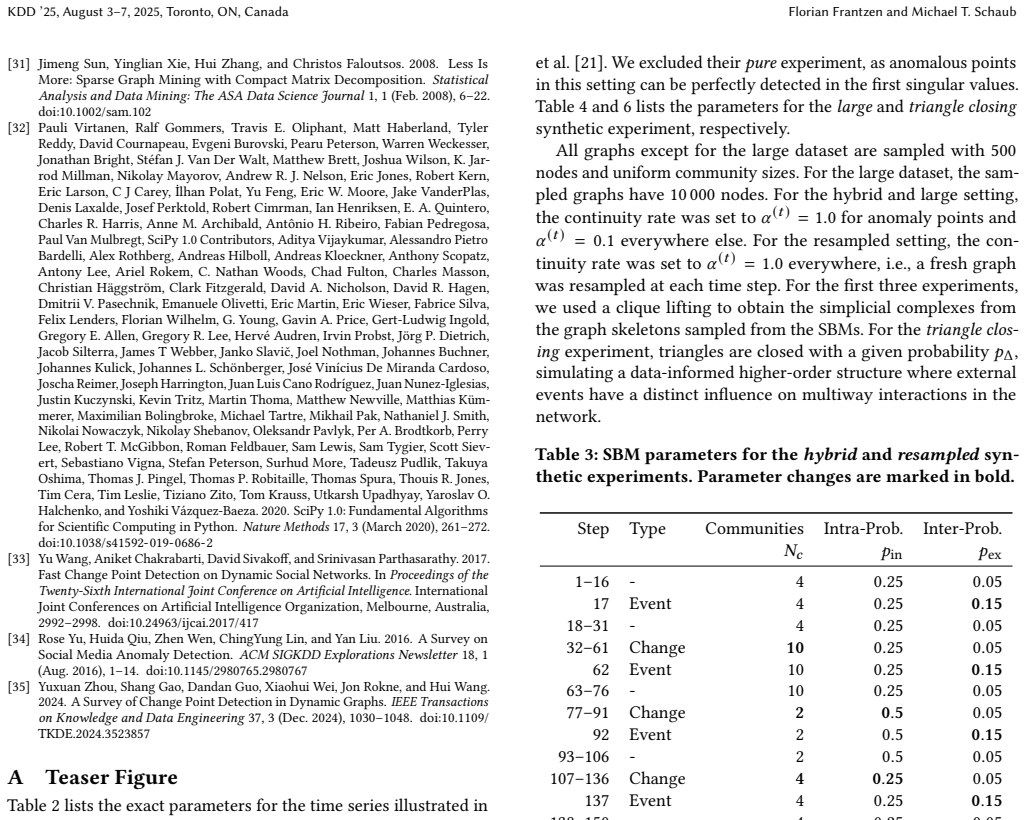
- [Section 6.1 and Section 5.4] The evaluation probes only collective or global anomalies. All synthetic injections in Tables 3, 4, and 6 are SBM probability shifts or triangle-closing probability changes affecting hundreds or thousands of simplices simultaneously, and the real-world ground-truth events are large-scale collective changes. No experiment perturbs a single simplex or a small local cluster. The feature vector consists of the ℓ largest singular values of the Hodge Laplacians, which by Weyl's inequality are Lipschitz in the perturbation; a small-rank, small-norm perturbation may be invisible to the top-ℓ spectrum, especially after ℓ2-normalization and angular-distance scoring. The paper should either restrict its claims to collective events and change points or add a synthetic experiment with localized anomalies (e.g., adding or deleting a single edge, triangle, or small cluster) to demonstrate that the method actually detects the localized regime that the title and framing imply.
minor comments (7)
- [Section 3] The definition of rank k_max as 'max{|S^k| | S^k ∈ X}' uses the cardinality of the largest simplex rather than its dimension; the equation should be k_max = max(|S^k| - 1).
- [Table 1 and Section 2] The baseline is spelled 'TENSORPLAT' in Table 1 but 'TENSORSPLAT' in the text; please use a consistent spelling.
- [Appendix C] The word 'infered' should be 'inferred'.
- [Table 4] In the row for step 92, the inter-community probability is listed as '0.00755', which appears to be a typo for '0.0075'.
- [Section 5.5, Eq. (8)] The complexity expression O(T * sum_k n_k^2 log ℓ) should define n_k explicitly as the number of k-simplices and should clarify whether sparsity is exploited; the preceding sentence gives an O(n^2 log ℓ) bound for dense matrices, which is not the same as a sparse SVD cost.
- [Section 7] The abstract and conclusion claim 'enhanced computational efficiency,' but no wall-clock timing comparison is reported; the efficiency argument relies only on the number of singular values needed, so please add a direct runtime comparison or soften the claim.
- [KDD Availability Link and Section 6] The availability link already lists a public URL, while the text in Appendix B says the code 'will be made publicly available with the camera-ready version'; please align these statements.
Circularity Check
No significant circularity: HLSAD is an unsupervised spectral scoring method whose evaluation is anchored to external baselines and external ground-truth events.
full rationale
I find no load-bearing circular step in the paper's derivation chain. The method is explicitly built on prior graph-based spectral anomaly detection: HLSAD computes Hodge Laplacians, extracts the top singular values, and scores each snapshot by angular distance from sliding-window average spectra (Eqs. 3-7). No parameter is fitted to labeled anomalies and then renamed as a prediction; the anomaly score is computed directly from the current and past unlabeled snapshots. The problem statement defines events and change points in terms of an anomaly scoring function f, and HLSAD implements f; this is the formal task of anomaly detection, not a hidden equivalence between input and output. The choice of spectral features is motivated by standard facts (Betti numbers via the Hodge Laplacian kernel, Eckmann [9]; optimal low-rank approximation, Eckart-Young [8]), neither of which is imported from the authors' own prior work. The only self-citation is to TopoX [15], used as an implementation library for topological computations; it does not justify the method's central claim and is not load-bearing. The real-data evaluation is compared against LAD, EdgeMonitoring, Activity Vector, TENSORSPLAT, and LetoChange, i.e., external baselines, and ground truth comes from external events (UCI term boundaries, Senate cooperation anomalies, MIT Reality Mining events). The concern that hyperparameters (number of singular values, window sizes) may be selected with knowledge of test labels is a legitimate evaluation-validity caveat, but it is not a circularity of the kind defined here: no equation reduces to its own input, and no fitted parameter is presented as an independent prediction. The skeptical attack about localized anomalies is a coverage gap in the experimental evidence, not an internal circularity in the derivation. Overall, the central claim is supported by independent empirical comparison rather than by self-citation or definitional maneuvering.
Assumptions & free parameters
free parameters (5)
- Maximum Hodge Laplacian rank K =
K = 0, 1, 2 in synthetic experiments; per-dataset in real experiments
- Number of singular values per Laplacian ℓ =
e.g., 6 for Senate, 10 for triangle closing, 40 for hybrid
- Short and long context window sizes w_s, w_l =
5/10 synthetic, 7/14 UCI, not fully specified for others
- Anomaly threshold τ or number of top detections k =
Not reported in detail
- Selection of up vs down Laplacian components =
Not reported per dataset
assumptions (6)
- standard math Hodge Laplacian spectrum properties: kernel dimension equals Betti numbers (Eckmann's theorem)
- standard math Eckart-Young theorem on optimal low-rank approximation
- domain assumption Clique lifting: triangles and higher simplices represent meaningful higher-order interactions
- domain assumption Continuity rate model for generating temporal simplicial complexes
- ad hoc to paper Angular distance between normalized spectral vectors is a valid anomaly score
- ad hoc to paper Taking the maximum of short-term and long-term deviations yields the final score
Cite this review
Pith. "Pith review of HLSAD: Hodge Laplacian-based Simplicial Anomaly Detection." pith.science (2026). https://pith.science/paper/M2RJYELD
@misc{pith2026250524534,
  author       = {Pith},
  title        = {Pith review of: HLSAD: Hodge Laplacian-based Simplicial Anomaly Detection},
  year         = {2026},
  howpublished = {\url{https://pith.science/paper/M2RJYELD}},
  note         = {Machine review of arXiv:2505.24534}
}
read the original abstract
In this paper, we propose HLSAD, a novel method for detecting anomalies in time-evolving simplicial complexes. While traditional graph anomaly detection techniques have been extensively studied, they often fail to capture changes in higher-order interactions that are crucial for identifying complex structural anomalies. These higher-order interactions can arise either directly from the underlying data itself or through graph lifting techniques. Our approach leverages the spectral properties of Hodge Laplacians of simplicial complexes to effectively model multi-way interactions among data points. By incorporating higher-dimensional simplicial structures into our method, our method enhances both detection accuracy and computational efficiency. Through comprehensive experiments on both synthetic and real-world datasets, we demonstrate that our approach outperforms existing graph methods in detecting both events and change points.
Figures


Figures from the paper (4 more)



Reference graph
Works this paper leans on
-
[1]
Leman Akoglu and Christos Faloutsos. 2010. Event Detection in Time Series of Mobile Communication Graphs. In Army Science Conference, Vol. 1. 141
work page 2010
-
[2]
Leman Akoglu, Hanghang Tong, and Danai Koutra. 2015. Graph Based Anomaly Detection and Description: A Survey. Data Mining and Knowledge Discovery 29, 3 (May 2015), 626–688. doi:10.1007/s10618-014-0365-y
-
[3]
Cristian Bodnar, Fabrizio Frasca, Yuguang Wang, Nina Otter, Guido F Montufar, Pietro Lió, and Michael Bronstein. 2021. Weisfeiler and Lehman Go Topological: Message Passing Simplicial Networks. In Proceedings of the 38th International Conference on Machine Learning . 1026–1037
work page 2021
-
[4]
Glen E. Bredon. 1993. Topology and Geometry. Springer-Verlag, New York
work page 1993
-
[5]
Haibin Cheng, Pang-Ning Tan, Christopher Potter, and Steven Klooster. 2008. A Robust Graph-Based Algorithm for Detection and Characterization of Anomalies in Noisy Multivariate Time Series. In 2008 IEEE International Conference on Data Mining Workshops. IEEE, Pisa, Italy, 349–358. doi:10.1109/ICDMW.2008.48
-
[6]
Qi Ding, Natallia Katenka, Paul Barford, Eric Kolaczyk, and Mark Crovella. 2012. Intrusion as (aAnti)Social Communication: Characterization and Detection. In Proceedings of the 18th ACM SIGKDD International Conference on Knowledge Discovery and Data Mining . ACM, Beijing China, 886–894. doi:10.1145/2339530. 2339670
doi:10.1145/2339530 2012
-
[7]
Nathan Eagle and Alex (Sandy) Pentland. 2006. Reality Mining: Sensing Complex Social Systems. Personal and Ubiquitous Computing 10, 4 (May 2006), 255–268. doi:10.1007/s00779-005-0046-3
-
[8]
Carl Eckart and Gale Young. 1936. The Approximation of One Matrix by Another of Lower Rank. Psychometrika 1, 3 (Sept. 1936), 211–218. doi:10.1007/BF02288367
Show all 38 references
-
[9]
Beno Eckmann. 1944. Harmonische Funktionen und Randwertaufgaben in einem Komplex. Commentarii Mathematici Helvetici 17, 1 (Dec. 1944), 240–255. doi:10. 1007/BF02566245
1944
-
[10]
James H. Fowler. 2006. Connecting the Congress: A Study of Cosponsorship Networks. Political Analysis 14, 4 (2006), 456–487. doi:10.1093/pan/mpl002
2006 doi
-
[11]
James H. Fowler. 2006. Legislative Cosponsorship Networks in the US House and Senate. Social Networks 28, 4 (Oct. 2006), 454–465. doi:10.1016/j.socnet.2005.11.003
2006 doi
-
[12]
Mostafa Reisi Gahrooei and Kamran Paynabar. 2018. Change Detection in a Dynamic Stream of Attributed Networks. Journal of Quality Technology 50, 4 (Oct. 2018), 418–430. doi:10.1080/00224065.2018.1507558
2018
-
[13]
Yongshun Gong, Xue Dong, Jian Zhang, and Meng Chen. 2023. Latent Evolution Model for Change Point Detection in Time-Varying Networks. Information Sciences 646 (Oct. 2023), 119376. doi:10.1016/j.ins.2023.119376
2023
-
[14]
Nicola Guglielmi, Anton Savostianov, and Francesco Tudisco. 2023. Quantifying the Structural Stability of Simplicial Homology. Journal of Scientific Computing 97, 1 (Oct. 2023), 2. doi:10.1007/s10915-023-02314-2
2023 doi
-
[15]
Samaga, Simone Scardapane, Michael T
Mustafa Hajij, Mathilde Papillon, Florian Frantzen, Jens Agerberg, Ibrahem Al- Jabea, Rubén Ballester, Claudio Battiloro, Guillermo Bernárdez, Tolga Birdal, Aiden Brent, Peter Chin, Sergio Escalera, Simone Fiorellino, Odin Hoff Gar- daa, Gurusankar Gopalakrishnan, Devendra Gov...
2024
-
[16]
Halko, P
N. Halko, P. G. Martinsson, and J. A. Tropp. 2011. Finding Structure with Ran- domness: Probabilistic Algorithms for Constructing Approximate Matrix Decom- positions. SIAM Rev. 53, 2 (Jan. 2011), 217–288. doi:10.1137/090771806
2011 doi
-
[17]
Allen Hatcher. 2002. Algebraic Topology. Cambridge University Press
2002
- [18]
-
[19]
Shenyang Huang, Samy Coulombe, Yasmeen Hitti, Reihaneh Rabbany, and Guil- laume Rabusseau. 2024. Laplacian Change Point Detection for Single and Multi- view Dynamic Graphs. ACM Transactions on Knowledge Discovery from Data 18, 3 (April 2024), 1–32. doi:10.1145/3631609
2024 doi
-
[20]
Shenyang Huang, Jacob Danovitch, Guillaume Rabusseau, and Reihaneh Rabbany
-
[21]
Shenyang Huang, Yasmeen Hitti, Guillaume Rabusseau, and Reihaneh Rabbany
-
[22]
Tsuyoshi Idé and Hisashi Kashima. 2004. Eigenspace-Based Anomaly Detection in Computer Systems. In Proceedings of the Tenth ACM SIGKDD International Conference on Knowledge Discovery and Data Mining . ACM, Seattle WA USA, 440–449. doi:10.1145/1014052.1014102
2004
-
[23]
Papalexakis, and Christos Faloutsos
Danai Koutra, Evangelos E. Papalexakis, and Christos Faloutsos. 2012. Tensor- Splat: Spotting Latent Anomalies in Time. In 2012 16th Panhellenic Conference on Informatics. IEEE, Piraeus, Greece, 144–149. doi:10.1109/PCi.2012.60
2012 doi
-
[24]
Vogelstein, Brian Gallagher, and Christos Faloutsos
Danai Koutra, Neil Shah, Joshua T. Vogelstein, Brian Gallagher, and Christos Faloutsos. 2016. DeltaCon: Principled Massive-Graph Similarity Function with Attribution. ACM Transactions on Knowledge Discovery from Data 10, 3 (Feb. 2016), 1–43. doi:10.1145/2824443
2016 doi
-
[25]
Hall, Christo- pher H
Felix Mölder, Kim Philipp Jablonski, Brice Letcher, Michael B. Hall, Christo- pher H. Tomkins-Tinch, Vanessa Sochat, Jan Forster, Soohyun Lee, Sven O. Twardziok, Alexander Kanitz, Andreas Wilm, Manuel Holtgrewe, Sven Rah- mann, Sven Nahnsen, and Johannes Köster. 2021. Sustaina...
2021 doi
-
[26]
Pietro Panzarasa, Tore Opsahl, and Kathleen M. Carley. 2009. Patterns and Dynamics of Users’ Behavior and Interaction: Network Analysis of an Online Community. Journal of the American Society for Information Science and Technol- ogy 60, 5 (May 2009), 911–932. doi:10.1002/asi.21015
2009 doi
-
[27]
Leto Peel and Aaron Clauset. 2015. Detecting Change Points in the Large-Scale Structure of Evolving Networks. InProceedings of the AAAI Conference on Artificial Intelligence, Vol. 29. doi:10.1609/aaai.v29i1.9574
2015 doi
-
[28]
Caspar A. S. Pouw, Federico Toschi, Frank Van Schadewijk, and Alessandro Corbetta. 2020. Monitoring Physical Distancing for Crowd Management: Real- time Trajectory and Group Analysis. PLOS ONE 15, 10 (Oct. 2020), e0240963. doi:10.1371/journal.pone.0240963
2020 doi
-
[29]
Samatova
Stephen Ranshous, Shitian Shen, Danai Koutra, Steve Harenberg, Christos Faloutsos, and Nagiza F. Samatova. 2015. Anomaly Detection in Dynamic Net- works: A Survey. WIREs Computational Statistics 7, 3 (May 2015), 223–247. doi:10.1002/wics.1347
2015 doi
-
[30]
Déborah Sulem, Henry Kenlay, Mihai Cucuringu, and Xiaowen Dong. 2024. Graph Similarity Learning for Change-Point Detection in Dynamic Networks. Machine Learning 113, 1 (Jan. 2024), 1–44. doi:10.1007/s10994-023-06405-x KDD ’25, August 3–7, 2025, Toronto, ON, Canada Florian Fran...
2024 doi
-
[31]
Jimeng Sun, Yinglian Xie, Hui Zhang, and Christos Faloutsos. 2008. Less Is More: Sparse Graph Mining with Compact Matrix Decomposition. Statistical Analysis and Data Mining: The ASA Data Science Journal 1, 1 (Feb. 2008), 6–22. doi:10.1002/sam.102
2008 doi
-
[32]
Oliphant, Matt Haberland, Tyler Reddy, David Cournapeau, Evgeni Burovski, Pearu Peterson, Warren Weckesser, Jonathan Bright, Stéfan J
Pauli Virtanen, Ralf Gommers, Travis E. Oliphant, Matt Haberland, Tyler Reddy, David Cournapeau, Evgeni Burovski, Pearu Peterson, Warren Weckesser, Jonathan Bright, Stéfan J. Van Der Walt, Matthew Brett, Joshua Wilson, K. Jar- rod Millman, Nikolay Mayorov, Andrew R. J. Nelson,...
2020
-
[33]
Yu Wang, Aniket Chakrabarti, David Sivakoff, and Srinivasan Parthasarathy. 2017. Fast Change Point Detection on Dynamic Social Networks. In Proceedings of the Twenty-Sixth International Joint Conference on Artificial Intelligence. International Joint Conferences on Artificial ...
2017 doi
-
[34]
Rose Yu, Huida Qiu, Zhen Wen, ChingYung Lin, and Yan Liu. 2016. A Survey on Social Media Anomaly Detection. ACM SIGKDD Explorations Newsletter 18, 1 (Aug. 2016), 1–14. doi:10.1145/2980765.2980767
2016
-
[35]
Yuxuan Zhou, Shang Gao, Dandan Guo, Xiaohui Wei, Jon Rokne, and Hui Wang
-
[2020]
In Proceedings of the 26th ACM SIGKDD International Conference on Knowledge Discovery & Data Mining
Laplacian Change Point Detection for Dynamic Graphs. In Proceedings of the 26th ACM SIGKDD International Conference on Knowledge Discovery & Data Mining. ACM, Virtual Event CA USA, 349–358. doi:10.1145/3394486.3403077
-
[2023]
In Advances in Knowledge Discovery and Data Mining , Hisashi Kashima, Tsuyoshi Ide, and Wen-Chih Peng (Eds.)
Fast and Attributed Change Detection on Dynamic Graphs with Density of States. In Advances in Knowledge Discovery and Data Mining , Hisashi Kashima, Tsuyoshi Ide, and Wen-Chih Peng (Eds.). Vol. 13935. Springer Nature Switzerland, Cham, 15–26. doi:10.1007/978-3-031-33374-3_2
-
[2024]
IEEE Transactions on Knowledge and Data Engineering 37, 3 (Dec
A Survey of Change Point Detection in Dynamic Graphs. IEEE Transactions on Knowledge and Data Engineering 37, 3 (Dec. 2024), 1030–1048. doi:10.1109/ TKDE.2024.3523857 A Teaser Figure Table 2 lists the exact parameters for the time series illustrated in Figure 1. Graph skeleton...
2024
Reviewed August 7, 2026 · model on record in the stance chip above.
Discussion (0). Sign in to comment.