REVIEW 3 major objections 5 minor 27 references
Decoding the Stressed Brain with Geometric Machine Learning
T0 review · 3 major / 5 minor · reviewed 2026-08-07 · deepseek-v4-flash
Pith's one-line read This paper claims that a spatio-temporal graph convolutional network on a hybrid structural-functional EEG graph detects stress from raw recordings better than MLP, LSTM, and Transformer baselines, gaining 8 accuracy points and 7 F1…
desk verdict The ST-GCN on raw EEG is a reasonable idea, but the reported gain over baselines is not credible: the evaluation leaks subject identity and the accuracy sits below the 75% majority-class baseline. read the letter →
The pith
A machine-rendered reading of the paper's core claim, the machinery that carries it, and where it could break.
The reading
What carries the argument
The load-bearing object is the hybrid adjacency matrix $A=(A_{\mathrm{struct}}+A_{\mathrm{func}})/2$. $A_{\mathrm{struct}}$ marks each electrode's $k=2$ nearest neighbours with inverse-Euclidean-distance weights, giving the graph its anatomical skeleton; $A_{\mathrm{func}}$ is the indicator that the Pearson correlation between two raw 3200-step signals exceeds $\tau=0.5$, giving the graph its functional connections. A time-distributed 1D convolution with ReLU and global average pooling first produces per-electrode features, and one graph-convolution layer using the symmetric normalized adjacency with self-loops propagates those features across $A$; a final global pooling and dense sigmoid head make the binary prediction. The fusion is what carries the argument: it turns a set of independent time series into a spatial object whose nodes are named electrodes, which is also what makes the channel- and region-level ablation studies meaningful.
What would settle it
Re-run the same model comparison with a subject-disjoint split (for example, assign all twelve trials of each subject to the same fold) and check whether the ST-GCN's 8-point accuracy advantage over the Transformer survives; if it does not, the reported gain is explained by subject leakage rather than by graph-based stress detection.
Extended reading notes
Core claim
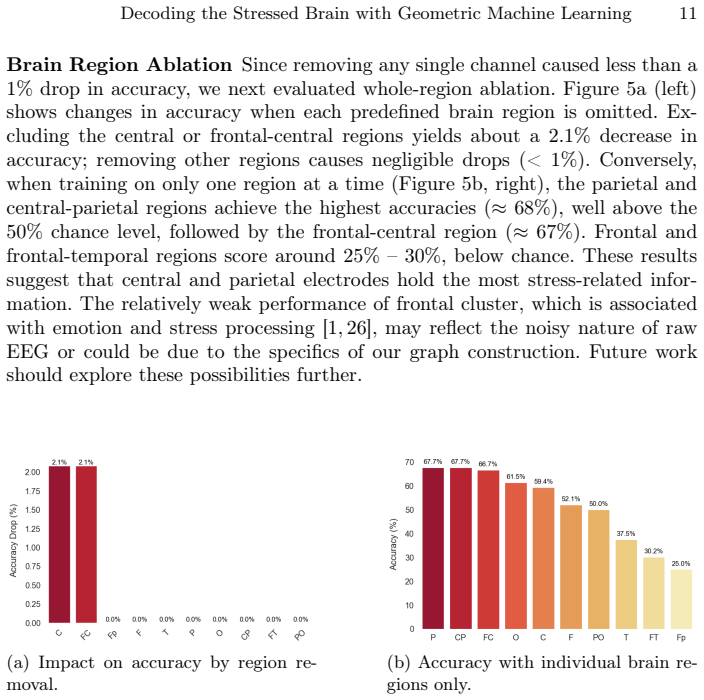
The central claim is that the hybrid adjacency $A=(A_{\mathrm{struct}}+A_{\mathrm{func}})/2$ — an element-wise average of an inverse-distance $k$-nearest-neighbour matrix ($k=2$) and a thresholded Pearson-correlation matrix ($\tau=0.5$) over the 32 electrodes — gives a graph convolution the right geometry to separate stressed from relaxed EEG. Feeding this graph into a single-layer GCN after per-electrode temporal convolution yields a mean accuracy of $69.06\% \pm 8.27$, F1 of $78.08\% \pm 8.99$, and AUC-ROC of $0.67$ across ten runs on SAM-40, against $61.25\%$, $71.04\%$, and $0.54$ for the best baseline, the Transformer. The paper frames the result as the first ST-GCN for stress detection on raw, unfiltered EEG and supports it with sensitivity analyses over graph-construction parameters, plus ablations showing no single electrode suffices while central and parietal regions and early/mid trial segments carry most of the signal.
Load-bearing premise
The evaluation assumes that the stratified random split of 480 trials never mixes trials from the same subject into both training and test; if a subject appears on both sides, the model can memorize that person's EEG signature rather than learning stress in general.
Editorial extensions
If this is right
- If the reported comparison holds, stress classification from raw EEG improves by 8 accuracy points and 7 F1 points over a Transformer baseline without band-pass filtering or manual spectral features.
- Because the graph nodes are standard 10-20 electrodes, the same trained model can be interrogated channel by channel and region by region, turning a classifier into a source of hypotheses about where stress appears in the scalp signal.
- The stability under graph-construction choices (accuracy varies by less than 6% across $k \in \{2,3,4\}$ and $\tau \in \{0.4,0.5,0.6\}$) suggests the method does not depend on a finely tuned adjacency.
- The temporal ablations imply that the first half of a 25-second trial carries most of the discriminative signal, which matters for any real-time stress monitoring use.
Reading between the lines
- If the model's advantage survives a subject-disjoint evaluation split, the hybrid structural-functional graph is likely a transferable inductive bias: the same construction should apply to other EEG affective states such as emotion, workload, or fatigue, and to other electrode montages, simply by recomputing the adjacency from electrode positions.
- The frontal-lobe anomaly the paper reports — frontal regions scoring below chance despite prior literature — could be tested directly by ablating the functional edge threshold: a pure correlation graph may preserve frontal information that the distance-weighted average dilutes.
- The early-segment result suggests a testable extension: training on the first ten seconds or so of each trial might match full-trial accuracy, enabling faster stress screening and wearable deployment.
- A control graph with randomly rewired or fully connected edges would isolate whether the gain comes from the specific electrode geometry or from the extra capacity and regularization of the graph convolution itself.
Editorial analysis
A structured set of objections, weighed in public.
Referee Report
Summary. The paper proposes a spatio-temporal graph convolutional network (ST-GCN) for binary stress classification from raw EEG on the SAM-40 dataset. Each trial is converted into a graph by averaging a structural adjacency (inverse inter-electrode distance with k-nearest neighbors) and a functional adjacency (thresholded Pearson correlations), and the resulting graphs are processed by a temporal Conv1D stage followed by one GCN layer. The authors report that ST-GCN outperforms MLP, LSTM, and Transformer baselines by about 8 accuracy points and 7 F1 points, and they include ablation studies of channels, brain regions, and time segments. The main empirical claim is that integrating electrode geometry with temporal processing improves stress detection on raw EEG.
Significance. If the central claim were supported, the work would be a useful demonstration that geometric deep learning can exploit EEG electrode structure for stress classification, and the ablation studies could offer interpretability insights. The graph-construction method and model architecture are clearly described and easy to reproduce in principle. However, the evaluation as presented does not support the claim: the split protocol is not subject-independent, the reported accuracy is below the trivial majority-class baseline, and the hyperparameter sensitivity analysis appears to select parameters on the test set. These are load-bearing flaws that invalidate the headline comparison, so the current manuscript does not meet the bar for publication. A corrected subject-independent evaluation with proper baselines would be needed before the contribution can be assessed.
major comments (3)
- [§4.3, Table 3] The evaluation protocol is described only as 'stratified random sampling' with a 10% validation split and no subject-level grouping. SAM-40 contains 40 subjects with 12 trials each, so a random trial-level split places trials from the same subject in both training and test with high probability. The model can then memorize individual EEG signatures rather than learn stress-related structure, and the reported 8-point accuracy and 7-point F1 improvements over the Transformer are not evidence of stress detection. The authors must re-evaluate with a subject-independent protocol such as leave-one-subject-out or subject-stratified grouping and report performance per subject.
- [§5, Table 3] With 360 stressed and 120 relaxed trials, a trivial always-stressed classifier achieves 75% accuracy and 85.7% F1. The reported ST-GCN accuracy (69.06%) and F1 score (78.08%) are below these trivial baselines, and the MLP, LSTM, and Transformer baselines are even lower. The paper does not report a majority-class baseline, so the claim that ST-GCN 'outperforms' the baselines is not meaningful for stress detection. The authors should report balanced accuracy, Matthews correlation coefficient, confusion matrices, and comparisons against the majority-class and chance baselines, or use class-balanced training/evaluation.
- [§3.1, Tables 2 and 3] Table 2 reports 78% accuracy for the chosen configuration k=2, tau=0.5 with a fixed random seed, while Table 3 reports 69.06% ± 8.27 mean accuracy for the same configuration. This discrepancy is unexplained and suggests protocol instability. Moreover, Table 2 is used to select k and tau by comparing test accuracy across nine configurations, which is test-set tuning and inflates the reported effect size. Hyperparameters should be selected on a validation fold, and the selection procedure should be described explicitly.
minor comments (5)
- [§4.1] There are formatting typos such as 'seperate' and missing spaces in 'wegroupedtherelaxationtrialsintoa'.
- [Table 1] The reported average shortest path of 0.55 is impossible for a connected graph with 32 nodes and k=2 nearest neighbors; the minimum possible average shortest path is 1. This suggests the metric is mislabeled or incorrectly computed.
- [§5.1] The single-channel ablation reports accuracies of 25–27%, which are below the 50% chance level for binary classification. The text interprets this as meaning no single electrode suffices, but anti-chance performance is not explained and may indicate an implementation issue in the ablation setup.
- [§6] The conclusion acknowledges the single-dataset limitation and the frontal-lobe anomaly, but it does not acknowledge the more serious evaluation-protocol issues of subject leakage, test-set hyperparameter selection, or below-majority accuracy, which should be addressed before any performance claims are made.
- [§4.3] No code repository, data availability statement, or full hyperparameter details for the baseline models are provided; these would be needed for reproducibility.
Circularity Check
Headline accuracy gain is partly a test-set-tuning artifact: k and tau are selected on the same test accuracy that is then reported as the model's performance.
-
fitted input called prediction
[Section 3.1 (Table 2) and Section 5 (Table 3)]
"To evaluate the impact of these parameters on classification performance, we performed a sensitivity analysis by varying k∈2,3,4 and threshold τ∈0.4,0.5,0.6 in graph construction and recorded the accuracy of the ST-GCN model with such settings and a fixed random seed. The results are demonstrated in Table 2. The resulting changes in model accuracy were not large (less than 6% variation), suggesting that the ST-GCN is robust to moderate changes in the graph construction process."
Table 3 then reports the accuracy of this configuration (69.06%±8.27) as the ST-GCN's result, and the headline claim is an 8-point improvement over the Transformer. Because k and tau were chosen by maximizing the very same test-accuracy metric on the same evaluation split, the reported accuracy is effectively the selection criterion rather than an independent estimate. The claimed margin is therefore partly an artifact of test-set tuning, not a predicted generalization result.
full rationale
The derivation chain for graph construction (Eqs. 1-3) is label-free: structural connectivity is inverse Euclidean distance and functional connectivity is a correlation threshold, neither is defined in terms of the stress labels or the classification output. The ST-GCN is a standard architecture and the comparison to MLP/LSTM/Transformer is an empirical benchmark, not a reduction. There are no load-bearing self-citations or imported uniqueness claims. The only circular step is the test-set selection of k and tau: the same test accuracy used to choose the hyperparameters is then reported as the model's headline performance, so the 8-point margin is partly a selection artifact. The separate trial-level subject-leakage concern raised in the review is a validity threat, but it is not a circularity and does not affect this score beyond the same headline claim being untrustworthy.
Assumptions & free parameters
free parameters (6)
- k (number of nearest neighbours in structural graph) =
2
- tau (correlation threshold for functional edges) =
0.5
- epsilon (stabilizer in structural weights) =
not reported
- fusion weight for element-wise graph averaging =
0.5
- Conv1D kernel size and number of filters (F) =
not reported
- GCN hidden units and dense layer sizes =
not reported
assumptions (4)
- domain assumption Each of the 480 trials is treated as an independent sample for splitting and evaluation.
- standard math The standard GCN propagation rule (Kipf and Welling, Ref [12]) is a valid message-passing operator for this graph.
- domain assumption The 2D Euclidean distance between electrode positions meaningfully represents structural connectivity of the brain.
- domain assumption Pearson correlation thresholding captures functional connectivity relevant to stress.
Cite this review
Pith. "Pith review of Decoding the Stressed Brain with Geometric Machine Learning." pith.science (2026). https://pith.science/paper/O6DCTEQX
@misc{pith2026250600587,
  author       = {Pith},
  title        = {Pith review of: Decoding the Stressed Brain with Geometric Machine Learning},
  year         = {2026},
  howpublished = {\url{https://pith.science/paper/O6DCTEQX}},
  note         = {Machine review of arXiv:2506.00587}
}
read the original abstract
Stress significantly contributes to both mental and physical disorders, yet traditional self-reported questionnaires are inherently subjective. In this study, we introduce a novel framework that employs geometric machine learning to detect stress from raw EEG recordings. Our approach constructs graphs by integrating structural connectivity (derived from electrode spatial arrangement) with functional connectivity from pairwise signal correlations. A spatio-temporal graph convolutional network (ST-GCN) processes these graphs to capture spatial and temporal dynamics. Experiments on the SAM-40 dataset show that the ST-GCN outperforms standard machine learning models on all key classification metrics and enhances interpretability, explored through ablation analyses of key channels and brain regions. These results pave the way for more objective and accurate stress detection methods.
Figures


Figures from the paper (4 more)



Reference graph
Works this paper leans on
-
[1]
Journal of integrative neuroscience21(1), 20 (2022)
AlShorman, O., Masadeh, M., Heyat, M.B.B., Akhtar, F., Almahasneh, H., Ashraf, G.M., Alexiou, A.: Frontal lobe real-time eeg analysis using machine learning tech- niques for mental stress detection. Journal of integrative neuroscience21(1), 20 (2022)
work page 2022
-
[2]
Nature Reviews Neuroscience10(3), 186–198 (2009)
Bullmore, E., Sporns, O.: Complex brain networks: Graph theoretical analysis of structural and functional systems. Nature Reviews Neuroscience10(3), 186–198 (2009)
work page 2009
-
[3]
Biomedical Signal Processing and Control60, 101989 (2020)
Chakladar, D.D., Dey, S., Roy, P.P., Dogra, D.P.: Eeg-based mental workload es- timation using deep blstm-lstm network and evolutionary algorithm. Biomedical Signal Processing and Control60, 101989 (2020)
work page 2020
-
[4]
Journal of Electrical Systems20(11s), 3310–3327 (Nov 2024)
Chaudhari, A.S., Shrivastava, H.: Comprehensive review on stress detection using eeg signals and machine learning techniques. Journal of Electrical Systems20(11s), 3310–3327 (Nov 2024). https://doi.org/10.52783/jes.8087
-
[5]
Measuring Stress: A Guide for Health and Social Scientists10(2), 1–2 (1994)
Cohen, S., Kamarck, T., Mermelstein, R., et al.: Perceived stress scale. Measuring Stress: A Guide for Health and Social Scientists10(2), 1–2 (1994)
work page 1994
-
[6]
IEEE Signal Processing Letters29, 1574–1578 (2022)
Gao, Y., Fu, X., Ouyang, T., Wang, Y.: Eeg-gcn: Spatio-temporal and self- adaptive graph convolutional networks for single and multi-view eeg-based emotion recognition. IEEE Signal Processing Letters29, 1574–1578 (2022). https://doi.org/10.1109/LSP.2022.3179946
arXiv 2022
-
[7]
Data in Brief40, 107772 (2022)
Ghosh, R., Deb, N., Sengupta, K., Phukan, A., Choudhury, N., Kashyap, S., Phadikar, S., Saha, R., Das, P., Sinha, N., Dutta, P.: Sam 40: Dataset of 40 subject EEG recordings to monitor the induced-stress while performing stroop color-word test, arithmetic task, and mirror image recognition task. Data in Brief40, 107772 (2022)
work page 2022
-
[8]
Neurocomputing609, 128445 (2024)
Guo, Y., Tang, C., Wu, H., Chen, B.: Gnn-based multi-source domain prototype representation for cross-subject eeg emotion recognition. Neurocomputing609, 128445 (2024). https://doi.org/10.1016/j.neucom.2024.128445
Show all 27 references
-
[9]
Brain Sciences13(9), 1340 (2023)
Hag,A.,Al-Shargie,F.,Handayani,D.,Asadi,H.:Mentalstressclassificationbased on selected electroencephalography channels using correlation coefficient of hjorth parameters. Brain Sciences13(9), 1340 (2023)
2023
-
[10]
Elec- troencephalogr
Jasper, H.H.: Ten-twenty electrode system of the international federation. Elec- troencephalogr. Clin. Neurophysiol.10, 371–375 (1958)
1958
-
[11]
Electronics10(22), 2840 (2021)
Kamińska, D., Smółka, K., Zwoliński, G.: Detection of mental stress through eeg signal in virtual reality environment. Electronics10(22), 2840 (2021)
2021
-
[12]
arXiv preprint arXiv:1609.02907 (2016)
Kipf, T.N., Welling, M.: Semi-supervised classification with graph convolutional networks. arXiv preprint arXiv:1609.02907 (2016)
2016 arXiv
-
[13]
Journal of Neural Engineering19(2), 026039 (2022)
Li, G., Chen, N., Jin, J.: Semi-supervised eeg emotion recognition model based on enhanced graph fusion and gcn. Journal of Neural Engineering19(2), 026039 (2022)
2022
-
[14]
Brain Informatics11(1), 30 (2024)
Li, R., Yang, X., Lou, J., Zhang, J.: A temporal-spectral graph convolutional neu- ral network model for eeg emotion recognition within and across subjects. Brain Informatics11(1), 30 (2024)
2024
-
[15]
arXiv preprint arXiv:2402.01138 (2024)
Liu, C., Zhou, X., Wu, Y., Yang, R., Wang, Z., Zhai, L., Jia, Z., Liu, Y.: Graph neural networks in eeg-based emotion recognition: a survey. arXiv preprint arXiv:2402.01138 (2024)
2024
-
[16]
Neural Computing and Applications34(22), 19819– 19830 (2022) 14 S
Malviya, L., Mal, S.: A novel technique for stress detection from EEG signal using hybrid deep learning model. Neural Computing and Applications34(22), 19819– 19830 (2022) 14 S. Koszut, S. Nallaperuma-Herzberg, and P. Lio
2022
-
[17]
Results in Control and Optimization 11, 100231 (2023)
Mane, S.A.M., Shinde, A.: Stressnet: Hybrid model of lstm and cnn for stress detec- tion from electroencephalogram signal (eeg). Results in Control and Optimization 11, 100231 (2023). https://doi.org/10.1016/j.rico.2023.100231
2023
-
[18]
An- nals of the New York Academy of Sciences840(1), 33–44 (1998)
McEwen, B.S.: Stress, adaptation, and disease: Allostasis and allostatic load. An- nals of the New York Academy of Sciences840(1), 33–44 (1998)
1998
-
[19]
In: 2023 IEEE Applied Sensing Conference (APSCON)
Patel, A., Nariani, D., Rai, A.: Mental stress detection using eeg and recurrent deep learning. In: 2023 IEEE Applied Sensing Conference (APSCON). pp. 1–3 (2023). https://doi.org/10.1109/APSCON56343.2023.10100977
2023
-
[20]
NeuroImage52(3), 1059–1069 (2010)
Rubinov, M., Sporns, O.: Complex network measures of brain connectivity: Uses and interpretations. NeuroImage52(3), 1059–1069 (2010)
2010
-
[21]
Human Brain Mapping43(17), 5194–5209 (2022)
Shan, X., Cao, J., Huo, S., Chen, L., Sarrigiannis, P.G., Zhao, Y.: Spatial–temporal graph convolutional network for alzheimer classification based on brain functional connectivity imaging of electroencephalogram. Human Brain Mapping43(17), 5194–5209 (2022)
2022
-
[22]
In: International Conference on Pattern Recognition
Siddhad, G., Roy, P.P., Kim, B.G.: Neural networks meet neural activity: Utiliz- ing eeg for mental workload estimation. In: International Conference on Pattern Recognition. pp. 325–339. Springer (2025)
2025
-
[23]
Brain Informatics8(1), 13 (2021)
Sundaresan, A., Penchina, B., Cheong, S., Grace, V., Valero-Cabré, A., Martel, A.: Evaluating deep learning eeg-based mental stress classification in adolescents with autism for breathing entrainment bci. Brain Informatics8(1), 13 (2021)
2021
-
[24]
arXiv preprint arXiv:2104.08336 (2021)
Tang, S., Dunnmon, J.A., Saab, K., Zhang, X., Huang, Q., Dubost, F., Rubin, D.L., Lee-Messer, C.: Self-supervised graph neural networks for improved elec- troencephalographic seizure analysis. arXiv preprint arXiv:2104.08336 (2021)
2021 arXiv
-
[25]
Sensors25(5), 1293 (2025)
Vafaei, E., Hosseini, M.: Transformers in eeg analysis: A review of architectures and applications in motor imagery, seizure, and emotion classification. Sensors25(5), 1293 (2025)
2025
-
[26]
In: Cyber-enabled intelligence, pp
Xia, L., Malik, A.S., Subhani, A.R.: A physiological signal-based method for early mental-stress detection. In: Cyber-enabled intelligence, pp. 259–289. Taylor & Francis (2019)
2019
-
[27]
Biomedical Signal Processing and Control7(3), 303–308 (2012)
Yu, X., Zhang, J.: Estimating the cortex and autonomic nervous activity during a mental arithmetic task. Biomedical Signal Processing and Control7(3), 303–308 (2012)
2012
Reviewed August 7, 2026 · model on record in the stance chip above.
Discussion (0). Sign in to comment.