REVIEW 2 major objections 4 minor 4 references
Slow Feature Analysis on Markov Chains from Goal-Directed Behavior
T0 review · 2 major / 4 minor · reviewed 2026-08-07 · deepseek-v4-flash
Pith's one-line read Goal-directed behavior distorts optimal slow features near rewards, making them worse for value-function approximation than uniform features.
desk verdict Clean Markov-chain SFA derivation and a real scaling bound, but the headline empirical ordering is partly an artifact of evaluating MSE under the behavior-weighted stationary distribution; needs a fixed reference distribution before the practical claims hold. read the letter →
The pith
A machine-rendered reading of the paper's core claim, the machinery that carries it, and where it could break.
The reading
What carries the argument
The central object is the generalized eigenvalue problem $(D - M)Y = D Y \Lambda$, where $M$ is the symmetrized transition probability matrix $M_{uv} = \frac{1}{2}(\mu_u P_{uv} + \mu_v P_{vu})$, $D$ is the diagonal matrix of the stationary distribution $\mu$, and the columns of $Y$ are the optimal slow features ordered by eigenvalue. This is the SFA analogue on a Markov chain and coincides with a directed-graph Laplacian. The $1/\sqrt{\mu_i}$ bound on feature amplitude follows directly from the unit-variance constraint $\sum_i \mu_i y_i^2 = 1$, and it is the mechanism that translates nonuniform state occupancy into feature scaling. The work uses this formulation to show why goal-directed behavior misaligns slow features with value functions and why scale correction reverses the misalignment.
What would settle it
Run a parametric SFA variant (e.g., linear SFA or a neural SFA) on the paper's one-dimensional chain with a $\zeta$-greedy goal-directed policy and compare the learned features and value-approximation errors to the paper's predictions: if the features do not show the $1/\sqrt{\mu_i}$ scaling, or if goal-directed features do not underperform uniform features, then the free-response idealization does not carry over to practice.
Extended reading notes
Core claim
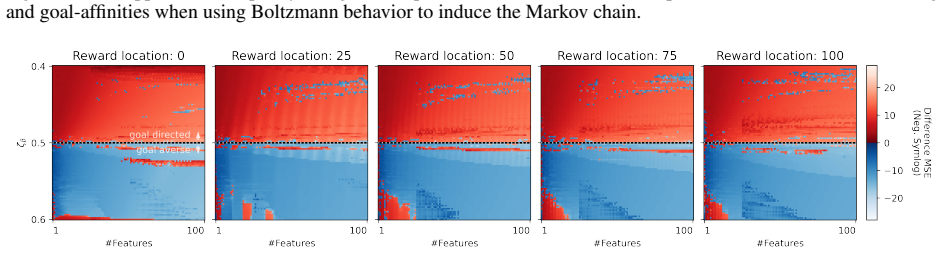
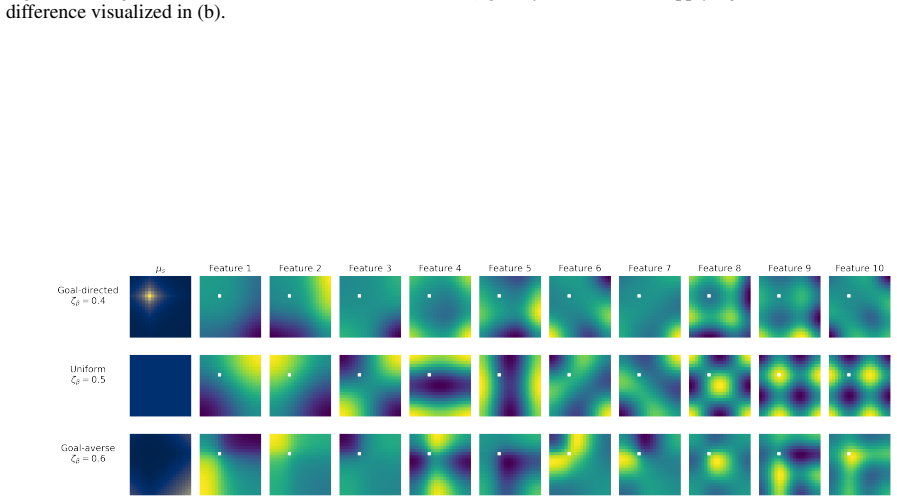
On an ergodic Markov chain, SFA's optimization problem reduces to a generalized eigenvalue problem whose constraints force each feature component $y_i$ to satisfy $|y_i| \le 1/\sqrt{\mu_i}$, where $\mu_i$ is the stationary occupancy of state $i$. Under goal-directed policies the stationary distribution is peaked at the reward, so optimal slow features are flattened where the agent spends most of its time and amplified where it rarely goes. In the paper's spatial experiments, this scaling makes the slow-feature basis worse at linearly approximating the optimal value function than features from a uniform walk: goal-directed features underperform, while goal-averse features—whose occupancy profile happens to match the value function's shape—outperform. The paper also shows that a post-hoc rescaling by $\sqrt{\mu_i}$, or replacing $\zeta$-greedy exploration with Boltzmann exploration, can largely undo the harm, whereas reweighting transitions (learning rate adaptation) does not.
Load-bearing premise
The analysis assumes the slow features can be any function of the state (unrestricted 'free responses'); if a real parametric SFA implementation cannot realize such features, the predicted scaling and corrections may not apply.
Editorial extensions
If this is right
- In off-policy reinforcement learning where the exploratory policy is goal-directed, SFA-based representations can be systematically worse for value approximation than uniform-data features, especially when the embedding dimension is low.
- Goal-averse exploration can turn the same scaling effect into an advantage, because the resulting features' amplitudes align with the value function's peak.
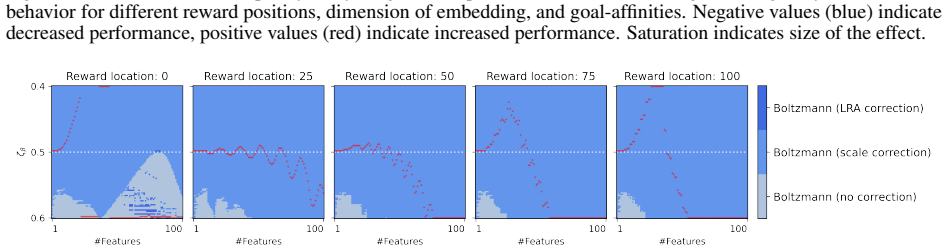
- Boltzmann exploration with scale correction yields the best overall approximation features across almost all tested settings, while learning-rate-adaptation correction never yields the best performance.
- The choice of behavior policy used to generate SFA training data is not neutral: it materially changes the geometry of the learned representation.
Reading between the lines
- By extension, the $1/\sqrt{\mu}$ bound is a general property of any representation with unit variance under a nonuniform data distribution, so the same flattening should appear in other spectral embedding methods when trained on goal-directed data, not only SFA.
- A natural test of the paper's caveat: linear or neural SFA features are constrained to a fixed functional family and may show a weaker or distorted version of the scaling, so the effect's magnitude could be architecture-dependent.
- The scale correction is applied with the most natural setting (factor $\sqrt{\mu_i}$); over-correcting toward goal-averse scaling is a free hyperparameter that could yield further gains in goal-directed regimes.
- In continuous state spaces, an analogous occupancy scaling should appear wherever the sampling distribution is nonuniform, so similar misalignment could affect representation learning in continuous control from near-optimal policies.
Editorial analysis
A structured set of objections, weighed in public.
Referee Report
Summary. This paper studies slow feature analysis (SFA) on Markov chains induced by goal-directed, uniform, and goal-averse behavior policies in finite spatial environments. The authors formulate SFA as a generalized eigenproblem on the symmetrized Laplacian of the chain, derive the unit-variance bound |y_i| <= 1/sqrt(mu_i), and argue that optimal slow features are flattened in high-occupancy regions and amplified in low-occupancy regions. They then propose three corrections--behavior modification, learning-rate adaptation, and scale correction--and evaluate linear value-function approximation of V* in 1D and 2D grids. The main empirical claims are that goal-directed behavior degrades and goal-averse behavior improves approximation relative to uniform features, and that Boltzmann behavior with scale correction is broadly beneficial.
Significance. The paper's derivation is transparent and connects SFA on Markov chains to existing spectral embeddings; the bound (24)-(25) is a clean, parameter-free consequence of the constraints. If the empirical ranking survives evaluation under a fixed reference distribution, the paper would make a useful contribution by showing that occupancy-driven scaling can misalign unsupervised representations with downstream value approximation and by identifying simple corrections. The experiments are deterministic and exhaustively sweep the considered parameter grids, and the authors are unusually candid about the non-formal status of the scaling claim and about the free-response idealization.
major comments (2)
- [Section 3 and Section 7] The central evaluation uses a behavior-dependent weighting: Section 3 states that the OLS fit 'leverages the stationary distribution of the environment,' and Section 7 reports mean-squared error under that same distribution. Because the goal-directed stationary distribution concentrates mass on the peak of V*, where the optimal SFA features are flattened, while the goal-averse distribution down-weights that peak, the reported ranking goal-averse > uniform > goal-directed can arise from the weighting alone rather than from representation quality. This confound is not listed among the Section 8 caveats. Please re-run the main comparisons under a fixed reference distribution (e.g., uniform over states) and report both behavior-weighted and fixed-reference errors; the Section 8 conclusions should be restated only for the conclusions that survive both metrics.
- [Section 4 and Section 8] All experimental results concern optimal free-response features, obtained by dropping 'any restriction (or definition) of the actual functional forms' (Section 4). The Discussion correctly says that real SFA with a fixed architecture 'can generally not realize optimal features' and that transfer is unclear, but the Section 8 bullet conclusions and the abstract do not carry this qualification. Since the proposed correction routes are meant to be used in practical representation learning, either add an experiment with a parametric (e.g., linear or gradient-based) SFA learner, or explicitly restrict every conclusion to optimal free responses.
minor comments (4)
- [Section 7.1] In the definition of goal-averse behavior, the condition for i<T should be pi(right|si) < 0.5, not pi(right|si) > 0.5; as written it is identical to the goal-directed condition for that case.
- [Section 5, Eqs. (24)-(25)] Write |y_i| <= 1/sqrt(mu_i) (and the corresponding statement in (25)); the notation y_i <= +/-1/sqrt(mu_i) is mathematically ambiguous.
- [Section 6] The displayed formula for the corrected diagonal D_vv = 1/2 + N_v mu_v/2 appears to assume sum_{u in N(v)} mu_u = 1; generally D_vv = sum_{u in N(v)} (mu_u + mu_v)/2. Please clarify or correct.
- [Section 5 and Section 8] The statement that the scaling effect is 'confirmed by all the experiments conducted' should be presented as an empirical finding for the tested grid environments, since the authors themselves note that the bound alone is not a formal proof.
Circularity Check
The derivation is self-contained: the scaling effect follows from the SFA constraints, and the performance claims are experimental outcomes under a stated evaluation metric, not identities built into the assumptions.
full rationale
The central derivation in Section 4 builds the SFA-on-Markov-chain objective (eqs. 8–16) directly from the slowness objective and the stationary distribution, and solves it as a generalized eigenvalue problem (eq. 21). The occupancy-dependent amplitude bound (eqs. 23–25) is a direct mathematical consequence of the variance constraint; the paper explicitly stops short of claiming a formal proof of the full scaling effect and says it is 'confirmed by all the experiments conducted.' The value-function approximation experiments use ground-truth V*, ordinary least squares, and the behavior policy's stationary distribution as an explicitly stated weighting choice; no parameter is fitted to the approximation target in constructing the optimal features. The self-citations (Wiskott 2003; Franzius et al. 2007) serve as conceptual precedent or as the origin of correction mechanisms, but the main argument does not reduce to them—the Lagrange-multiplier derivation and the numerical evaluations stand on their own. The Discussion's caveat that parametric SFA cannot generally realize optimal features is a genuine external-validity limitation, not a circularity. The behavior-weighted MSE could make the goal-averse versus goal-directed ranking sensitive to the evaluation distribution, but that is a robustness or correctness concern, not a circularity reduction: the paper's equations do not define the reported performance ordering into existence.
Assumptions & free parameters
free parameters (2)
- Discount factor gamma =
0.95
- Boltzmann inverse temperature beta =
implicitly calibrated, no numeric values given
assumptions (5)
- domain assumption Every behavior policy that is used induces an ergodic Markov chain with a unique stationary distribution
- domain assumption Optimal SFA features with unrestricted functional form are a faithful proxy for features learned by practical parametric SFA
- domain assumption Infinite-sample linear regression against ground-truth V* is representative of practical value-function approximation
- domain assumption The stationary distribution of the behavior policy is the correct data distribution for evaluating representation quality
- standard math Solutions of the generalized eigenvalue problem (D-M)y = D y Lambda provide the global optima of the SFA objective
Cite this review
Pith. "Pith review of Slow Feature Analysis on Markov Chains from Goal-Directed Behavior." pith.science (2026). https://pith.science/paper/NVIDBXTC
@misc{pith2026250601145,
  author       = {Pith},
  title        = {Pith review of: Slow Feature Analysis on Markov Chains from Goal-Directed Behavior},
  year         = {2026},
  howpublished = {\url{https://pith.science/paper/NVIDBXTC}},
  note         = {Machine review of arXiv:2506.01145}
}
read the original abstract
Slow Feature Analysis is a unsupervised representation learning method that extracts slowly varying features from temporal data and can be used as a basis for subsequent reinforcement learning. Often, the behavior that generates the data on which the representation is learned is assumed to be a uniform random walk. Less research has focused on using samples generated by goal-directed behavior, as commonly the case in a reinforcement learning setting, to learn a representation. In a spatial setting, goal-directed behavior typically leads to significant differences in state occupancy between states that are close to a reward location and far from a reward location. Through the perspective of optimal slow features on ergodic Markov chains, this work investigates the effects of these differences on value-function approximation in an idealized setting. Furthermore, three correction routes, which can potentially alleviate detrimental scaling effects, are evaluated and discussed. In addition, the special case of goal-averse behavior is considered.
Figures


Figures from the paper (27 more)






Reference graph
Works this paper leans on
-
[1]
L., Paiement, J.-F., Vincent, P., & Ouimet, M
Bengio, Y ., Delalleau, O., Roux, N. L., Paiement, J.-F., Vincent, P., & Ouimet, M. (2004). Learning eigenfunctions links spectral embedding and kernel pca. Neural Computation,
work page 2004
-
[4]
We use the convention to write the derivative of a scalary with respect to a matrix X = (Xij)ij is again a matrix ∂y ∂X = ∂y ∂Xij ij (28) of similar dimensions and entries corresponding to partial derivatives of the entries of X. Some useful identities: ∂ tr(AT BA) ∂A = ∂ tr(AT BA) ∂Aij ij (29) and for individual entries ∂ tr(AT BA) ∂Aij = ∂ ∂Aij tr(AT BA...
work page 2025
-
[16]
Bertsekas, D., & Tsitsiklis, J. (2002). Introduction to probability. Athena Scientific. Böhmer, W., Grünewälder, S., Shen, Y ., Musial, M., & Obermayer, K. (2013). Construction of approximation spaces for reinforcement learning. Journal of Machine Learning Research, 14(27), 2067–2118. http://jmlr.org/papers/ v14/boehmer13a.html Chung, F. (2005). Laplacian...
arXiv 2002
-
[2005]
Mnih, V ., Kavukcuoglu, K., Silver, D., Graves, A., Antonoglou, I., Wierstra, D., & Riedmiller, M. A. (2013). Playing atari with deep reinforcement learning. CoRR, abs/1312.5602. http://arxiv.org/abs/1312.5602 Schüler, M., Hlynsson, H. D., & Wiskott, L. (2019). Gradient-based training of slow feature analysis by differentiable approximate whitening. In W....
arXiv 2013
Reviewed August 7, 2026 · model on record in the stance chip above.
Discussion (0). Sign in to comment.