REVIEW 5 major objections 5 minor 51 references
Signature Maximum Mean Discrepancy Two-Sample Statistical Tests
T0 review · 5 major / 5 minor · reviewed 2026-08-07 · deepseek-v4-flash
Pith's one-line read Path scaling turns a failing signature two-sample test into a reliable one.
desk verdict Useful level-contribution analysis and a real practical insight, but the headline power gains rely on post hoc scaling choices and the hypothesis-testing section has fixable but real errors. read the letter →
The pith
A machine-rendered reading of the paper's core claim, the machinery that carries it, and where it could break.
The reading
What carries the argument
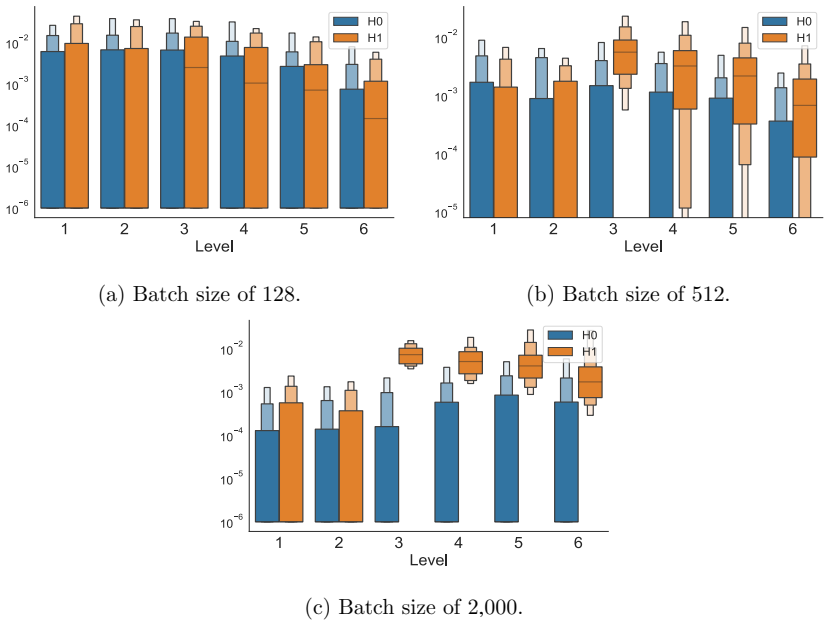
The load-bearing identity is the scalar-multiplication equivalence for signature kernels: $k_{\mathrm{Sig}}(\theta x, y) = k_{\mathrm{Sig}}(x, \theta y) = k^{\varphi}_{\mathrm{Sig}}(x, y)$ with $\varphi(m)=\theta^m$, which makes path scaling identical to weighting level-$m$ signature inner products by $\theta^m$. The paper also decomposes the $\varphi$-MMD into per-level contributions $\Gamma^{\varphi}_m$, so one can see which signature level carries the separation between the null and alternative distributions; the factorial decay estimate $\|\Phi_{\mathrm{Sig},m}(x)\| \le \|x\|_p^m / m!$ explains why, without reweighting, lower levels that do not separate the distributions dominate the statistic.
What would settle it
Run the Section 4.3 mixture-model pair—two processes with nearly equal first and second moments but different third moment—at batch size 128 and compute the per-level contributions under increasing scaling; if no finite scaling makes the third-level term separate from noise, then scaling reweights levels but cannot by itself make high-moment differences detectable in low-data regimes, which the paper's own 94.6% Type 2 error already hints at.
Extended reading notes
Core claim
The central claim is that the default sig-MMD two-sample test is systematically underpowered when two stochastic processes differ mainly in higher-order moments, because signature terms decay factorially and low-level terms dominate the statistic. Scaling both collections of paths by a common factor $\sqrt{\theta}$ is not a neutral preprocessing step: by [9, Corollary 2.10] it is exactly the $\varphi$-signature kernel with weight $\varphi(m)=\theta^m$ on level-$m$ signature terms, so it reweights the statistic toward the levels that separate the distributions. With this reweighting, the test detects differences between scaled Brownian motions and between GARCH models at batch size 128 with Type 2 errors near zero and Type 1 errors near the nominal 5%, and it detects distributional differences at much smaller batch sizes than the unscaled test.
Load-bearing premise
The power gains assume the user can find a good scaling factor, RBF bandwidth, and preprocessing pipeline without knowing the true relationship between the samples; in the paper every successful scaling (3, 5.5, 2, 0.8, 5) was selected by inspecting Type 2 error curves, and the Section 5 calibration estimates Type 2 error under an assumed alternative on unlabelled data.
Editorial extensions
If this is right
- For scaled Brownian motions with volatilities 0.2 and 0.3 and batch size 128, scaling by 3 lowers Type 2 error from 72.6% to 2.0% with the biased estimator and from 85.8% to 6.6% with the unbiased estimator.
- For GARCH models with distinct parameters, scaling by 5.5 lowers Type 2 error from 90.2% to 0.0% at batch size 128.
- Type 1 error remains centered near the 5% significance level across scaling factors and batch sizes, for both biased and unbiased estimators.
- Scaling lets the test separate distributions at much smaller batch sizes, which matters when data are scarce or computation is expensive.
- The per-level decomposition shows which signature level is responsible for separation, guiding the choice of scaling and preprocessing before the test is run.
Reading between the lines
- Because scaling is equivalent to changing the weight of each signature level, the same data expressed in different units can lead to different test conclusions; practitioners should treat scaling as a tunable hyperparameter, not an arbitrary normalization.
- The reweighting idea is not tied to the signature kernel: any graded feature map whose terms decay across levels could be reweighted analogously to emphasize the levels where two distributions differ.
- When paths are lifted through an RBF kernel, the scaling must be applied to the lifted path rather than the raw path, or the level-reweighting effect is lost.
- The mixture-model example suggests a diagnostic use of the level decomposition: checking whether any finite scaling makes the separating level dominate tells you in advance whether the test can succeed at a given batch size.
Editorial analysis
A structured set of objections, weighed in public.
Referee Report
Summary. The paper studies the signature Maximum Mean Discrepancy (sig-MMD) as a test statistic for two-sample tests on path-valued data. It introduces the phi-weighted signature kernel and the corresponding phi-MMD, decomposes the MMD into signature-level contributions, and argues that path scaling reweights higher-order signature levels, thereby reducing Type 2 errors. Through simulations with scaled Brownian motions, GARCH processes, and mixture models, the authors report large power improvements from scaling (e.g., Type 2 error falling from 72.6% to 2.0% for Brownian motion and from 90.2% to 0.0% for GARCH), while Type 1 error remains near the 5% significance level. The final section applies the pipeline to sector return data and concludes that the distributions are different. Public code is provided.
Significance. If the reported power gains were reproducible under a fixed protocol, the paper would be practically useful: it gives accessible numerical evidence that the signature kernel's level weighting strongly affects test power, and it ships public code and transparent level-decomposition diagnostics. The checks showing Type 1 error stability across scaling factors are a useful robustness observation. However, the central empirical claim is not yet established because the scaling factors are selected post hoc on the same data used to evaluate power, and the Section 5 calibration uses labels that the test is supposed to infer. The technical errors in Section 3 also need correction before the results can be relied upon.
major comments (5)
- [Section 3, first paragraph after fixing distributions] The rejection rule is stated backwards: the null hypothesis is 'rejected with significance alpha if d-hat^2 < c-hat_{1-alpha}'. Since the MMD is nonnegative and large values indicate disagreement between distributions, the correct rule is rejection when d-hat^2 > c-hat_{1-alpha}. As written, the procedure rejects H0 when the statistic is small, which is inconsistent with all power calculations in Section 4 and with the Type 2 error formula in Eq. (7). This must be corrected, and the numerical code should be checked against the corrected rule.
- [Section 3.3, asymptotic null distribution] The asymptotic null distribution is mis-normalized: the paper states that (1/N) d-hat^2_{kSig,2} converges to sum_i lambda_i (z_i^2 - 2), but the standard result in the cited references is that N times the unbiased MMD statistic converges to that weighted chi-square sum. With the displayed 1/N factor, the right-hand side would not be a valid asymptotic threshold. Please correct the normalization and confirm that no numerical result in Section 4 relies on this formula.
- [Sections 4.1-4.3, scaling factor selection] The headline power improvements are obtained with scaling factors (3, 5.5, 2, 0.8, 5) that were selected by inspecting Type 2 error curves on the same simulated data used to report the power. The paper states that 'various scaling factors' were tested and then reports the value that gives the dramatic improvement; this is oracle selection. A Type 2 error rate is an operating characteristic of a fixed test procedure, so the reductions from 72.6% to 2.0% and from 90.2% to 0.0% are not yet shown to be achievable under a legitimate protocol. Please either prespecify a selection rule (e.g., a moment-based heuristic, a separate validation set, or an aggregated test over a grid) and evaluate power after selection, or explicitly reframe the reported numbers as illustrative best-case effects of scaling.
- [Section 5, uncontrolled environment calibration] The calibration procedure computes the probability of a Type 2 error on the 80% calibration split, but in an uncontrolled environment the true hypothesis is unknown; computing a Type 2 error requires assuming an alternative, which uses exactly the labels the test is supposed to infer. The final permutation test on the 20% holdout is a single decision with no repeated-selection analysis and no Type 1 error estimate. Consequently, the real-data conclusion that the two sector distributions are not equal is not supported as a demonstration of a valid testing procedure. Please provide a protocol that does not use alternative labels for calibration, or clarify that Section 5 is an illustration whose statistical validity is not claimed.
- [Section 2.5, definition of Gamma^phi_m] The displayed definition of the level-m contribution reads Gamma^phi_m(PX,PY) = phi(m)[Lambda_m(PX,PY) - 2 Lambda_m(PX,PY) + Lambda_m(PX,PY)], with identical arguments in all three terms. It should be phi(m)[Lambda_m(PX,PX) - 2 Lambda_m(PX,PY) + Lambda_m(PY,PY)] to match the MMD expansion in Eq. (6) and the estimators used in the numerical sections. As written, the object is identically zero and cannot underlie the level-contribution plots in Figs. 2, 4, 8, 10, 13, and 14.
minor comments (5)
- [Section 4.1, paragraph after Fig. 1] The text refers to 'the high probability 85.5%', but the preceding sentence reports 85.8% for the unbiased estimator; please make the numbers consistent.
- [Section 3, Eq. (7) and surrounding text] The notation dF_H0 and dF_H1 is ambiguous: if F denotes a cumulative distribution function, write F(c-hat); if dF denotes a density, Eq. (7) should be an integral rather than a point evaluation. Please clarify the notation.
- [Section 2.5, moment interpretation] The statement that the level-K term of the expected signature is 'associated with the K-th moment' is imprecise: signature level K contains iterated integrals such as integral integral dX^i dX^j, which mix moments of different orders and include quadratic variation terms. Since this heuristic is used to justify the scaling mechanism, please replace it with a precise statement in terms of expected iterated integrals and the fact that scaling a path by theta multiplies the level-m signature term by theta^m.
- [Section 5, Figs. 18 and 19] The number of bootstrap or permutation replications used in the calibration and final decision is not stated; please report these values for reproducibility.
- [Section 2.5, Definition 2.1] The set XSeq is used before it is defined; please define it at first use.
Circularity Check
Headline power gains rest on scaling factors chosen by looking at the Type 2 error on the same data; without a prespecified selection rule, the reported reductions are in-sample optima.
-
fitted input called prediction
[Section 4.1, Scaled Brownian Motion (Figs. 3 and 5)]
"In our simulations, we tested various scaling factors. ... When re-running all simulations with scaled paths using a scaling factor of 3, the probability of a Type 2 error occurring drops to 2.0% (Fig. 3a) when using the biased estimator and 6.6% (Fig. 3b) when using the unbiased estimator."
The Type 2 error probability is both the selection objective and the reported outcome. The paper states it 'tested various scaling factors' and then reports the value (3) that minimizes the same Type 2-error-versus-scaling curve (Fig. 5) computed on the same simulated data. The drop from 72.6% to 2.0% is therefore the minimum of the selection criterion, not the operating characteristic of a prespecified sig-MMD test. No prespecified selection rule (moment heuristic, separate validation data, or alternative-free diagnostic) is supplied, so the headline reduction is an in-sample fit.
-
fitted input called prediction
[Section 4.2, Autoregressive Time Series Models / GARCH (Figs. 7 and 9)]
"Once again, path scaling was sufficient to reduce this probability. When a scaling of 5.5 was applied, the probability of a Type 2 error occurring dropped to 0.0% (Fig. 7b)."
The scaling factor 5.5 is selected from the Type 2 error surface in Fig. 9, which is computed on the same GARCH simulations that later yield the reported 0.0% error. Reporting the Type 2 error at the selected scaling is reporting the best point of the fitted curve; it is not a prediction for a fixed, prespecified test procedure. The paper does not state how a user would choose 5.5 without seeing the Type 2 error curve, so the reported improvement is statistically forced by the selection.
1 more flagged steps
-
fitted input called prediction
[Section 5, Uncontrolled Environment (calibration and holdout)]
"We propose optimising the scaling factor in a similar way, mimicking the optimisation procedure for certain hyperparameters in a ML context. Since we are focused on two-sample testing, the hyperparameters are optimised for a low probability of a Type 2 error occurring. ... 80% of the data was used to calibrate the hyperparameters of the test. ..."
The calibration stage computes Type 2 error under an assumed alternative on the 80% labelled calibration portion, so the labels the test is supposed to infer are used to select the scaling and RBF parameter. The final 20% holdout is a single permutation-test realization; no repeated-selection evaluation or holdout Type 1/Type 2 error estimate is reported. The chosen configuration is therefore fitted to labelled calibration data, and the holdout 'conclusion' is not an independent validation of the tuning protocol.
full rationale
The mathematical core of the paper—the reformulation of sig-MMD as a sum of level contributions and the equivalence between path scaling and the weight function phi(m)=theta^m—is imported from Cass-Lyons-Xu (refs [9, 10]) and from the MMD theory of Gretton et al.; those are external results, not self-citations by the present authors, and the paper does not derive its headline effect from a self-citation chain. The central circularity is empirical. In Sections 4.1, 4.2, and 4.3, the scaling factor is selected by inspecting the Type 2 error as a function of scaling on the same simulated data (Figs. 5, 9, 16), and the reported reductions (72.6% to 2.0%; 90.2% to 0.0%; 94.6% to 21.0%) are the values of that same objective at the selected points. A Type 2 error rate is an operating characteristic of a fixed test procedure; if the procedure includes 'inspect the Type 2 error curve and pick the best theta,' then the reported error is a fitted minimum, not a prediction. Section 5 does not cure this: the calibration stage computes Type 2 error under an assumed alternative on the 80% labelled calibration split, and the final 20% holdout is a single realization with no repeated-selection evaluation. The Type 1 error checks and the level-contribution analysis have independent content, which is why the score is 6 rather than 8; but the headline power claim, as stated, reduces by construction to the selection criterion.
Assumptions & free parameters
free parameters (2)
- Path scaling factor theta =
3 (scaled Brownian), 5.5 (GARCH), 2 (mixture, lifted), 0.8 (lifted RBF), 5 (real data)
- RBF smoothing parameter sigma_RBF =
sqrt(0.1), sqrt(0.5), 1, 0.5 depending on experiment
assumptions (4)
- domain assumption The signature kernel is characteristic and universal on compact subsets of path space, so sig-MMD is a metric.
- domain assumption Linearly interpolated sample paths belong to X^{1-var}, so signature theory applies to discretely sampled paths.
- standard math U-statistic asymptotic results for MMD, due to Gretton et al., transfer to the sig-MMD with the stated kernel h.
- standard math Donsker's invariance principle justifies treating linearly interpolated Brownian paths as converging to Brownian motion.
Cite this review
Pith. "Pith review of Signature Maximum Mean Discrepancy Two-Sample Statistical Tests." pith.science (2026). https://pith.science/paper/PWPJXMT5
@misc{pith2026250601718,
  author       = {Pith},
  title        = {Pith review of: Signature Maximum Mean Discrepancy Two-Sample Statistical Tests},
  year         = {2026},
  howpublished = {\url{https://pith.science/paper/PWPJXMT5}},
  note         = {Machine review of arXiv:2506.01718}
}
read the original abstract
Maximum Mean Discrepancy (MMD) is a widely used concept in machine learning research which has gained popularity in recent years as a highly effective tool for comparing (finite-dimensional) distributions. Since it is designed as a kernel-based method, the MMD can be extended to path space valued distributions using the signature kernel. The resulting signature MMD (sig-MMD) can be used to define a metric between distributions on path space. Similarly to the original use case of the MMD as a test statistic within a two-sample testing framework, the sig-MMD can be applied to determine if two sets of paths are drawn from the same stochastic process. This work is dedicated to understanding the possibilities and challenges associated with applying the sig-MMD as a statistical tool in practice. We introduce and explain the sig-MMD, and provide easily accessible and verifiable examples for its practical use. We present examples that can lead to Type 2 errors in the hypothesis test, falsely indicating that samples have been drawn from the same underlying process (which generally occurs in a limited data setting). We then present techniques to mitigate the occurrence of this type of error.
Figures


Figures from the paper (16 more)




Reference graph
Works this paper leans on
-
[1]
King’s Computational Research, Engineering and Technology Environment (CREATE),
-
[2]
J. Ai, O. Kuˇ zelka, and Y. Wang. Hoeffding–Serfling Inequality for U-Statistics Without Replacement. Journal of Theoretical Probability, 36:390–408, 2023
work page 2023
- [3]
-
[4]
H. Andr` es, A. Boumezoued, and B. Jourdain. Signature-based validation of real-world economic scenarios. ASTIN Bulletin , 54(2):410–440, 2024
work page 2024
-
[5]
E. Beutner and H. Z¨ ahle. Deriving the asymptotic distribution of U- and V-statistics of dependent data using weighted empirical processes. Bernoulli, 18(3):803 – 822, 2012
work page 2012
-
[6]
F. Black and M. Scholes. The Pricing of Options and Corporate Liabilities. Journal of Political Economy, 81(3):637–654, 1973
work page 1973
-
[7]
T. Bollerslev. Generalized autoregressive conditional heteroskedasticity. Journal of Econometrics, 31(3):307–327, 1986
work page 1986
-
[8]
H. B¨ uhler, B. Horvath, T. Lyons, I. P. Arribas, and B. Wood. A Data-Driven Market Simulator for Small Data Environments. 2020
work page 2020
Show all 51 references
-
[9]
T. Cass, T. Lyons, and X. Xu. General Signature Kernels. 2021
2021
-
[10]
T. Cass, T. Lyons, and X. Xu. Weighted signature kernels. The Annals of Applied Probability, 34(1A):585 – 626, 2024
2024
-
[11]
Ch´ erief-Abdellatif and P
B.-E. Ch´ erief-Abdellatif and P. Alquier. MMD-Bayes: Robust Bayesian Estimation via Maximum Mean Discrepancy. In Proceedings of The 2nd Symposium on Advances in Approximate Bayesian Inference , volume 118 of Proceedings of Machine Learning Research (PMLR), pages 1–21. PMLR, 0...
2020
-
[12]
Chevyrev and A
I. Chevyrev and A. Kormilitzin. A Primer on the Signature Method in Machine Learn- ing. 2016
2016
-
[13]
Chevyrev and H
I. Chevyrev and H. Oberhauser. Signature Moments to Characterize Laws of Stochastic Processes. Journal of Machine Learning Research , 23(176):1–42, 2022
2022
-
[14]
M. D. Donsker. An Invariance Principle for Certain Probability Limit Theorems. Amer- ican Mathematical Society. Memoirs. 1951
1951
-
[15]
R. F. Engle. Autoregressive Conditional Heteroscedasticity with Estimates of the Vari- ance of United Kingdom Inflation. Econometrica, 50(4):987–1007, 1982
1982
-
[16]
R. F. Engle and A. J. Patton. What good is a volatility model? Quantitative Finance, 1(2):237–245, 2001
2001
-
[17]
T. S. Ferguson. U-statistics notes for statistics 200c, 2005
2005
-
[18]
Fermanian
A. Fermanian. Embedding and learning with signatures. Computational Statistics & Data Analysis, 157, 2021
2021
-
[19]
X. Geng, H. Ni, and C. Wang. Expected Signature on a Riemannian Manifold and Its Geometric Implications. 2024
2024
-
[20]
Gretton, K
A. Gretton, K. Borgwardt, M. Rasch, B. Sch¨ olkopf, and A. Smola. A Kernel Method for the Two-Sample-Problem. In Advances in Neural Information Processing Systems , volume 19. MIT Press, 2006
2006
-
[21]
Gretton, K
A. Gretton, K. Borgwardt, M. Rasch, B. Sch¨ olkopf, and A. Smola. A Kernel Two- Sample Test. Journal Of Machine Learning Research , 13(25):723–773, 2012
2012
-
[22]
Gretton, K
A. Gretton, K. Fukumizu, Z. Harchaoui, and B. K. Sriperumbudur. A Fast, Consis- tent Kernel Two-Sample Test. In Advances in Neural Information Processing Systems , volume 22. Curran Associates, Inc., 2009
2009
-
[23]
Gretton, D
A. Gretton, D. Sejdinovic, H. Strathmann, S. Balakrishnan, M. Pontil, K. Fukumizu, and B. K. Sriperumbudur. Optimal kernel choice for large-scale two-sample tests. In 42 Advances in Neural Information Processing Systems , volume 25. Curran Associates, Inc., 2012
2012
-
[24]
L. G. Gyurk´ o, T. Lyons, M. Kontkowski, and J. Field. Extracting information from the signature of a financial data stream. 2014
2014
-
[25]
Harrison, D
D. Harrison, D. Sutton, P. Carvalho, and M. Hobson. Validation of Bayesian posterior distributions using a multidimensional Kolmogorov–Smirnov test. Monthly Notices of the Royal Astronomical Society , 451(3):2610–2624, 06 2015
2015
-
[26]
Hoeffding
W. Hoeffding. A Class of Statistics with Asymptotically Normal Distribution. The Annals of Mathematical Statistics , 19(3):293–325, 1948
1948
-
[27]
B. Hoff. The Brownian Frame Process as a Rough Path . PhD thesis, University of Oxford, 2005
2005
-
[28]
Horvath, M
B. Horvath, M. Lemercier, C. Liu, T. Lyons, and C. Salvi. Optimal Stopping via Distribution Regression: a Higher Rank Signature Approach. 2023
2023
-
[29]
Z. Issa, B. Horvath, M. Lemercier, and C. Salvi. Non-adversarial training of Neural SDEs with signature kernel scores. In Advances in Neural Information Processing Systems , volume 36, pages 11102–11126. Curran Associates, Inc., 2023
2023
-
[30]
N. L. Johnson, S. Kotz, and N. Balakrishnan. Continuous Univariate Distributions , volume 1. John Wiley and Sons, 2nd edition, 1994
1994
-
[31]
F. J. Kiraly and H. Oberhauser. Kernels for Sequentially Ordered Data. Journal of Machine Learning Research, 20(31):1–45, 2019
2019
-
[32]
J. M. K¨ ubler, W. Jitkrittum, B. Sch¨ olkopf, and K. Muandet. A Witness Two-Sample Test. In Proceedings of The 25th International Conference on Artificial Intelligence and Statistics, volume 151 of Proceedings of Machine Learning Research (PMLR) , pages 1403–1419. PMLR, 28–30...
2022
-
[33]
Lee and H
D. Lee and H. Oberhauser. The Signature Kernel. 2023. 43
2023
-
[34]
Lemercier, C
M. Lemercier, C. Salvi, T. Damoulas, E. Bonilla, and T. Lyons. Distribution Regression for Sequential Data. In Proceedings of the 24th International Conference on Artificial Intelligence and Statistics , volume 130 of Proceedings of Machine Learning Research (PMLR), pages 3754...
2021
-
[35]
Lyons and H
T. Lyons and H. Ni. Expected signature of Brownian motion up to the first exit time from a domain. The Annals of probability , 43(5):2729–2762, 2015
2015
-
[36]
Muandet, K
K. Muandet, K. Fukumizu, B. Sriperumbudur, and B. Sch¨ olkopf.Kernel Mean Embed- ding of Distributions: A Review and Beyond . 2017
2017
-
[37]
H. Ni, L. Szpruch, M. Sabate-Vidales, B. Xiao, M. Wiese, and S. Liao. Sig-wasserstein gans for time series generation. In Proceedings of the Second ACM International Con- ference on AI in Finance , ICAIF ’21, New York, NY, USA, 2022. Association for Com- puting Machinery
2022
-
[38]
D. Pati. U-statistics
-
[39]
Rahimi and B
A. Rahimi and B. Recht. Random Features for Large-Scale Kernel Machines. In Ad- vances in Neural Information Processing Systems , volume 20. Curran Associates, Inc., 2007
2007
-
[40]
Salvi, T
C. Salvi, T. Cass, J. Foster, T. Lyons, and W. Yang. The Signature Kernel is the Solution of a Goursat PDE. SIAM Journal on Mathematics of Data Science , 3(3):873–899, 2021
2021
-
[41]
Salvi, M
C. Salvi, M. Lemercier, C. Liu, B. Horvath, T. Damoulas, and T. Lyons. Higher Or- der Kernel Mean Embeddings to Capture Filtrations of Stochastic Processes. In 35th Conference on Neural Information Processing Systems , volume 34 of NeurIPS 2021 , 2021
2021
-
[42]
Schrab, I
A. Schrab, I. Kim, M. Albert, B. Laurent, B. Guedj, and A. Gretton. MMD Aggregated Two-Sample Test. Journal of machine learning research , 24(194):1–81, 2023
2023
-
[43]
J. Shao. U- and v-statistics, 2018. 44
2018
-
[44]
Simon-Gabriel and B
C.-J. Simon-Gabriel and B. Sch¨ olkopf. Kernel Distribution Embeddings: Universal Ker- nels, Characteristic Kernels and Kernel Metrics on Distributions. Journal of Machine Learning Research, 19(44):1–29, 2018
2018
-
[45]
D. J. Sutherland, H. Tung, H. Strathmann, S. De, A. Ramdas, A. J. Smola, and A. Gret- ton. Generative Models and Model Criticism via Optimized Maximum Mean Discrep- ancy. In 5th International Conference on Learning Representation , ICLR 2017, 2017
2017
-
[46]
Terry and A
L. Terry and A. D. McLeod. Signature Methods in Machine Learning. 2024
2024
-
[47]
Rough paths, signatures and the modelling of functions on streams
Terry Lyons. Rough paths, signatures and the modelling of functions on streams. In Proceedings of the International Congress of Mathematicians , 2014
2014
-
[48]
T´ oth, H
C. T´ oth, H. Oberhauser, and Z. Szab´ o. Random Fourier Signature Features. 2023
2023
-
[49]
G. E. Uhlenbeck and L. S. Ornstein. On the Theory of Brownian Motion. Physics Review, 36(5):823–841, 1930
1930
-
[50]
Zhang, X
P. Zhang, X. Chen, L. Zhao, W. Xiong, T. Qin, and T.-Y. Liu. Distributional Rein- forcement Learning for Multi-Dimensional Reward Functions. In Advances in Neural Information Processing Systems, volume 34, pages 1519–1529. Curran Associates, Inc., 2021. 45
2021
-
[2022]
King’s College London
Reviewed August 7, 2026 · model on record in the stance chip above.
Discussion (0). Sign in to comment.