REVIEW 3 major objections 4 minor 1 cited by
Monte Carlo Simulation and Dosimetric Analysis of Gold Nanoparticles (AuNPs) in Breast Tissue
T0 review · 3 major / 4 minor · reviewed 2026-08-07 · deepseek-v4-flash
Pith's one-line read This paper claims that a closed-form survival curve for AuNP-sensitized cells follows from the dose-enhancement ratio alone, with enhancement scaling as the cube of particle radius.
desk verdict Solid dosimetry and a useful Auger-cascade analysis, but the new mLEM's sigma–DER mapping is internally inconsistent, so the central survival-formula claim needs rework before it can be trusted. read the letter →
The pith
A machine-rendered reading of the paper's core claim, the machinery that carries it, and where it could break.
The reading
What carries the argument
The load-bearing object is the modified Local Effect Model (mLEM), which replaces voxel-level dose scoring with a log-normal local-dose ansatz $D_{\mathrm{enh}} = D_0 e^{\sigma Z}$ with $Z\sim N(0,1)$. Averaging the linear-quadratic survival expression over $Z$ using the Gaussian identity behind Eq. (20) turns the stochastic dose into the closed form of Eq. (21); the relation $\sigma=\sqrt{2\ln(\mathrm{DER})}$ connects the model to simulation, and the photoelectric ionization count $\Delta N \propto \mathrm{Volume}_{\mathrm{AuNP}}\propto R^3$ supplies the size scaling.
What would settle it
Take the 100 nm AuNP case at roughly 65 mM in a flattened cell and tally the per-voxel dose histogram from a high-statistics PENELOPE run: if the histogram fails a log-normality test (for example, a Kolmogorov–Smirnov p-value well below 0.05 or skewness and kurtosis outside log-normal bounds), Eq. (21) loses its foundation. Alternatively, measure clonogenic survival of AuNP-treated breast cells at 2 Gy under 50 kVp and compare with the mLEM prediction from the independently measured DER; a disagreement beyond experimental uncertainty would falsify the closed form.
Extended reading notes
Core claim
On the paper's own terms, the central discovery is Equation (21): a closed-form survival curve $S_\sigma(D) = \frac{\exp[-\alpha D - \beta D^2 + \frac{\alpha^2\sigma^2 D^2}{2(1+2\beta\sigma^2 D^2)}]}{\sqrt{1+2\beta\sigma^2 D^2}}$ that follows once the per-voxel enhanced dose is log-normally distributed with median baseline dose $D_0$ and width $\sigma$ (Eq. 15). Because the log-normal mean is $\langle D\rangle = D_0 e^{\sigma^2/2}$, the measured DER fixes $\sigma = \sqrt{2\ln(\mathrm{DER})}$, and because the ionization count is proportional to AuNP volume, DER scales as $R^3$, giving $\sigma = \sqrt{2\ln R^3}$. The paper therefore claims that a single DER measurement yields the full survival curve for any AuNP size and concentration, and that the classical LEM's pure-$\alpha$ shift is replaced by an additional $\beta$ shift arising from volume-scaled Poisson fluctuations.
Load-bearing premise
The whole closed-form result rests on the assumption that the per-voxel enhanced dose is log-normally distributed with median equal to the baseline dose; this was chosen by fitting candidate distributions to the paper's own simulated voxel histogram and justified by a geometric central-limit heuristic, not derived from independent cell data.
Editorial extensions
If this is right
- If Eq. (21) is correct, survival curves for AuNP-sensitized cells can be generated from an experimentally measured DER alone, without running voxel-level Monte Carlo.
- Doubling the AuNP radius multiplies the dose-enhancement ratio by eight ($R^3$), so the model predicts $\sigma=1.09$ for 50 nm and $\sigma=2.66$ for 100 nm particles under the simulated conditions.
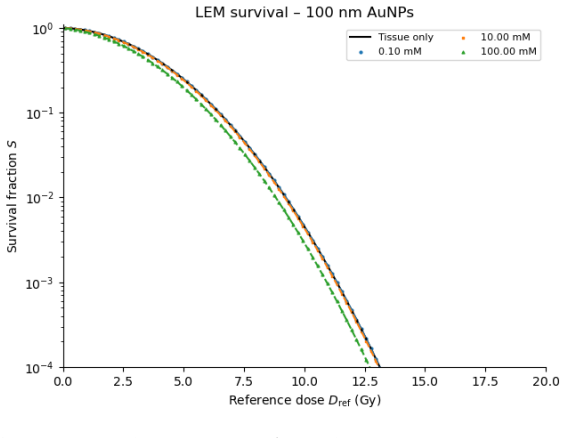
- At clinically plausible concentrations the classical LEM predicts only modest sensitization ($\mathrm{SER}_2\le 1.10$); the mLEM raises this to roughly 1.3–1.7 for the larger-particle, higher-concentration cases.
- The mLEM predicts an effective shift in the quadratic survival parameter $\beta$, not just the linear $\alpha$ shift of the classical LEM, because volume-scaled Poisson fluctuations make double-hit events non-negligible.
- A direct corollary is that shape should not matter for dose enhancement, only volume, since $\Delta N$ depends on AuNP volume rather than geometry.
Reading between the lines
- Editorial extension: the same DER-to-$\sigma$ conversion could be inverted—fitting Eq. (21) to experimental clonogenic survival data would yield an inferred effective DER, giving a radiobiological check on Monte Carlo DER estimates.
- Editorial extension: the $R^3$ scaling suggests equal-volume nanorods and nanospheres should produce identical mLEM survival curves; this is testable with the same two-stage phase-space simulation and would sharpen the paper's shape-independence claim.
- Editorial extension: at low nanoparticle numbers or strongly clustered distributions the geometric central-limit argument for log-normality may break down; the model's validity could be probed by computing skewness and kurtosis of per-voxel doses as particle count decreases.
- Editorial extension: the closed form is not limited to gold; other high-Z nanoparticles with similar photoelectric and Auger behavior could be handled by the same machinery if their local dose distributions remain log-normal.
Editorial analysis
A structured set of objections, weighed in public.
Referee Report
Summary. The manuscript reports PENELOPE Monte Carlo simulations of dose enhancement by gold nanoparticles (AuNPs) in water and breast tissue, validating the DER against published intercomparison data. It then studies secondary electron and Auger cascades via two-stage phase-space files, applies a classical Local Effect Model (LEM) to obtain survival curves, and proposes a new 'modified LEM' (mLEM) in which the local dose in a flattened cell is assumed log-normally distributed. The central claim is that Eq. (21) gives a closed-form survival curve for any scenario once the dose-enhancement ratio is known, with the width sigma obtained from DER by Eq. (22) and with DER scaling as R^3 (Eq. 23).
Significance. If the mLEM were internally consistent and independently validated, it would be a practically useful fast tool for estimating AuNP radiosensitization from a single DER value without voxel-level simulations. The work has real strengths: the DER benchmarking against Li et al. is plausible (within 20%, with binning differences acknowledged), the phase-space-file analysis of LMM-MNN-NOO Auger cascades and self-absorption is informative, and the observation that photoelectric absorption dominates secondary production near the nanoparticle is physically sensible. However, the mLEM's calibration recipe is internally inconsistent, the concentration calculations contain a factor-of-ten error, and the model is not tested against independent data. These issues are load-bearing for the paper's central claim.
major comments (3)
- [Sec. 3.2.4, Eqs. (22)-(23), Fig. 10] The recipe for converting DER to sigma and then to a survival curve is internally inconsistent. Eq. (22) gives sigma = sqrt(2 ln 1.9) = 1.13 and sigma = sqrt(2 ln 8.3) = 2.06, but the text reports sigma = 1.09 and sigma = 2.66 and feeds those values into Eq. (21) to produce Fig. 10. The reported sigma = 2.66 corresponds to DER = exp(2.66^2/2) ~ 34, not 8.3. Eq. (23) is also dimensionally incomplete: if DER(R) = DER_ref (R/R_ref)^3, then sigma^2 = 2[ln DER_ref + 3 ln(R/R_ref)], not 2 ln R^3. Moreover, the paper's own flattened-cell means give DER values of 1.9 and 8.3, a ratio of about 4.37 for a doubling of diameter, not the factor 8 required by the R^3 claim. Because Fig. 10 and the quoted SER2 values (1.24 and 1.66) are obtained from the stated sigma values, they cannot be reproduced from the paper's stated recipe. In addition, Eq. (18) relies on the small-sigma expansion D_enh ~ D0(1+sigma Z), which is not valid at sigma = 2.06 or 2.66.
- [Appendix G, Secs. 2.2.5 and 3.2.4] The gold concentration calculation contains a factor-of-ten error. Eq. (G.13) gives n50 = 1.28 x 10^-14 mol, but Eq. (G.15) divides 1.28 x 10^-15 mol by the cytoplasm volume, yielding 8.15 mM instead of the correct 81.5 mM. Consequently, the concentrations quoted for the flattened-cell simulations (8.15 mM and 65.2 mM) are tenfold too low, and the 100 nm concentration, if scaled by 2^3, would be 652 mM rather than 65.2 mM. This error propagates into the mLEM SER2 values quoted at these concentrations. It also affects the statement in Sec. 3.2.4 that the two nanoparticle sizes are compared at a consistent gold mass: 2000 particles of 100 nm diameter contain eight times more gold than 2000 particles of 50 nm diameter.
- [Sec. 2.2.5, Eq. (15), Fig. 10] The mLEM is not validated. The log-normal dose distribution is selected by fitting candidate PDFs to the same simulated voxel dose histogram that supplies the DER values used to calibrate sigma, and the predicted survival curves in Fig. 10 are in-sample outputs with no comparison to clonogenic survival data or to an independent simulation. The paper acknowledges that further validation is needed, but the abstract and Sec. 3.2.4 make the stronger claim that Eq. (21) can be applied to any scenario once DER is known. That claim is not supported by the evidence presented. An out-of-sample test, a comparison with experimental survival data, or at minimum a sensitivity analysis of the log-normal assumption is required before the mLEM can be presented as a general predictive tool.
minor comments (4)
- [Sec. 3.2.4] The sentence '10.49/1.27 ~ 8.3 for the 50 nm AuNPs' should refer to the 100 nm AuNPs, since the preceding sentence already attributes 1.9 to the 50 nm case.
- [Secs. 2.2.5 and 3.2.4] The 100 nm concentration is quoted as 65.2 mM in some places and 67 mM in others; after correcting the Appendix G error, the values should be made internally consistent.
- [Appendix G] The text says the 100 nm concentration 'scales with 23 (twice the radius cubed)'; the exponent should be typeset as 2^3.
- [Eq. (5)] The equation is typeset with an unresolved line break, and the symbol A_source is used before being defined in the following sentence.
Circularity Check
The mLEM's survival 'predictions' reduce to the same fitted lognormal dose distribution that supplies DER; the reported σ=1.09 and 2.66 do not follow from the paper's own Eq. (22), so Figure 10 is an in-sample fit rather than an independent prediction from DER alone.
-
fitted input called prediction
[Section 3.2.4, Eqs. (15), (21), (22), and the paragraph after Eq. (23)]
"Given that the mean dose can be written as ⟨D⟩=D0 e^{σ^2/2}, the simulated dose-enhancement ratio DER=⟨D⟩/D0 can be related to the stochastic variations σ: σ=√(2 ln(DER)). ... Equation (21) gives a closed-form survival curve that can be applied to any scenario once DER is known. ... In our data DER = 1.9(50nm) gives σ = 1.09, while DER = 8.3(100nm) gives σ = 2.66."
Equation (22) defines σ from DER by the log-normal mean identity, and Eq. (21) then yields survival as a deterministic function of that σ; the log-normal form itself was adopted because it fit the very same voxel-dose histogram (Section 3.2.4, 'the log-normal PDF provided the best fit ... and was therefore adopted'). The reported σ values (1.09 and 2.66) do not satisfy Eq. (22) for the stated DERs (which give 1.13 and 2.06), so they are the fitted shape parameters of that histogram, not predictions from DER alone. Feeding them into Eq. (21) makes Figure 10 and the SER2 values (1.24, 1.66) in-sample outputs of the fit, not an independently testable prediction.
full rationale
The PENELOPE DER simulations are externally benchmarked against Li et al. (Fig. 3), and the PSF/Auger analysis is self-contained, so the dosimetric core has independent content and no self-citation chain is load-bearing. The circularity is confined to the new mLEM section: the survival curves of Fig. 10 are constructed from σ values obtained by fitting a log-normal to the same simulated voxel dose distribution whose mean defines DER, and the paper's assertion that Eq. (22) converts DER to those σ values is arithmetically false (1.9→1.13, 8.3→2.06, not 1.09 and 2.66). Additionally, the R^3 scaling premise (Eq. 23) is contradicted by the paper's own DER ratio (8.3/1.9=4.37, not 8), which indicates size-dependent self-absorption, as the Auger cascade analysis in Table 1 confirms; this is an internal inconsistency rather than a circularity. The arXiv header note also states that the manuscript was not accepted and that errors were corrected, which is a limitation but not itself a circular step. Overall, the central mLEM 'prediction' reduces by construction to the fitted log-normal model, so the circularity score is moderate.
Assumptions & free parameters
free parameters (4)
- Baseline LQ parameters alpha0, beta0 =
alpha=0.019 Gy^-1, beta=0.052 Gy^-2
- Transport parameters C1, C2, WCC, WCR, EABS =
C1=C2=0.0001, WCC=0.5 eV, WCR=0.05 eV, EABS=50 eV
- Nucleus radius r_low =
5 micrometers
- Number of AuNPs in flattened cell =
2000
assumptions (6)
- domain assumption Charged particle equilibrium (CPE) holds for the fluence-to-dose conversion
- domain assumption Every photon interaction with the AuNP leads to an ionization
- standard math Mean chord length is small enough for first-order Taylor expansion
- ad hoc to paper Local dose enhancement is log-normally distributed
- domain assumption Mixed terms between baseline and enhanced dose can be discarded
- domain assumption The product of stopping power, track fraction, and enhancement factor are nearly independent
Cite this review
Pith. "Pith review of Monte Carlo Simulation and Dosimetric Analysis of Gold Nanoparticles (AuNPs) in Breast Tissue." pith.science (2026). https://pith.science/paper/2GQNERB2
@misc{pith2026250601878,
  author       = {Pith},
  title        = {Pith review of: Monte Carlo Simulation and Dosimetric Analysis of Gold Nanoparticles (AuNPs) in Breast Tissue},
  year         = {2026},
  howpublished = {\url{https://pith.science/paper/2GQNERB2}},
  note         = {Machine review of arXiv:2506.01878}
}
read the original abstract
Precise radiation delivery is critical for effective radiotherapy, and gold nanoparticles (AuNPs) have emerged as promising tools to enhance local dose deposition while sparing the surrounding healthy tissue. In this study, the PENELOPE Monte Carlo code was used to investigate the dosimetry of AuNPs under different conditions and models. The Dose Enhancement Ratio (DER) was studied in water and breast tissue with spherical shapes and in agreement with previously published results. To further analyse the physical interactions of the particles around the AuNP, a Phase Space File (PSF) in a volume around the AuNPs was created. This showed that larger AuNPs lead to increased doses, as expected, yielding DER values exceeding 100 times. Finally, results reveal that in the volume surrounding the AuNP, 80% of emitted electrons originate from photoelectric absorption, leading to Auger electron emission cascades which were analysed in detail. It was also possible to establish a direct relation between number of secondaries and the particle volumes. The Local Effect Model (LEM) was used to determine survival curves in AuNPs of different sizes at different gold concentrations. The last part of this work consisted in analysing a distribution of AuNPs within a flattened cell typical of clonogenic assays where a log-normal distribution of dose was observed. This led to the development of a new, mechanistic, Local Effect Model which, if further validated, can have further applications in-vitro and in-silico.
Figures


Figures from the paper (8 more)




Forward citations
Cited by 1 Pith paper
-
An analytical model for gold nanoparticle radiosensitisation
A variance-driven local-effect model (sigma-LEM) gives DER = 1 + Kc c and closed-form survival curves for gold nanoparticle radiosensitization, with Kc fitted to synchrotron data.
Reference graph
Works this paper leans on
-
[1]
World Health Organization. Cancer key facts, 2022. URLhttps:// www.who.int/news-room/fact-sheets/detail/cancer. Retrieved on 2023-11-06
work page 2022
-
[2]
Rebecca L. Siegel, Kimberly D. Miller, Howard E. Fuchs, and Ahmedin Jemal. Cancer statistics, 2022.CA Cancer J Clin, 72(1):7–33, 2022. doi: 10.3322/caac.21708
-
[3]
URL https://www.esmo.org/oncology-news
2020 cancer incidence and mortality in eu 27 countries, 2020. URL https://www.esmo.org/oncology-news. Retrieved on 2023-11-06
work page 2020
-
[4]
N. Miranda et al. Portugal: Doenças oncológicas em números 2015, 2015. URLhttps://www.dgs.pt/ estatisticas-desaude/estatisticas-de-saude/publicacoes/ portugal-doencas-oncologicas-em-numeros-2015-pdf.aspx. Online resource
work page 2015
- [5]
-
[6]
Sang Hyun Cho, Bernard L Jones, and Sunil Krishnan. The dosi- metric feasibility of gold nanoparticle-aided radiation therapy (gnrt) via brachytherapy using low-energy gamma-/x-ray sources.Physics in Medicine and Biology, 54(16):4889, jul 2009. doi: 10.1088/0031-9155/ 54/16/004. URLhttps://dx.doi.org/10.1088/0031-9155/54/16/ 004
-
[7]
L.C. Kennedy, L.R. Bickford, N.A. Lewinski, and et al. A new era for cancer treatment: gold-nanoparticle-mediated thermal therapies.Small, 7(2):169–183, 2011. doi: 10.1002/smll.201000134
- [8]
Show all 44 references
-
[9]
W.B. Li, A. Belchior, M. Beuve, Y.Z. Chen, S. Di Maria, W. Fried- land, B. Gervais, B. Heide, N. Hocine, A. Ipatov, A.P. Klapproth, C.Y. 36 Li, J.L. Li, G. Multhoff, F. Poignant, R. Qiu, H. Rabus, B. Rudek, J. Schuemann, S. Stangl, E. Testa, C. Villagrasa, W.Z. Xie, and Y.B. Z...
2020 doi
-
[10]
intercomparison of dose enhancement ra- tio and secondary electron spectra for gold nanoparticles irradiated by x-rays calculated using multiple monte carlo simulation codes
W.B. Li, A. Belchior, M. Beuve, Y.Z. Chen, S. Di Maria, W. Fried- land, B. Gervais, B. Heide, N. Hocine, A. Ipatov, A.P. Klapproth, C.Y. Li, J.L. Li, G. Multhoff, F. Poignant, R. Qiu, H. Rabus, B. Rudek, J. Schuemann, S. Stangl, E. Testa, C. Villagrasa, W.Z. Xie, and Y.B. Zhan...
2020
-
[11]
Her, D.A
S. Her, D.A. Jaffray, and C. Allen. Gold nanoparticles for applications in cancer radiotherapy: Mechanisms and recent advancements.Adv. Drug Deliv. Rev., 109:84–101, 2017. doi: 10.1016/j.addr.2015.12.012
2017 doi
-
[12]
Silva, João F
Simone S. Silva, João F. Mano, and Rui L. Reis. Ionic liquids in the processing and chemical modification of chitin and chitosan for biomed- ical applications.Green Chem., 19:1208–1220, 2017. doi: 10.1039/ C6GC02827F. URLhttp://dx.doi.org/10.1039/C6GC02827F
2017 doi
-
[13]
Sztandera, M
K. Sztandera, M. Gorzkiewicz, and B. Klajnert-Maculewicz. Gold nanoparticles in cancer treatment.Mol Pharm, 16(1):1–23, 2019. doi: 10.1021/acs.molpharmaceut.8b00810
2019 doi
-
[14]
Interrogating the role of receptor-mediated mechanisms: Biological fate of peptide-functionalized radiolabeled gold nanoparticles in tumor mice
Francisco Silva, Ajit Zambre, Maria Paula Cabral Campello, Lurdes Gano, Isabel Santos, Ana Maria Ferraria, Maria Joao Ferreira, Amolak Singh, Anandhi Upendran, Antonio Paulo, and Raghuraman Kannan. Interrogating the role of receptor-mediated mechanisms: Biological fate of pept...
2016 doi
-
[15]
URL:https://physics.nist.gov/PhysRefData/Xcom/html/ xc\om1.html
Nist: photon cross section data for a single element, compound, or mix- ture. URL:https://physics.nist.gov/PhysRefData/Xcom/html/ xc\om1.html. 37
-
[16]
Cooper, Devesh Bekah, and Jay L
Daniel R. Cooper, Devesh Bekah, and Jay L. Nadeau. Gold nanoparticles and their alternatives for radiation therapy enhance- ment.Front. Chem., 2, 2014. ISSN 2296-2646. doi: 10.3389/ fchem.2014.00086. URLhttps://www.frontiersin.org/articles/ 10.3389/fchem.2014.00086
2014
-
[17]
Nanoparticle radio- enhancement: Principles, progress and application to cancer treatment
Zdenka Kuncic and Sandrine Lacombe. Nanoparticle radio- enhancement: Principles, progress and application to cancer treatment. Phys. Med. Biol., 63(2), 2018. doi: 10.1088/1361-6560/aa99ce
2018 doi
-
[18]
Fifty years of monte carlo simulations for medical physics*.Physics in Medicine and Biology, 51(13):R287, jun 2006
D W O Rogers. Fifty years of monte carlo simulations for medical physics*.Physics in Medicine and Biology, 51(13):R287, jun 2006. doi: 10.1088/0031-9155/51/13/R17. URLhttps://dx.doi.org/10.1088/ 0031-9155/51/13/R17
2006 doi
-
[19]
Lechtman et al
E. Lechtman et al. A monte carlo-based model of gold nanoparticle radiosensitization accounting for increased radiobiological effectiveness. Phys. Med. Biol., 58:3075, 2013
2013
-
[20]
Jeremy M. C. Brown and Fred J. Currell. A local effect model-based interpolation framework for experimental nanoparti- cle radiosensitisation data.Cancer Nanotechnol., 8(1):1, 2017. doi: 10.1186/s12645-016-0025-6. URLhttps://doi.org/10.1186/ s12645-016-0025-6. Epub 2017 Jan 31
2017 doi
-
[21]
Kraft, M
G. Kraft, M. Scholz, and U. Bechthold. Tumor therapy and track struc- ture.Radiation and Environmental Biophysics, 38:229–237, 1999
1999
-
[22]
Biological modeling of gold nanoparticle enhanced radiotherapy for proton therapy.Phys
Yuting Lin et al. Biological modeling of gold nanoparticle enhanced radiotherapy for proton therapy.Phys. Med. Biol., 60:4149, 2015
2015
-
[23]
reproducibility study of monte carlo simula- tions for nanoparticle dose enhancement and biological modeling of cell survival curves
Hans Rabus. Comment on "reproducibility study of monte carlo simula- tions for nanoparticle dose enhancement and biological modeling of cell survival curves" by velten et al[biomed phys eng express 2023;9:045004]. Biomed Phys Eng Express, 10(2), 2024. doi: 10.1088/2057-1976/ad1731
2023 doi
-
[24]
Wolfgang Tomé Christian Velten. Reply to comment on ’reproducibility study of monte carlo simulations for nanoparticle dose enhancement and biological modeling of cell survival curves’ [ biomed phys eng express 2023; 9:045004].Biomed Phys Eng Express, 10(2), 2024. doi: 10.1088...
2023
-
[25]
Size-dependent radiosensitization of peg- coated gold nanoparticles for cancer radiation therapy.arXiv preprint arXiv:1210.0638, 2012
Xiao-Dong Zhang, Di Wu, Xiu Shen, Jie Chen, Yuan-Ming Sun, Pei- Xun Liu, and Xing-Jie Liang. Size-dependent radiosensitization of peg- coated gold nanoparticles for cancer radiation therapy.arXiv preprint arXiv:1210.0638, 2012. URLhttps://arxiv.org/abs/1210.0638
-
[26]
Energyoptimizationingoldnanopar- ticle enhanced radiation therapy.Phys
WonmoSungandJanSchuemann. Energyoptimizationingoldnanopar- ticle enhanced radiation therapy.Phys. Med. Biol., 63:135001, 2018
2018
-
[27]
Nuclear Energy Agency.PENELOPE 2018: A code system for Monte Carlo simulation of electron and photon transport. 2019. doi: https: //doi.org/https://doi.org/10.1787/32da5043-en
2018 doi
-
[28]
Fernández-Varea.penEasy (v2024-03-13) for PENELOPE 2018: User Manual, 2024
Josep Sempau and José M. Fernández-Varea.penEasy (v2024-03-13) for PENELOPE 2018: User Manual, 2024. Monte Carlo simulation extension for PENELOPE
2018
-
[29]
Taylor & Francis Group, LLC, 2022
Pedro Andreo Gavin Poludniowski, Artur Omar.Calculating X-ray Tube Spectra: Analytical and Monte Carlo Approaches. Taylor & Francis Group, LLC, 2022
2022
-
[30]
ICRU (1989), tissue substitutes in radiation dosimetry and measure- ment, report 44 of the international commission on radiation units and measurements (bethesda, md).https://physics.nist.gov/ PhysRefData/XrayMassCoef/tab2.html
1989
-
[31]
Rabus, D
H. Rabus, D. Bolst, M. Bravin, B. Gérard, M. Jan Sikora, D. T. Lath- rop, J. Létang, J. A. Lohner, F. Matsinos, R. L. McCurdy, M. Peu- celle, M. Rasouli, F. Schneider, S. Vatnitsky, and C. Wunderer. In- tercomparison of monte carlo simulation approaches for dosimetry of nanopa...
2021 doi
-
[32]
Biological consequences of nanoscale energy deposition near irradiated heavy atom nanoparticles.Scientific reports, 1:18, 2011
Stephen J McMahon et al. Biological consequences of nanoscale energy deposition near irradiated heavy atom nanoparticles.Scientific reports, 1:18, 2011. doi: 10.1038/srep00018
2011 doi
-
[33]
Carlson, Ramin Abolfath, and Wu Liu
Huagang Yan, David J. Carlson, Ramin Abolfath, and Wu Liu. Micro- dosimetric investigation and a novel model of radiosensitization in the presence of metallic nanoparticles.Pharmaceutics, 13(12):2191, 2021. doi: 10.3390/pharmaceutics13122191. URLhttps://www.mdpi.com/ 1999-4923...
2021 doi
-
[34]
W.B. Li, A. Belchior, M. Beuve, Y.Z. Chen, S. Di Maria, W. Friedland, B.Gervais, B.Heide, N.Hocine, A.Ipatov, A.P.Klapproth, C.Y.Li, J.L. Li, G. Multhoff, F. Poignant, R. Qiu, H. Rabus, B. Rudek, J. Schue- mann, S. Stangl, E. Testa, C. Villagrasa, W.Z. Xie, and Y.B. Zhang. Int...
2020
-
[35]
X-ray Data for the Elements: Au, 2025
IXAS. X-ray Data for the Elements: Au, 2025. URLhttps://xraydb. xrayabsorption.org/element/Au
2025
-
[36]
S. T. Perkins, D. E. Cullen, M. H. Chen, J. Rathkopf, J. Scofield, and J. H. Hubbell. Tables and graphs of atomic subshell and relaxation data derived from the llnl evaluated atomic data library (eadl), z = 1–100. Technical Report UCRL-50400 Vol. 30, Lawrence Livermore Nationa...
1991 doi
-
[37]
Interplay between the gold nanoparticle sub-cellular localization, size, and the photon energy for radiosensitization.Sci
Eli Lechtman and Jean-Philippe Pignol. Interplay between the gold nanoparticle sub-cellular localization, size, and the photon energy for radiosensitization.Sci. Rep., 7:13268, 2017. doi: 10.1038/ s41598-017-13736-y
2017
-
[38]
Pásztor, Marco Durante, and Pavel Kundrátek
Benjamin Schmidt, Jérôme Biscans, Valeria Pini, Pooja Singh, Flo- rian Gaasch, Jens Hauswald, Dario Greco, Alberto Bravin, Ferenc J. Pásztor, Marco Durante, and Pavel Kundrátek. Quantifying radiosen- sitisation of psma-targeted gold nanoparticles on prostate cancer cells at me...
2022
-
[39]
Effect of photon energy, gold nanoparticle size and concen- tration on the dose enhancement in radiation therapy.BioImpacts, 3 (1):29–35, 2013
Alireza Mesbahi, Zahra Jamali, Shahram Ghahramani, and Mehdi Nasseri. Effect of photon energy, gold nanoparticle size and concen- tration on the dose enhancement in radiation therapy.BioImpacts, 3 (1):29–35, 2013. doi: 10.5681/bi.2013.004
2013 doi
-
[40]
Z. R. Prieskorn, J. E. Hill, P. E. Kaaret, and J. K. Black. Photoelectron track length distributions measured in a negative ion time projection chamber.IEEE Trans. Nucl. Sci., 61(2):894–900, 2014. doi: 10.1109/ TNS.2014.2312107. 40
2014
-
[41]
J. F. Williamson. Monte carlo evaluation of kerma at a point for photon transportproblems.Medical Physics, 14(4):567–576, 1987. doi: 10.1118/ 1.596069
1987
-
[42]
Stegun, editors.Handbook of Math- ematical Functions with Formulas, Graphs, and Mathematical Tables
Milton Abramowitz and Irene A. Stegun, editors.Handbook of Math- ematical Functions with Formulas, Graphs, and Mathematical Tables. Dover Publications, New York, 1965. ISBN 978-0486612720
1965
-
[43]
A simulation study on the radiosensitization proper- ties of gold nanorods.Physics in Medicine & Biology, 69(4):045029,
Ali Taheri, Mayeen Uddin Khandaker, Farhad Moradi, and David An- drew Bradley. A simulation study on the radiosensitization proper- ties of gold nanorods.Physics in Medicine & Biology, 69(4):045029,
-
[2024]
URLhttps://doi.org/10
doi: 10.1088/1361-6560/ad2380. URLhttps://doi.org/10. 1088/1361-6560/ad2380. 41
Reviewed August 7, 2026 · model on record in the stance chip above.
Discussion (0). Sign in to comment.