REVIEW 4 major objections 7 minor 36 references
Stochastic Modeling of Road Hazards on Intersections and their Effect on Safety of Autonomous Vehicles
T0 review · 4 major / 7 minor · reviewed 2026-08-07 · deepseek-v4-flash
Pith's one-line read The paper claims that an autonomous vehicle's probability of a serious or minor accident can be computed from a continuous-time Markov chain over eight driving states, and that in the authors' parameterization the driving policy's failure…
desk verdict A solid, honest extension of the authors' earlier AV safety model that earns a serious referee, with the main caveat being the unvalidated exponential sojourn assumption and proprietary data. read the letter →
The pith
A machine-rendered reading of the paper's core claim, the machinery that carries it, and where it could break.
The reading
What carries the argument
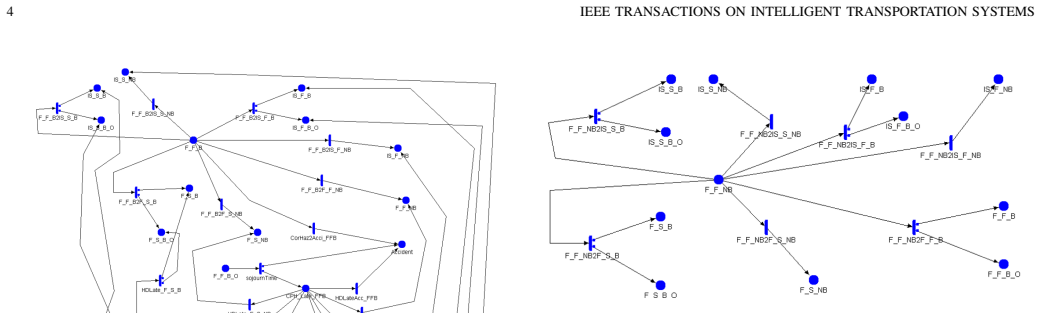
The central object is a hierarchical Stochastic Activity Network that behaves, at its top level, as a continuous-time Markov chain over eight states defined by three binary attributes—road segment (free vs intersection), speed (fast vs slow), and hazard presence (braking vs non-braking)—with exponential sojourn times and transition rates estimated from a naturalistic driving dataset by counting observed transitions. Each of the four braking states is refined by an atomic model with sub-states for correct, missed, and late hazard detection, plus absorbing Accident places whose severity (serious vs minor) is fixed by whether the vehicle is fast or slow; non-braking states have no accident paths. Sharing places between atomic models is the mechanism that lets a vehicle move between high-level states and, at the same time, lets a hazard escalate or resolve within a braking episode. The machinery's job is to convert quantities that cannot be measured directly (the long-run probability of a fatal accident) into functions of parameters that either can be counted from driving data or can be swept in sensitivity analysis to reveal which unknown dominates.
What would settle it
Re-run the model with the same dataset but replace the exponential sojourn-time assumption with a non-exponential fit (for instance a Weibull or lognormal distribution with the same observed mean for each of the 56 transitions) and compare the predicted probability of a serious accident over a 9100-hour mission; if the two predictions stay within the same order of magnitude the exponential assumption is benign, and if they diverge sharply it is not. A sterner test: once enough accident records exist for the same roads, compare the model's predicted accident probabilities per operating condition against those observed rates.
Extended reading notes
Core claim
The paper's central claim is that stochastic modeling can explicitly accommodate a set of different operating conditions within an ODD and quantify the likelihood of a serious or minor accident over a driving mission, while identifying which AV failures dominate. The model is a stochastic activity network whose top level is a Markov chain over eight states—free/intersection, fast/slow, braking/non-braking—with exponentially distributed sojourn times; sharing of sub-states lets each high-level state carry its own atomic model of hazard handling (detected on time, overlooked, detected late) and of escalation to an absorbing Accident state. Estimated partly from a proprietary naturalistic driving dataset (transition rates among the eight states) and partly from sensitivity analysis over plausible ranges (accident and failure rates that no dataset can measure), the model produces several concrete findings: serious accidents arise only in fast braking states; the same perception failure probability affects safety differently depending on road condition, with free fast driving being the most safety-critical; the driving-policy failure rate, even at values as low as $10^{-6}$, shapes accident probability more than perception failure probabilities of $10^{-3}$ to $10^{-4}$; and the delay before an overlooked hazard is detected has negligible impact compared with the policy failure rate. The authors present the tool as a way to allocate reliability requirements to subsystems early in design and to form an initial safety claim to be combined with later empirical evidence.
Load-bearing premise
The load-bearing premise is that the time a vehicle spends in each of the eight driving states follows an exponential distribution, so the whole system is a continuous-time Markov chain; if real sojourn times deviate substantially from exponential, the computed accident probabilities and the ranking of which failures matter most could be wrong.
Editorial extensions
If this is right
- Driving-policy reliability, including safety monitors, is the dominant determinant of AV accident probability in the authors' parameterization, so a designer choosing where to invest should put the failure rate of policy plus monitor foremost.
- Perception budgets should be allocated by operating condition rather than globally: the same perception-failure probability hurts most in fast free driving, then fast intersections, then slow intersections, then slow free driving.
- Operating conditions inside an ODD can be handled explicitly as states of one model instead of separate analyses, and the authors argue the same recipe scales to hundreds or thousands of conditions, with parameter estimation as the main cost.
- Sensitivity analysis identifies which parameters demand accurate estimation (hazard-overlook probability, policy failure rate) and which only need ballpark bounds (late-detection delay), steering data-collection effort accordingly.
- The approach supplies a quantitative basis for forming an initial safety claim prior to mass deployment, to be combined with—rather than replaced by—observed safe-driving evidence.
Reading between the lines
- A direct stress test follows from the paper's own data: seven of the 56 transition types never occurred in the dataset and four occurred only one to four times, so their estimated rates are extremely uncertain; re-solving the model with a rare, safety-relevant transition rate varied across its plausible range would show whether the conclusions survive that uncertainty.
- The exponential-assumption risk could be checked cheaply by fitting a Weibull, lognormal, or phase-type distribution to the recorded sojourn durations (of the kind shown in Table I), re-solving the model, and comparing accident probabilities—a check the authors do not perform.
- Because the model only counts accidents triggered by hazards that the vehicle failed to handle, its estimates are deliberately silent on accidents that perfect automation could not avoid (the authors note this in a footnote), so comparing its predictions with real accident statistics requires a like-for-like filter rather than a direct comparison.
- The same eight-state scheme could be turned into a dynamic safety-assessment loop by re-estimating transition rates from fleet data per region or season, making the ODD explicit and time-varying in a way that current regulation does not yet require.
Editorial analysis
A structured set of objections, weighed in public.
Referee Report
Summary. The paper extends a previously published stochastic model of AV safety to cover eight high-level driving states defined by road type (free/intersection), speed (fast/slow), and hazard status (braking/non-braking), with atomic sub-models for perception and driving-policy failures. Transition rates among the eight states are estimated from a proprietary naturalistic driving dataset under an exponential sojourn-time assumption, and five sets of sensitivity studies vary perception failure probabilities, driving-policy failure rates, late-detection rates, and combined failure modes. The model is solved with the Mobius tool to produce probabilities of serious and minor accidents over mission times up to 9100 hours. The paper claims that this constitutes an ODD-aware quantitative safety assessment method that can identify which AV subsystem failures dominate the accident probability.
Significance. If the quantitative claims are taken at face value, the paper offers a substantial step toward model-based, ODD-sensitive AV safety assessment and a useful framework for sensitivity analysis and subsystem reliability allocation. The strengths are the explicit decomposition of hazards into fast/slow and intersection/free conditions, the use of naturalistic transition counts, the availability of the model artifact in [17], and the careful separation of serious and minor accident severities. The sensitivity studies are clearly structured and give actionable insights, such as the dominance of driving-policy failure over perception failure in the chosen parameter ranges. However, the paper's central quantitative assertion, that the model can 'quantify the likelihood of the occurrence of a fatal accident,' is not yet supported: the exponential-sojourn assumption is unvalidated, several central parameters are arbitrary or taken from prior work without derivation, the estimated rates lack uncertainty bounds, and no validation against observed accident or near-miss data is provided.
major comments (4)
- [§III-C1, Table V] The paper's quantitative outputs depend on the CTMC assumption that all high-level sojourn times are exponentially distributed, with rates estimated from counts. No goodness-of-fit test, dispersion check, or comparison against non-exponential families is reported, and the dwell-time data behind Table I are not summarized as distributions. Because sojourn times in braking, intersection, and free-flow states are physical durations governed by geometry, speed, and traffic, a materially non-exponential shape would change exposure timing and hence the computed accident probabilities and sensitivity rankings in Studies 1–5. At minimum, the authors should test the exponential hypothesis on their dataset, report empirical coefficients of variation, and show how the results change under a fitted non-exponential alternative (e.g., Weibull or phase-type), or explicitly restrict the central claim to a conditional illustration under this assumption.
- [Table V, Appendix A] The transition rates are estimated from very small counts: seven transitions never occurred and four occurred between 1 and 4 times, yet rates such as 1800 h−1 are derived from two observations and the model is solved with these point estimates. No confidence intervals or Bayesian posterior intervals are given, and the paper does not specify whether zero-count transitions are assigned zero rate, treated as impossible, or omitted entirely; each choice is a substantive modeling decision that affects the CTMC. This uncertainty propagates into every numerical result in Section IV. The authors should provide interval estimates for all rates, state a defensible rule for handling zero and rare counts (e.g., Bayesian shrinkage or explicit exclusion), and report how the accident probabilities vary within the resulting rate ranges.
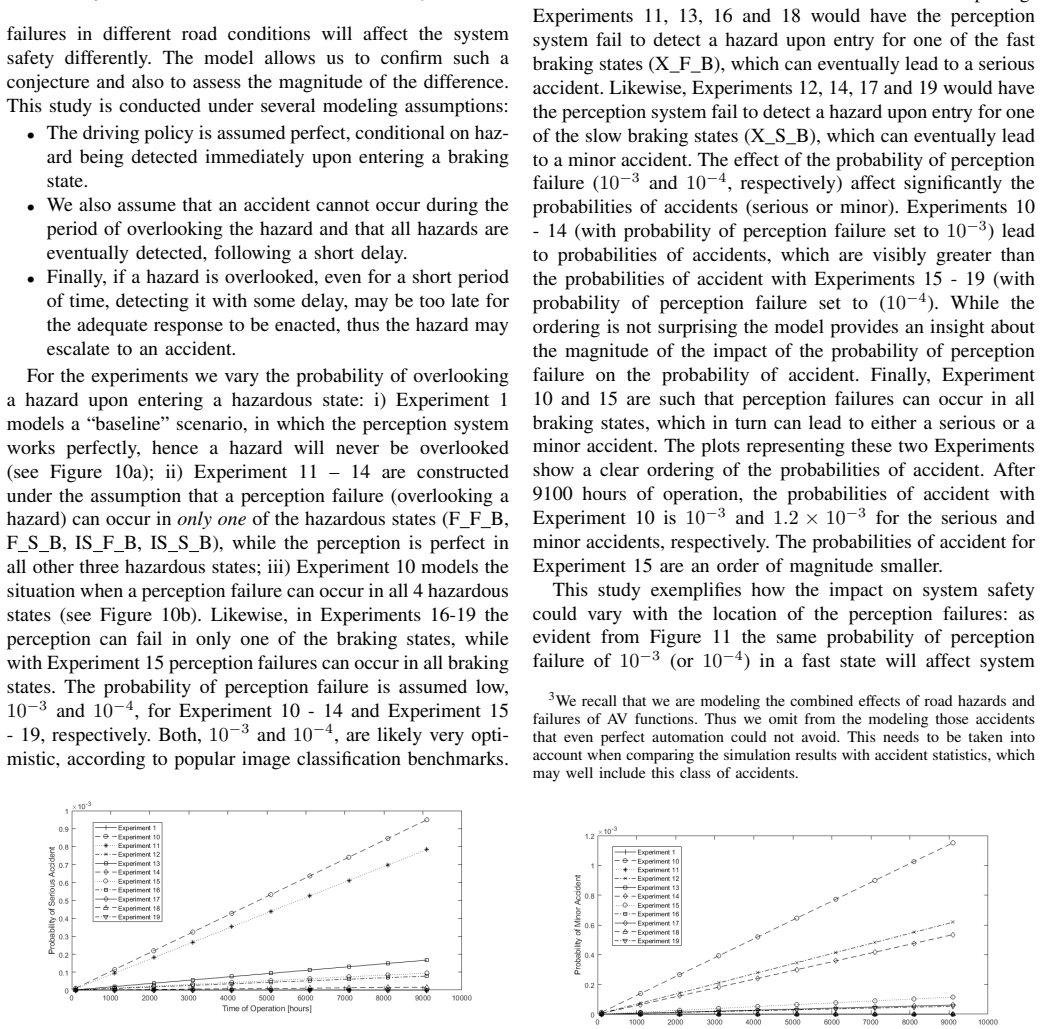
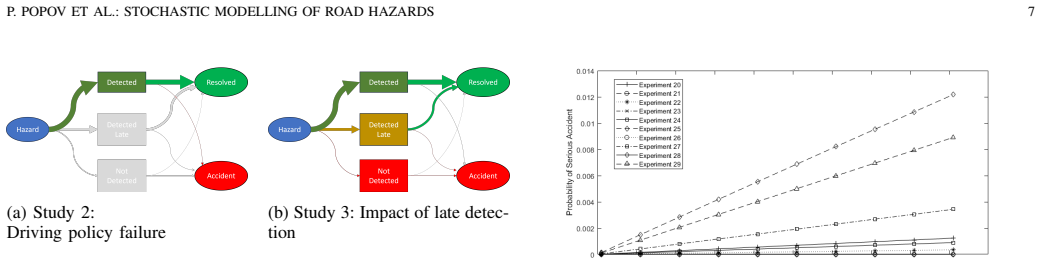
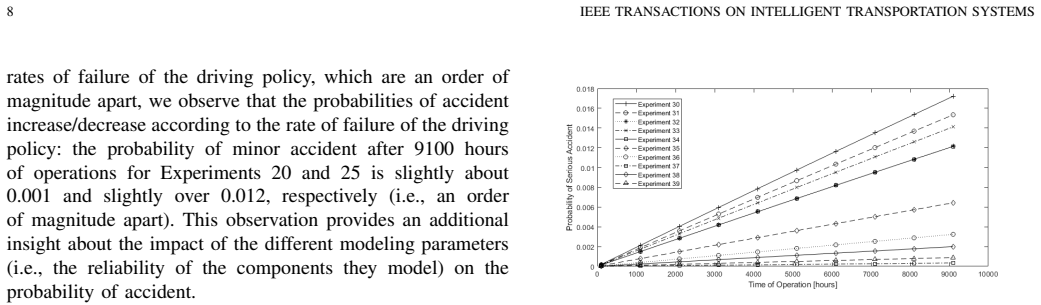
- [§IV, §V, Table III] Several load-bearing parameters are assigned values without data: the perception-overlook probabilities 10−3 and 10−4, the driving-policy failure rates 10−6 and 10−5, the accident rates after late detection 10−5, and the sojournTime values in Table III taken from [8] without derivation or uncertainty. The sensitivity studies are valuable as comparative experiments, but the absolute probabilities reported after 9100 hours (e.g., 0.012 serious accidents for Experiment 25) are conditional on these choices. The paper should calibrate these parameters to data where possible or explicitly present all absolute probabilities as illustrative conditional numbers, and it should soften the implicit validation in the Discussion's comparison with human-driver accident rates.
- [§III-C1, §V] The transition rates are estimated from human naturalistic driving, but the model is used to predict AV safety. Driving style, speed profiles, and hazard exposure of an AV can differ systematically from those of human drivers, and the paper does not discuss the resulting bias. Because the high-level sojourn times and transition probabilities directly determine exposure to hazards, the authors should justify the transfer of human exposure statistics to AVs, treat this transfer as an additional sensitivity parameter, or state it as a limitation of the quantitative predictions.
minor comments (7)
- [Figures 14 and 15] The captions say 'Experiments 21–29' while the text discusses Experiments 20–29; please check whether Experiment 20 is omitted from the figures or the captions are wrong.
- [Figures 19 and 20] The captions say 'Experiments 41–45' but Study 4 describes Experiments 40–49; the captions should match the experiment numbering.
- [Table V] The rate column is blank for zero-count transitions; specify whether the rate is 0, unestimated, or the transition is considered physically impossible.
- [Figure 4] The caption mentions that deceleration can happen in a non-braking situation, but the text defines a braking state as requiring at least 2 m/s² deceleration; clarify how the dataset assigns the braking label.
- [§V, footnote 3] Footnote 3 concedes that accidents unavoidable even with perfect automation are omitted from the model, yet the Discussion compares the model's figures with human accident rates without applying this caveat; state the comparison condition explicitly.
- [§III-B, Figure 7] Terms such as 'CPH Late FFB' and the shared-place mechanism are not defined in the body of the paper; define them at first use or provide a more self-contained explanation.
- [§V] The statement that perception delay has a negligible effect is based on Studies 3–4, but the explored delay variation is narrow (a factor of two in Study 3); either broaden the range or phrase the conclusion more cautiously.
Circularity Check
No significant circularity: accident probabilities are computed forward from independently estimated parameters; no fitted quantity is renamed as a prediction.
full rationale
The derivation chain is a forward stochastic simulation. The 56 high-level transition rates are estimated from a proprietary naturalistic driving dataset (Tables II and V) and used as continuous-time Markov chain rates; the accident probabilities in Studies 1–5 are then obtained by transient solution of the SAN/CTMC model, with no fitting to observed accident frequencies. Accident outcomes are not among the inputs: the dataset contains no accident events, and the paper explicitly treats accident-related parameters as unknown and explores them via sensitivity analysis (§III-C3). The dependence on the authors' prior paper [8] supplies some atomic-model parameters (sojournTime, Table III) and the modeling approach, but this is a distinct, externally published predecessor, and its parameter values are inputs, not the output being claimed. The exponential-sojourn assumption in §III-C1 and the acknowledged open problem of reliable parameter estimation (§VII) are validation/accuracy concerns, not circularity: they affect whether the numeric accident probabilities are correct, not whether the derivation reduces to its own assumptions. No equation is defined in terms of the target quantity, and no fitted parameter is presented as a prediction. Therefore no circular steps can be exhibited.
Assumptions & free parameters
free parameters (6)
- High-level transition rates (56 values) =
example: rate IS F NB2F F NB = 948.25 h^-1
- Perception failure probability (overlooking hazard) =
10^-3, 10^-4, 10^-5, 10^-6 across experiments
- Driving policy failure rate conditional on timely detection =
10^-5 or 10^-6 h^-1
- Driving policy failure rate conditional on late detection =
2e-5, 2e-6, 1e-4, 1e-3, etc.
- Accident rate after late hazard detection =
0 to 1e-5 h^-1
- sojournTime in braking atomic models =
FFB 4500, FSB 2250, ISFB 2250, ISSB 1225 h^-1
assumptions (6)
- domain assumption Transition sojourn times are exponentially distributed.
- domain assumption All road hazards are captured by the braking states; non-braking states are non-hazardous.
- domain assumption Model parameters are stationary over time.
- domain assumption The 8 high-level states and Markov transitions capture the relevant ODD.
- domain assumption Accidents that even perfect automation could not avoid are excluded.
- domain assumption The proprietary dataset is representative of the target ODD.
Cite this review
Pith. "Pith review of Stochastic Modeling of Road Hazards on Intersections and their Effect on Safety of Autonomous Vehicles." pith.science (2026). https://pith.science/paper/6IIX7RUE
@misc{pith2026250602688,
  author       = {Pith},
  title        = {Pith review of: Stochastic Modeling of Road Hazards on Intersections and their Effect on Safety of Autonomous Vehicles},
  year         = {2026},
  howpublished = {\url{https://pith.science/paper/6IIX7RUE}},
  note         = {Machine review of arXiv:2506.02688}
}
read the original abstract
Autonomous vehicles (AV) look set to become common on our roads within the next few years. However, to achieve the final breakthrough, not only functional progress is required, but also satisfactory safety assurance must be provided. Among those, a question demanding special attention is the need to assess and quantify the overall safety of an AV. Such an assessment must consider on the one hand the imperfections of the AV functionality and on the other hand its interaction with the environment. In a previous paper we presented a model-based approach to AV safety assessment in which we use a probabilistic model to describe road hazards together with the impact on AV safety of imperfect behavior of AV functions, such as safety monitors and perception systems. With this model, we are able to quantify the likelihood of the occurrence of a fatal accident, for a single operating condition. In this paper, we extend the approach and show how the model can deal explicitly with a set of different operating conditions defined in a given ODD.
Figures


Figures from the paper (12 more)






Reference graph
Works this paper leans on
-
[8]
Modelling road hazards and the effect on A V safety of hazardous failures,
C. Buerkle, F. Oboril, M. Paulitsch, P. Popov, and L. Strigini, “Modelling road hazards and the effect on A V safety of hazardous failures,” inIEEE 25th International Conference on Intelligent Transportation Systems , Macau, China, 2022, pp. 1886–1893
work page 2022
-
[17]
P. Popov, “A V IntersectionModels.” [Online]. Available: https:// openaccess.city.ac.uk/id/eprint/33200/
-
[1]
ISO/IEC, Road vehicles — Functional safety , ser. ISO 26262 - (1- 12):2018. ISO/TC 22/SC 32 Electrical and electronic components and general system aspects, 2018
work page 2018
-
[2]
Electrical and electronic equipment
ISO, ISO/PAS 21448:2019, Road vehicles — Safety of the intended functionality, ser. Electrical and electronic equipment. ISO, 2019
work page 2019
-
[3]
VT/ITS - Intelligent Transportation Systems
IEEE, IEEE P2846, IEEE Draft Standard for Assumptions for Models in Safety-Related Automated Vehicle Behavior , ser. VT/ITS - Intelligent Transportation Systems. IEEE SA, 2020
work page 2020
-
[4]
Electrical and electronic equipment
ISO, ISO/PAS 8800:2024, Road vehicles — Safety and artificial intelli- gence, ser. Electrical and electronic equipment. ISO, 2024
work page 2024
-
[5]
U. D. Fabio, M. Broy, and R. Br ¨ungger, Ethics commission automated and connected driving . Germany: Federal Ministry of Transport and Digital Infrastructure of the Federal Republic of Germany, 2017
work page 2017
-
[6]
N. Kalra and S. Paddock, “Driving to Safety: How Many Miles of Driving Would It Take to Demonstrate Autonomous Vehicle Reliability,” Transportation Research Part A: Policy and Practice , vol. 94, pp. 182– 193, 2016
work page 2016
Show all 36 references
-
[7]
Validation of Ultra-High Dependability for Software-based Systems,
B. Littlewood and L. Strigini, “Validation of Ultra-High Dependability for Software-based Systems,” Communications of the ACM , vol. 36, no. 11, pp. 69–80, 1993
1993
-
[9]
London, UK: BSI Standards Limited, 2020
BSI, PAS 1883:2020 Operational Design Domain (ODD) taxonomy for an automated driving system (ADS) - Specification . London, UK: BSI Standards Limited, 2020. State Count # Model variable Rate [h −1] IS S B2IS S NB 276 rate IS S B2IS S NB 646.87 IS S B2IS F B 0 rate IS S B2IS F ...
2020
-
[10]
On a formal model of safe and scalable self-driving cars,
S. Shalev-Shwartz, S. Shammah, and A. Shashua, “On a formal model of safe and scalable self-driving cars,” arXiv preprint arXiv:1708.06374, 2017
2017 arXiv
-
[11]
Safe Perception: A Hierarchical Monitor Approach,
C. Buerkle, F. Oboril, J. Burr, and K.-U. Scholl, “Safe Perception: A Hierarchical Monitor Approach,” in 2022 IEEE 25th International Conference on Intelligent Transportation Systems (ITSC) . IEEE, 2022, pp. 71–78
2022
-
[12]
RSS+: Pro-Active Risk Mitigation for A V Safety Layers based on RSS,
F. Oboril and K.-U. Scholl, “RSS+: Pro-Active Risk Mitigation for A V Safety Layers based on RSS,” in 2021 IEEE Intelligent Vehicles Symposium (IV). IEEE, 2021, pp. 99–106
2021
-
[13]
MTBF Model for A Vs - From Perception Errors to Vehicle-Level Failures,
F. Oboril, C. Buerkle, A. Sussmann, S. Bitton, and S. Fabris, “MTBF Model for A Vs - From Perception Errors to Vehicle-Level Failures,” in IEEE Intelligent Vehicles Symposium (IV) , Aachen, Germany, 2022
2022
-
[14]
NHTSA - Traffic Safety Facts 2019,
“NHTSA - Traffic Safety Facts 2019,” 2019
2019
-
[15]
Exploration of Vehicle Impact Speed – Injury Severity Relationships for Application in Safer Road Design,
C. Jurewicz, A. Sobhani, J. Woolley, J. Dutschke, and B. Corben, 14 IEEE TRANSACTIONS ON INTELLIGENT TRANSPORTATION SYSTEMS “Exploration of Vehicle Impact Speed – Injury Severity Relationships for Application in Safer Road Design,” Transportation Research Procedia, vol. 14, pp...
2016
-
[16]
Stochastic Activity Networks: Formal Definitions and Concepts,
W. H. Sanders and J. F. Meyer, “Stochastic Activity Networks: Formal Definitions and Concepts,” in Lectures on Formal Methods and Perfor- mance Analysis, ser. Lecture Notes in Computer Science, B. E., H. H., and K. JP., Eds. Springer, Berlin, Heidelberg, 2001
2001
-
[18]
The highD Dataset: A Drone Dataset of Naturalistic Vehicle Trajectories on German High- ways for Validation of Highly Automated Driving Systems,
R. Krajewski, J. Bock, L. Kloeker, and L. Eckstein, “The highD Dataset: A Drone Dataset of Naturalistic Vehicle Trajectories on German High- ways for Validation of Highly Automated Driving Systems,” in 2018 IEEE International Conference on Intelligent Transportation Systems (I...
2018
-
[19]
UDO Transport, Reported road casualties Great Britain, annual report:
-
[20]
An introduction to the safety force field,
D. Nist ´er, H.-L. Lee, J. Ng, and Y . Wang, “An introduction to the safety force field,” NVIDIA White Paper, 2019
2019
-
[21]
Continuous Learning Approach to Safety Engineering,
R. Johansson and P. Koopman, “Continuous Learning Approach to Safety Engineering,” in CARS - Critical Automotive applications: Ro- bustness & Safety , Zaragoza, Spain, 2022, p. 5
2022
-
[22]
US Department of Transportation, 2022
NHTSA, Summary Report: Standing General Order on Crash Reporting for Automated Driving Systems . US Department of Transportation, 2022
2022
-
[23]
Towards a safety case for hardware fault tolerance in convolutional neural networks using activation range supervision,
F. Geissler, S. Qutub, S. Roychowdhury, A. Asgari, Y . Peng, A. Dhama- sia, R. Graefe, K. Pattabiraman, and M. Paulitsch, “Towards a safety case for hardware fault tolerance in convolutional neural networks using activation range supervision,” arXiv, vol. 8, 2021
2021
-
[24]
Preliminary interdependency analysis: An approach to support critical- infrastructure risk-assessment,
R. E. Bloomfield, P. Popov, K. Salako, V . Stankovic, and D. Wright, “Preliminary interdependency analysis: An approach to support critical- infrastructure risk-assessment,” Reliability Engineering & System Safety, vol. 167, pp. 198–217, 2017
2017
-
[25]
Models of reliability of fault-tolerant software under cyber- attacks,
P. Popov, “Models of reliability of fault-tolerant software under cyber- attacks,” in The 28th IEEE International Symposium on Software Relia- bility Engineering (ISSRE’2017) , Toulouse, France, 2017, pp. 228–239
2017
-
[26]
A review of models relevant to road safety,
B. Hughes, S. Newstead, A. Anund, C. Shu, and T. Falkmer, “A review of models relevant to road safety,” Accident Analysis and Prevention , vol. 74, pp. 250–270, 2015
2015
-
[27]
Model-Based Probabilistic Collision Detection in Autonomous Driving,
M. Althoff, O. Stursberg, and M. Buss, “Model-Based Probabilistic Collision Detection in Autonomous Driving,” IEEE Transactions on Intelligent Transportation Systems, vol. 10, no. 2, pp. 299–310, 2009
2009
-
[28]
Safety assessment of driving behavior in multi-lane traffic for autonomous vehicles,
——, “Safety assessment of driving behavior in multi-lane traffic for autonomous vehicles,” in IEEE Intelligent Vehicles Symposium , Xi’an, China, 2009
2009
-
[29]
Comparison of Markov Chain Abstraction and Monte Carlo Simulation for the Safety Assessment of Autonomous Cars,
M. Althoff and A. Mergel, “Comparison of Markov Chain Abstraction and Monte Carlo Simulation for the Safety Assessment of Autonomous Cars,” IEEE Transactions on Intelligent Transportation Systems, vol. 12, no. 4, pp. 1237–1247, 2011
2011
-
[30]
The Infeasibility of Experimental Quantifi- cation of Life-Critical Software Reliability,
R. Butler and G. Finelli, “The Infeasibility of Experimental Quantifi- cation of Life-Critical Software Reliability,” in ACM SIGSOFT ’91 Conference on Software for Critical Systems , ser. ACM SIGSOFT Software Eng. Notes, vol. 16, no. 5, New Orleans, Louisiana, 1991
1991
-
[31]
Conservative Confidence Bounds in Safety, from Generalised Claims of Improvement & Statistical Ev- idence,
K. Salako, L. Strigini, and X. Zhao, “Conservative Confidence Bounds in Safety, from Generalised Claims of Improvement & Statistical Ev- idence,” in 2021 51st Annual IEEE/IFIP International Conference on Dependable Systems and Networks (DSN) , 2021
2021
-
[32]
The Unnecessity of Assuming Statistically Independent Tests in Bayesian Software Reliability Assessments,
K. Salako and X. Zhao, “The Unnecessity of Assuming Statistically Independent Tests in Bayesian Software Reliability Assessments,” IEEE Transactions on Software Engineering , vol. 49, no. 4, pp. 2829–2838, 2023
2023
-
[33]
Bootstrapping confidence in future safety from past safe operation,
P. Bishop, A. Povyakalo, and L. Strigini, “Bootstrapping confidence in future safety from past safe operation,” in 33rd IEEE International Sym- posium on Software Reliability Engineering (ISSRE’2022) , Charlotte, 2021
2022
-
[34]
Building a Credible Case for Safety: Waymo’s Approach for the Determination of Absence of Unreasonable Risk,
F. Favaro, L. Fraade-Blanar, S. Schnelle, T. Victor, M. Pe˜na, J. Engstrom, J. Scanlon, K. Kusano, and D. Smith, “Building a Credible Case for Safety: Waymo’s Approach for the Determination of Absence of Unreasonable Risk,” arXiv, vol. 38, 2023
2023
-
[35]
Comparison of Waymo Rider-Only Crash Data to Human Benchmarks at 7.1 Million Miles,
K. D. Kusano, J. M. Scanlon, Y .-H. Chen, T. L. McMurry, R. Chen, T. Gode, and T. Victor, “Comparison of Waymo Rider-Only Crash Data to Human Benchmarks at 7.1 Million Miles,” Traffic Injury Prevention, vol. 25, no. sup1, pp. S66–S77, 2024. Cornelius Buerkle is a Research Scie...
2024
-
[2020]
National statistics, 2021
2021
Reviewed August 7, 2026 · model on record in the stance chip above.
Discussion (0). Sign in to comment.