REVIEW 3 major objections 5 minor 29 references
CARTGen-IR: Synthetic Tabular Data Generation for Imbalanced Regression
T0 review · 3 major / 5 minor · reviewed 2026-08-07 · deepseek-v4-flash
Pith's one-line read This paper introduces CARTGen-IR, a threshold-free CART-based synthetic sampler for imbalanced regression that weights rare target values, resamples them, and generates new rows column-by-column from tree leaves; the reported experiments…
desk verdict Solid empirical contribution but the 'generally superior' claim overreaches due to selective configuration reporting and a one-vs-one Bayesian test. read the letter →
The pith
A machine-rendered reading of the paper's core claim, the machinery that carries it, and where it could break.
The reading
What carries the argument
The load-bearing object is the sequential, attribute-wise CART generator: for each column, a decision tree is fit with that column as target and only earlier columns as predictors; a new synthetic row begins with the first column drawn from the whole pool (root node) and each later column by routing through the tree to a leaf and sampling a value from the leaf's members, using a Gaussian kernel density estimate for continuous attributes. Rarity weighting (DenseWeight or relevance function, raised to an exponent and normalized) selects which original rows to resample, with an optional jitter on duplicates. The trees are fit once on the resampled data and reused for every synthetic case, so generation is transparent and does not depend on the synthetic rows already produced.
What would settle it
Permute the order of the feature columns on a dataset with known strong interactions, run CARTGen-IR with fixed hyperparameters, and measure SERA; if some orders degrade sharply or the advantage over plain resampling disappears, the sequential column-order assumption is doing the work.
Extended reading notes
Core claim
The paper's central claim is that a decision-tree generator, CARTGen-IR, is a strong data-level method for imbalanced regression. It weights each target value by rarity (DenseWeight or relevance), resamples the original data so rare rows dominate, then builds a separate CART for each feature using only earlier features as predictors and draws new values from leaf nodes, smoothing continuous variables with a Gaussian kernel. In experiments across 15 datasets, 56 preprocessing configurations, and three regressors, the method matches or beats leading resamplers such as WSMOTER, KNNOR-REG, and G-SMOTER on imbalanced-regression metrics, and is about 131 times faster on average than the deep generative models tested, while avoiding arbitrary target thresholds.
Load-bearing premise
The method assumes that generating features in a fixed column order, with each feature depending only on earlier features, captures the real joint distribution; if that order hides important interactions, the synthetic rows can be unrealistic even when the resampling weights are right.
Editorial extensions
If this is right
- Because CARTGen-IR needs no user threshold on the target, the same resampling recipe applies whether the rare values are high, low, or both, without redefining a cutoff per dataset.
- The method can be inserted into standard preprocessing pipelines for regressors such as Random Forest, SVR, and XGBoost, improving imbalanced-regression metrics (SERA, RW-RMSE) on rare cases while keeping RMSE comparable.
- Its execution time is orders of magnitude below deep generative models (about 131 times faster on average in the reported experiments), making it practical for larger tabular data.
- Its white-box tree structure allows a practitioner to inspect exactly which leaf nodes produced the synthetic rows, supporting auditability that GAN, VAE, and diffusion approaches lack.
Reading between the lines
- Because the generation is sequential in a fixed column order, the choice of column order likely matters; the authors report no permutation sensitivity analysis, so a prudent user would permute columns and check whether the reported advantage holds.
- The rarity-weighting step is plug-in, so the same CART generation machinery could be combined with weights from domain knowledge or cost-sensitive objectives; this extension is implicit in the framework and untested.
- The benchmark datasets mostly define rarity through extreme tails; whether the method also helps for rare mid-range intervals (a plateau in the target density) is an open question the authors themselves flag as future work.
Editorial analysis
A structured set of objections, weighed in public.
Referee Report
Summary. The manuscript proposes CARTGen-IR, a data-level synthetic data generation method for imbalanced regression. Rarity weights are computed via DenseWeight or a relevance function, the dataset is resampled with replacement according to those weights, and synthetic rows are generated by fitting one CART per attribute in a fixed order and sampling from leaf nodes, with Gaussian KDE smoothing for continuous features. The method is evaluated on 15 benchmark datasets with three learners (RF, SVR, XGBoost) and compared against classical resamplers and deep generative models under repeated 2x5-fold cross-validation, using RMSE, RW-RMSE, and SERA, plus a runtime comparison. The paper claims that CARTGen-IR is generally superior to state-of-the-art methods and offers a strong balance between efficiency and predictive performance.
Significance. If the empirical claims were fully supported, this would be a useful contribution: a threshold-free, interpretable, and computationally efficient data-level method for imbalanced regression that is competitive with deep generative models. The experimental infrastructure is substantial, with 15 datasets, three learners, nested cross-validation, statistical tests, and a runtime analysis, and the authors make code and results available. However, the headline comparison is weakened by post-hoc selection of CARTGen-IR configurations and by internal inconsistencies in the reported configuration counts, so the significance of the claimed superiority cannot be assessed as the manuscript stands.
major comments (3)
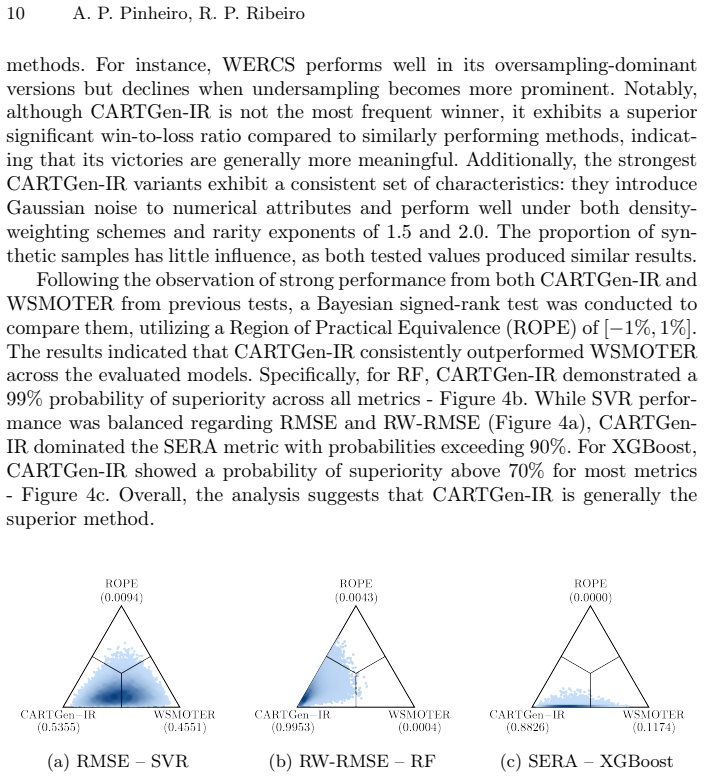
- [§4.2, Fig. 3] Figure 3 reports only the six best-performing CARTGen-IR configurations out of 16 tested, while all competitor configurations are shown; no selection rule is stated, and the six appear to have been chosen after inspecting results. This post-hoc selection biases the win/loss analysis in favor of CARTGen-IR and does not support the sentence 'Overall, the analysis suggests that CARTGen-IR is generally the superior method.' The subsequent Bayesian signed-rank test is also post-hoc: it compares CARTGen-IR with WSMOTER only because both performed well in earlier tests, uses a ROPE of [-1%, 1%], and applies no correction for the many configurations and baselines examined. Please report results for all configurations (or use a pre-specified inner-CV selection rule) and temper the superiority claim accordingly.
- [§3, Algorithm 1] The sequential attribute-wise generation is an autoregressive factorization with a fixed column order: the first attribute is sampled from its marginal pool, and every later attribute is conditioned only on previously generated attributes. This is a strong structural assumption about the joint distribution; if the first attribute is high-cardinality or strongly interacting, synthetic rows can be unrealistic even when rarity weights are correct. The paper acknowledges this indirectly in the conclusion ('alternative methods can be employed to capitalize on the interactions between features'), but the abstract's claim of generating 'realistic tabular samples across heterogeneous features and non-linear interactions' is load-bearing. No sensitivity analysis over attribute ordering is reported; please add one (e.g., random or permuted orders with distributional fidelity or downstream performance checks) or restrict the generality claims.
- [§4.1, Table 2 and §4.2] The configuration counts are internally inconsistent. Table 2 defines 2x3x2x2 = 24 CARTGen-IR configurations (rho x alpha x eta x delta), while the text and Figure 3 say '16 tested' and 'six best-performing configurations (out of 16 tested).' The total of '56 resampling configurations' also does not match the sum of Table 2 under either count (53 with 16 CARTGen-IR configurations, 61 with 24). Please correct the counts and clarify whether some hyperparameter combinations were excluded and why; this matters because the reported number of configurations is part of the post-hoc selection issue.
minor comments (5)
- [§3, FitCARTModels description] The text says the trees are 'derived solely from the original data,' but Algorithm 1 calls FitCARTModels on the resampled dataset (Xnew, Ynew), which can contain duplicate rows and is not the original data; please reconcile this wording with the algorithm.
- [§4.3] The statement that CARTGen-IR 'ranks the highest overall' appears inconsistent with §4.2's statement that WSMOTER is 'the most consistent performer' and CARTGen-IR 'ranks fourth in overall consistency'; please rephrase to avoid contradiction.
- [§4.2, Fig. 6] The claim that CARTGen-IR is 'the second fastest' should be stated more precisely as 'second fastest among synthetic-data generators,' since RU, RO, and WERCS are sampling-only methods and are faster by construction.
- [§4.2, Fig. 5] The sensitivity analysis in Figure 5 uses an unnamed 'representative regression dataset'; please identify the dataset explicitly so the reader can judge the generality of those results.
- [§4.2] The code repository is mentioned as 'SynthTabularDataGeneration-IR' but no URL is provided; please include a working link or persistent identifier.
Circularity Check
No circularity: CARTGen-IR's claims are empirical comparisons; the synthetic generation procedure is defined independently of the evaluation metrics, and the only author-related citation (the relevance function [22]) is an externally published, non-exclusive input.
full rationale
CARTGen-IR is an empirical method paper, not a derivation chain, so there is no equation-level reduction of a predicted quantity to an input. The synthetic generation procedure is defined independently: rarity weights come from DenseWeight [24] or the relevance function [22], and the CART-based sequential attribute generation is described procedurally in Section 3 and Algorithm 1. The evaluation metrics SERA and RW-RMSE are relevance-weighted, but they are applied uniformly to all compared strategies, so favoring a method that also uses a relevance function is not a by-construction equivalence; the paper explicitly tests both weighting schemes, including the non-relevance DenseWeight alternative. The sequential attribute-wise CART factorization is a fixed-order conditional model, but that is a modeling assumption and a potential limitation, not a circularity: the paper does not define the target result in terms of that ordering, and it even acknowledges in the conclusion that alternative learners and feature-interaction mechanisms could be explored. The post-hoc reporting of the six best CARTGen-IR configurations out of 16 tested is a selection-bias concern that can inflate apparent performance, but it is not a fitted parameter renamed as a prediction, and it does not reduce the comparative claim to an identity. The only self-citation of note is [22], co-authored by one of the current authors and used for both the relevance weighting scheme and the SERA metric; however, it is an established, externally falsifiable method, the paper also implements DenseWeight, and the central claim of competitiveness is an empirical outcome rather than a consequence implied by the citation. Overall, no circular step is identifiable by the paper's own equations or definitions.
Assumptions & free parameters
free parameters (6)
- Rarity exponent alpha =
1.0, 1.5, 2.0
- Sampling proportion eta =
0.5, 0.75
- Noise level delta =
0.001, 0
- Weight scheme rho =
denseweight, relevance
- Resampled case count Nre = floor(N/5) =
floor(eta * |Y| / 5)
- Attribute ordering =
natural column order
assumptions (5)
- standard math CART leaf sampling approximates the conditional distribution of the target attribute given the splitting variables.
- ad hoc to paper Sequential factorization of the joint distribution by a fixed variable order is valid for generating realistic mixed-type tabular data.
- domain assumption DenseWeight and the relevance function correctly identify rare and relevant target regions.
- domain assumption Resampling with replacement weighted by rarity, followed by fitting CART on the resampled set, concentrates synthetic samples in rare regions without distorting feature relationships.
- ad hoc to paper Gaussian jitter on duplicate rows improves generalization without materially changing the data distribution.
Cite this review
Pith. "Pith review of CARTGen-IR: Synthetic Tabular Data Generation for Imbalanced Regression." pith.science (2026). https://pith.science/paper/264DXOCG
@misc{pith2026250602811,
  author       = {Pith},
  title        = {Pith review of: CARTGen-IR: Synthetic Tabular Data Generation for Imbalanced Regression},
  year         = {2026},
  howpublished = {\url{https://pith.science/paper/264DXOCG}},
  note         = {Machine review of arXiv:2506.02811}
}
read the original abstract
Handling imbalanced target distributions in regression poses a persistent challenge, as the underrepresentation of relevant target values can significantly hinder model performance. Existing data-level solutions often adapt classification-oriented techniques, introducing arbitrary thresholds over the continuous target and leading to artificial and potentially misleading problem formulations. Deep generative models offer flexible sample synthesis but are computationally intensive and difficult to interpret. We propose a CART-based synthetic sampling method specifically designed for imbalanced regression on tabular data. The method integrates relevance- and density-guided sampling to address sparse target regions without thresholding, and employs a feature-driven tree structure to generate realistic tabular samples across heterogeneous features and non-linear interactions. Experiments on benchmark datasets for extreme-value prediction show that the proposed approach is competitive with state-of-the-art resampling and generative methods while offering faster execution and greater transparency. These results highlight its potential as a scalable and interpretable data-level strategy for improving regression models in imbalanced domains.
Figures


Figures from the paper (4 more)



Reference graph
Works this paper leans on
-
[1]
JMIR Medical Informatics12, e55118 (2024)
Akiya, I., Ishihara, T., Yamamoto, K.: Comparison of synthetic data generation techniques for control group survival data in oncology clinical trials: simulation study. JMIR Medical Informatics12, e55118 (2024)
work page 2024
-
[2]
Remote Sensing of Environment281, 113220 (2022)
Alerskans, E., Zinck, A., Nielsen-Englyst, P., Høyer, J.: Exploring machine learning techniques to retrieve sea surface temperatures from passive microwave measure- ments. Remote Sensing of Environment281, 113220 (2022)
work page 2022
-
[3]
Expert Systems with Applica- tions252, 124118 (2024)
Belhaouari, S., Islam, A., Kassoul, K., Al-Fuqaha, A., Bouzerdoum, A.: Oversam- pling techniques for imbalanced data in regression. Expert Systems with Applica- tions252, 124118 (2024)
work page 2024
-
[4]
ACM Computing Surveys49, Article 31 (2016)
Branco, P., Torgo, L., Ribeiro, R.: A survey of predictive modeling on imbalanced domains. ACM Computing Surveys49, Article 31 (2016)
work page 2016
-
[5]
Branco, P., Torgo, L., Ribeiro, R.: SMOGN: a pre-processing approach for imbal- anced regression. In: Proceedings of the 1st International Workshop on Learning with Imbalanced Domains: Theory and Applications. pp. 36–50 (2017)
work page 2017
-
[6]
Neurocomputing343, 76–99 (2019)
Branco, P., Torgo, L., Ribeiro, R.: Pre-processing approaches for imbalanced distri- butions in regression. Neurocomputing343, 76–99 (2019)
work page 2019
-
[7]
Version 0.1.6, available via PyPI (2025) 14 A
Branco, P., Tulon, S.: imbalance-metrics: A Python package for evaluating imbal- anced datasets. Version 0.1.6, available via PyPI (2025) 14 A. P. Pinheiro, R. P. Ribeiro
work page 2025
-
[8]
Breiman, L., Friedman, J., Olshen, R., Stone, C.: Classification and Regression Trees. Chapman, New York (1984)
work page 1984
Show all 29 references
-
[9]
Caiola, G., Reiter, J.P.: Random Forests for Generating Partially Synthetic, Cate- gorical Data. Trans. Data Privacy 3(1), 27–42 (2010)
2010
-
[10]
Expert Systems with Applications193, 116387 (2022)
Camacho, L., Douzas, G., Bacao, F.: Geometric SMOTE for regression. Expert Systems with Applications193, 116387 (2022)
2022
-
[11]
Applied Intelligence54, 8789–8799 (2024)
Camacho, L., Bacao, F.: WSMOTER: a novel approach for imbalanced regression. Applied Intelligence54, 8789–8799 (2024)
2024
-
[12]
JAIR16, 321–357 (2002)
Chawla, N., Bowyer, K., Hall, L., Kegelmeyer, W.: SMOTE: Synthetic Minority Over-sampling Technique. JAIR16, 321–357 (2002)
2002
-
[13]
In: IEEE International Joint Conference on Neural Networks
He, H., Bai, Y., Garcia, E., Li, S.: ADASYN: Adaptive synthetic sampling ap- proach for imbalanced learning. In: IEEE International Joint Conference on Neural Networks. pp. 1322–1328 (2008)
2008
-
[14]
Com- putational Statistics & Data Analysis52, 5186–5201 (2008)
Hubert, M., Vandervieren, E.: An adjusted boxplot for skewed distributions. Com- putational Statistics & Data Analysis52, 5186–5201 (2008)
2008
-
[15]
In: Proceedings of the 40th International Con- ference on Machine Learning (ICML’23)
Kotelnikov, A., Baranchuk, D., Rubachev, I., Babenko, A.: TabDDPM: Modelling tabular data with diffusion models. In: Proceedings of the 40th International Con- ference on Machine Learning (ICML’23). Article No. 725, pp. 1–16 (2023)
2023
-
[16]
Scientific Reports12(2022)
Lenhof,K.,Eckhart,L.,Gerstner,N.,Kehl,T.,Lenhof,H.:Simultaneousregression and classification for drug sensitivity prediction using an advanced random forest method. Scientific Reports12(2022)
2022
-
[17]
Processes12, 375 (2024)
Liu, X., Tian, H.: Research on imbalanced data regression based on confrontation. Processes12, 375 (2024)
2024
-
[18]
arXiv:2409.05215 (2024)
Panagiotou, E., Roy, A., Ntoutsi, E.: Synthetic tabular data generation for class imbalance and fairness: A comparative study. arXiv:2409.05215 (2024)
2024 arXiv
-
[19]
In: 2016 IEEE International Conference on Data Science and Advanced Analytics (DSAA)
Patki, N., Wedge, R., Veeramachaneni, K.: The Synthetic Data Vault. In: 2016 IEEE International Conference on Data Science and Advanced Analytics (DSAA). pp. 399–410 (2016)
2016
-
[20]
Jour- nal of Official Statistics21(2005)
Reiter, J.: Using CART to generate partially synthetic, public use microdata. Jour- nal of Official Statistics21(2005)
2005
-
[21]
Department of Computer Science, Faculty of Sciences, University of Porto (2011)
Ribeiro, R.: Utility-based Regression. Department of Computer Science, Faculty of Sciences, University of Porto (2011)
2011
-
[22]
Ma- chine Learning109, 1803–1835 (2020)
Ribeiro, R., Moniz, N.: Imbalanced regression and extreme value prediction. Ma- chine Learning109, 1803–1835 (2020)
2020
-
[23]
Philosophical Transactions of the Royal Society A: Mathematical, Physical and Engineering Sciences379(2021)
Schultz, M., Betancourt, C., Gong, B., Kleinert, F., Langguth, M., Leufen, L., Mozaffari, A., Stadtler, S.: Can deep learning beat numerical weather prediction?. Philosophical Transactions of the Royal Society A: Mathematical, Physical and Engineering Sciences379(2021)
2021
-
[24]
Machine Learning110, 2187–2211 (2021)
Steininger, M., Kobs, K., Davidson, P., Krause, A., Hotho, A.: Density-based weighting for imbalanced regression. Machine Learning110, 2187–2211 (2021)
2021
-
[25]
arXiv preprint arXiv:2412.07039 (2024)
Stocksieker, S., Pommeret, D., Charpentier, A.: Data augmentation with varia- tional autoencoder for imbalanced dataset. arXiv preprint arXiv:2412.07039 (2024)
2024 arXiv
-
[26]
Information Sciences642, 119157 (2023)
Tian, H., Tian, C., Li, K., Jia, W.: Unbalanced regression sample generation algo- rithm based on confrontation. Information Sciences642, 119157 (2023)
2023
-
[27]
In: Progress in Artificial Intelligence
Torgo, L., Ribeiro, R., Pfahringer, B., Branco, P.: SMOTE for regression. In: Progress in Artificial Intelligence. pp. 378–389 (2013)
2013
-
[28]
Expert Systems32, 465–476 (2015)
Torgo, L., Branco, P., Ribeiro, R., Pfahringer, B.: Resampling strategies for regres- sion. Expert Systems32, 465–476 (2015)
2015
-
[29]
arXiv preprint arXiv:1907.00503 (2019)
Xu,L.,Skoularidou,M.,Cuesta-Infante,A.,Veeramachaneni,K.:Modelingtabular data using conditional GAN. arXiv preprint arXiv:1907.00503 (2019)
2019 arXiv
Reviewed August 7, 2026 · model on record in the stance chip above.
Discussion (0). Sign in to comment.