REVIEW 2 major objections 7 minor 22 references
Partially Regularized Ordinal Regression to Adjust Teams' Scoring for Strength of Schedule and Complementary Unit Performance in American Football
T0 review · 2 major / 7 minor · reviewed 2026-08-07 · deepseek-v4-flash
Pith's one-line read Complementary football is measurable: turnovers and field position shift next-drive scoring.
desk verdict A solid applied paper with a genuine method tweak and a plausible headline finding, but the causal reading of the complementary-football effects needs to answer an endogeneity challenge before I'd trust the projections. read the letter →
The pith
A machine-rendered reading of the paper's core claim, the machinery that carries it, and where it could break.
The reading
What carries the argument
The machinery is a cumulative-logit ordinal regression with partial regularization: drive outcomes are ordered as defensive touchdown, safety, no score, field goal, and offensive touchdown, and the log cumulative odds are modeled through unpenalized team offense and defense margins, home-field and game-context terms, plus complementary statistics from the preceding drive such as a turnover indicator and post-turnover starting position. An elastic-net penalty with a partially relaxed proportional-odds assumption selects which complementary features matter, while a binarized surrogate residual check verifies fit for each cumulative-odds equation separately.
What would settle it
Refit the main model with each previous-drive complementary statistic instrumented by a source of variation the offense cannot control, such as weather, referee crew, or the opponent's health, and check whether the turnover and field-position coefficients collapse toward zero.
Extended reading notes
Core claim
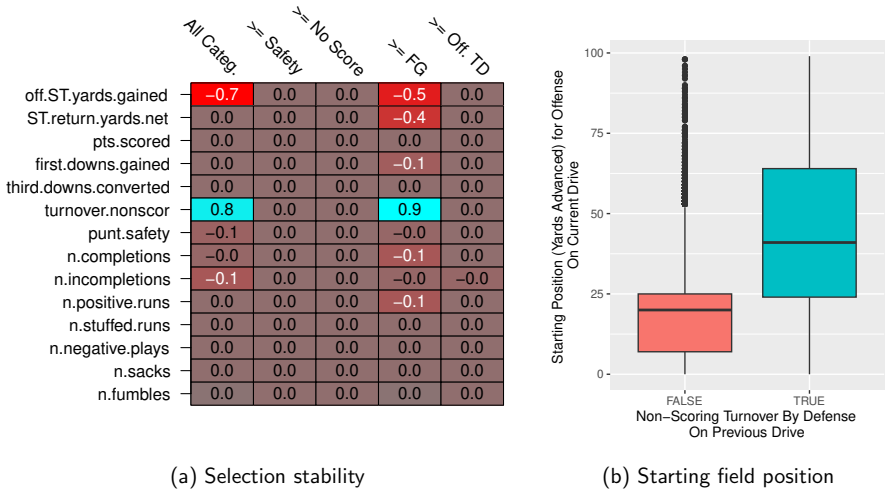
The central claim is that complementary football is measurable and consequential: after accounting for opponent strength, home field, and game context, the defense's non-scoring turnovers and the field position they create for the next drive are the stable features that raise the offense's probability of scoring, especially the chance of scoring at least a field goal. The paper shows this with a flexible ordinal model in which team-strength coefficients stay unpenalized, so strength of schedule is fully adjusted, while complementary-feature coefficients are selected under a near-LASSO elastic-net penalty that also lets some effects vary by scoring category. When team performances are projected onto a league-average complementary unit, offenses backed by good defenses are downgraded and offenses backed by poor defenses are upgraded, with larger single-game shifts than season-long shifts. Out of sample, the model with complementary features beats models using only game context and strength of schedule on mean absolute error of expected points per drive.
Load-bearing premise
The model assumes the previous drive's complementary statistics, especially turnovers and starting field position, are exogenous to the current drive's scoring once team, home-field, and game-context effects are controlled, even though those statistics are produced by the opponent's offense against the team's own defense.
Editorial extensions
If this is right
- Team offensive and defensive ratings become conditional statements: they describe scoring ability given a league-average complementary unit, not scoring ability in isolation.
- Rankings can shift when complementary-unit quality is accounted for, as with the 2012 Giants dropping from third to eighth and the 2011 Texans from seventh to thirteenth in NFL offensive points per drive.
- The value of turnovers comes largely from starting field position near field-goal range, so models that count turnovers without field position miss most of the effect.
- Complementary adjustments are larger for single games than for full seasons, making them especially relevant for game-level evaluation.
- Strength-of-schedule adjustments remain the dominant season-long correction, especially in college football, but complementary features add predictive value on top.
Reading between the lines
- If the exogeneity assumption fails, meaning a team's own previous-drive performance correlates with the complementary statistics it faces, the estimated turnover and field-position effects would partly reflect team quality and the projected ranking shifts would need re-interpretation.
- The same modeling template could transfer to other sequential team sports where a defensive stop creates possession, such as rugby, though the two-way-player caveat makes the complementary-unit adjustment conceptually messier.
- Because point values are assigned only after the ordinal model is fit, an ordinal likelihood that incorporates actual point values could sharpen estimates at the extremes such as safeties and two-point conversions.
- Comparing these complementary-unit-adjusted ratings against sportsbook or market point spreads would show whether the adjustment is already priced into public evaluations.
Editorial analysis
A structured set of objections, weighed in public.
Referee Report
Summary. The paper develops a partially regularized ordinal regression model for drive-level scoring in American football. Using play-by-play data from the NFL (2009–2017) and FBS college football (2014–2020), the model includes unpenalized team offensive and defensive ratings for strength-of-schedule adjustment, home-field and game-context controls, and elastic-net-penalized lagged "complementary football" statistics from the preceding drive, with non-proportional odds allowed for the penalized features. The authors select non-scoring turnovers and post-turnover starting position as the most consistent complementary features, project each team's expected points per drive onto a league-average opponent, complementary unit, and home/away split, and compare out-of-sample mean absolute error of models with and without complementary features. They also extend the ordinalNet package and the surrogate residual approach to the partial non-proportional odds setting.
Significance. If the identification concerns are addressed, the paper would offer a practical adjustment for complementary football in team ratings and a useful extension of partial regularization for ordinal outcomes with many unpenalized fixed effects. Strengths include the use of drive-level sequential data, two-league replication, selection-stability analysis across CV replicates, out-of-sample evaluation, bootstrap confidence intervals for projections, and public data and source code on GitHub. The methodological modifications to ordinalNet and the surrogate residual diagnostics are clearly described and could benefit other applications.
major comments (2)
- [Sections 2.5, 2.6, and 2.8] The exogeneity assumption for the lagged complementary statistics is load-bearing but untested. In Eq. (1), x*_ji(k-1)l is produced by team j's offense against team i's defense, yet the model includes only team i's offensive fixed effect α_i and team j's defensive fixed effect β_j. Team i's defensive quality and team j's offensive quality are omitted. Consequently, the γ and γ_s coefficients may absorb persistent correlation between a team's offensive and defensive strengths, or game-script effects, rather than a purely sequential complementary effect. The paper's causal language in the Discussion ("the football statistics that proved to be most important in impacting the complementary unit") and the projection of teams onto a league-average complementary unit in Section 2.7 require that x* be exogenous conditional on the included controls. This is not established. A concrete robustness check would be to refit the model adding team j's offensive fixed effects and team i's defensive fixed effects, or to run a placebo using future (lead) drives instead of the lag, and to report whether the selected features and projection shifts survive.
- [Sections 2.5, 2.6, and 2.8] The feature selection and the out-of-sample evaluation are not nested. In Section 2.5, the complementary features are selected using 10-fold cross-validation within each season; Section 2.6 then refits the model on the same data using only the selected features; Section 2.8 evaluates a fresh 10-fold CV of models that include that pre-selected feature set. Because the feature choice was made using information from all folds in the season, the mean absolute error comparison in Figure 5 and the bootstrap intervals in Tables 2 and 3 do not account for selection uncertainty and may overstate the predictive gain from complementary features. The authors should either use nested CV for the final comparison or hold out entire seasons, and they should report the sensitivity of the bootstrap intervals to the selection step.
minor comments (7)
- [Eq. (2)] The ridge penalty term contains a misplaced parenthesis: it should read ½(1−α)||γ||₂², not ½(1−α||γ||₂²).
- [Section 2.5] The robustness of variable selection to the choice of α is only cited to the supplementary materials; a small table or figure in the main text showing selection stability across the α grid [0.8, 0.9, 0.95, 0.99, 0.999, 0.9999] would strengthen the claim.
- [Section 2.1] The exclusion of 35% of college halves is a substantial data loss; although the authors note the proportion is consistent across seasons and conferences, they should state explicitly in Section 4 that the college-specific projections may be affected by non-random missingness and discuss what sensitivity analyses, if any, were considered.
- [Figure 5 caption] The caption uses "GS" for "game context with strength of schedule" while the text and figure key use "GC"; please unify the abbreviations.
- [Section 2.4] The statement that game-context variables were "statistically significant at the 0.05 level ... for most NFL and college football seasons" is vague; report the exact number of seasons out of nine (NFL) and seven (college) for which each variable was significant.
- [Section 2.2 and Table 1] Standardizing all offensive and defensive touchdowns to 7 points is a simplifying approximation; the manuscript should note explicitly that this collapses the rare 6- and 8-point outcomes and could slightly affect the expected-points weighting and the proportional-odds interpretation.
- [References] Several references, especially Oliver (2011) and Horowitz (2018), lack full retrieval information (URLs or access dates); please complete them for reproducibility.
Circularity Check
No significant circularity: the turnover/field-position findings and out-of-sample gains are genuine CV quantities, and the only self-citation is a non-load-bearing replicability note.
full rationale
The derivation chain is self-contained. Equation (1) is a standard cumulative-logit model in which the current-drive scoring outcome Y_{ijkl} is regressed on team offensive/defensive fixed effects (alpha_i, beta_j), home-field, game-context controls, and centered statistics from the immediately preceding drive (x*_{ji(k-1)l}); these features are predetermined covariates, not functions of the response, so no construction imposes the turnover or field-position result. Feature importance is measured by selection stability across three replicated 10-fold CV partitions per season, and the headline conclusion (non-scoring turnovers and post-turnover starting position are most consistently selected) is a genuine hold-out quantity. The out-of-sample gain in Figure 5 is likewise computed on held-out folds against baseline models that omit complementary features; this is an empirical comparison, not a fitted value relabeled as a prediction. The team-rating shifts in Tables 2-3 are explicitly described as projections of the fitted model onto league-average complementary-unit values, and the paper transparently states in the future-work paragraph that point-value weights are applied post hoc when converting fitted probabilities to expected points; this is model interpretation, not circularity. The only self-citation (Skripnikov 2023) appears in the introduction and discussion as context and as a replicability note comparing game-total versus drive-level findings; the present analysis does not use that prior work as a premise, and the data/code are public, so the citation is not load-bearing. Flagged caveats that keep the score slightly above zero: the TO.nonscor:start.pos interaction was engineered after exploratory evidence (Figure 1b) that starting position matters, so its 100% selection rate is partly confirmatory of the same data; the 10-fold CV in Section 3.5 evaluates a feature set chosen on the same seasons, so the reported improvement carries mild selection optimism; and the lagged complementary statistics x* are produced by the opponent against the current team's own defense, an endogeneity concern for any causal reading. These are correctness/identification limitations, not construction-level circularity: no equation reduces to its own input, and no fitted parameter is presented as an independent prediction.
Assumptions & free parameters
free parameters (5)
- Elastic net mixing weight alpha =
0.99
- Sparse cross-validation lambda =
Season-specific, not reported
- Minimum games threshold for college projections =
5 games
- Touchdown point standardization =
7 points
- Game-context variable inclusion significance level =
0.05
assumptions (8)
- domain assumption Cumulative link ordinal regression is the correct generating model for drive scoring outcomes.
- domain assumption Previous-drive complementary statistics are exogenous to current-drive scoring conditional on team, home-field, and game-context controls.
- domain assumption Excluded college halves are missing at random with respect to team strength and complementary effects.
- domain assumption Proportional odds holds for team, home-field, and game-context coefficients; only complementary features get non-proportional coefficients.
- standard math Centering complementary statistics by league means gives intercept and team coefficients an interpretation as projections onto a league-average complementary unit.
- domain assumption Selection by sparse cross-validation followed by unpenalized refit yields honest estimates of the selected effects.
- standard math The elastic net with alpha equal to 0.99 has a unique optimum.
- domain assumption Drive-level observations are conditionally independent.
Cite this review
Pith. "Pith review of Partially Regularized Ordinal Regression to Adjust Teams' Scoring for Strength of Schedule and Complementary Unit Performance in American Football." pith.science (2026). https://pith.science/paper/JHVJO5NZ
@misc{pith2026250603057,
  author       = {Pith},
  title        = {Pith review of: Partially Regularized Ordinal Regression to Adjust Teams' Scoring for Strength of Schedule and Complementary Unit Performance in American Football},
  year         = {2026},
  howpublished = {\url{https://pith.science/paper/JHVJO5NZ}},
  note         = {Machine review of arXiv:2506.03057}
}
read the original abstract
American football is unique in that offensive and defensive units typically consist of separate players who don't share the field simultaneously, which tempts one to evaluate them independently. However, a team's offensive and defensive performances often complement each other. For instance, turnovers forced by the defense can create easier scoring opportunities for the offense. Using drive-by-drive data from 2014-2020 Division-I college football (Football Bowl Subdivision, FBS) and 2009-2017 National Football League (NFL) seasons, we identify complementary football features that impact scoring the most. We employ regularized ordinal regression with an elastic penalty, enabling variable selection and partially relaxing the proportional odds assumption. Moreover, given the importance of accounting for strength of the opposition, we incorporate unpenalized components to ensure full adjustment for strength of schedule. For residual diagnostics of our ordinal regression models we apply the surrogate approach, creatively extending its use to non-proportional odds models. We then adjust each team's offensive (defensive) performance to project it onto a league-average complementary unit, showcasing the effects of these adjustments on team scoring. Lastly, we evaluate the out-of-sample prediction performance of our selected model, highlighting improvements gained from incorporating complementary football features alongside strength-of-schedule adjustments.
Figures


Figures from the paper (3 more)


Reference graph
Works this paper leans on
-
[1]
Kharrat, and I
Boshnakov, G., T. Kharrat, and I. G. McHale (2017). A bivariate weibull count model for forecasting association football scores. International Journal of Forecasting\/ 33\/ (2), 458--466
2017
-
[2]
Christensen, R. H. B. (2022). ordinal---regression models for ordinal data. R package version 2022.11-16. https://CRAN.R-project.org/package=ordinal
work page 2022
-
[3]
Edwards, J. and D. Archambault (1979). The home field advantage. Sports, games, and play: Social and psychological viewpoints\/ , 409--438
work page 1979
-
[4]
Fox, J. and G. Monette (1992). Generalized collinearity diagnostics. Journal of the American Statistical Association\/ 87\/ (417), 178--183
work page 1992
-
[5]
Gilani, S., A. Easwaran, J. Lee, and E. Hess (2022). cfbfastr: The sportsdataverse's r package for college football data. R package version 1.9.0
work page 2022
-
[6]
Govan, A. Y., A. N. Langville, and C. D. Meyer (2009). Offense-defense approach to ranking team sports. Journal of Quantitative Analysis in Sports\/ 5\/ (1)
work page 2009
-
[7]
Greenwell, B. M., A. J. McCarthy, B. C. Boehmke, and D. Liu (2018). Residuals and diagnostics for binary and ordinal regression models: an introduction to the sure package. R J.\/ 10\/ (1), 381
work page 2018
-
[8]
Harville, D. (1977). The use of linear-model methodology to rate high school or college football teams. Journal of the American Statistical Association\/ 72\/ (358), 278--289
work page 1977
Show all 22 references
-
[9]
Horowitz, M. (2018). Detailed nfl play-by-play data 2009-2018. https://www.kaggle.com/datasets/maxhorowitz/nflplaybyplay2009to2016
2018
-
[10]
Kennedy, and A
Kempton, T., N. Kennedy, and A. J. Coutts (2016). The expected value of possession in professional rugby league match-play. Journal of sports sciences\/ 34\/ (7), 645--650
2016
-
[11]
Liu, D. and H. Zhang (2018). Residuals and diagnostics for ordinal regression models: a surrogate approach. Journal of the American Statistical Association\/ 113\/ (522), 845--854
2018
-
[12]
McGovern, C. (2013). A closer look at touchdowns in the red zone. https://www.footballoutsiders.com/stat-analysis/2013/closer-look-touchdowns-red-zone
2013
-
[13]
Oliver, D. (2004). Basketball on paper: rules and tools for performance analysis . Potomac Books, Inc
2004
-
[14]
Oliver, D. (2011). Guide to the total quarterback rating. ESPN. com\/
2011
-
[15]
R: A language and environment for statistical computing
R Core Team (2020). R: A language and environment for statistical computing. R Foundation for Statistical Computing. Version 4.0.3
2020
-
[16]
Shea, S. M. (2014). Basketball analytics: Spatial tracking . CreateSpace Independent Publishing Platform
2014
-
[17]
Skripnikov, A. (2023). Partially constrained group variable selection to adjust for complementary unit performance in american college football. Journal of Applied Statistics\/ , 1--15
2023
-
[18]
Vergin, R. C. and J. J. Sosik (1999). No place like home: an examination of the home field advantage in gambling strategies in nfl football. Journal of Economics and Business\/ 51\/ (1), 21--31
1999
-
[19]
Wilson, R. L. (2020). College football overtime outcomes: implications for in-game decision-making. Frontiers in Artificial Intelligence\/ 3 , 61
2020
-
[20]
Wurm, M. J., P. J. Rathouz, and B. M. Hanlon (2021). Regularized ordinal regression and the ordinalNet R package. Journal of Statistical Software\/ 99\/ (6), 1--42
2021
-
[21]
Ventura, and M
Yurko, R., S. Ventura, and M. Horowitz (2019). nflwar: a reproducible method for offensive player evaluation in football. Journal of Quantitative Analysis in Sports\/ 15\/ (3), 163--183
2019
-
[22]
Zou, H. and T. Hastie (2005). Regularization and variable selection via the elastic net. Journal of the royal statistical society: series B (statistical methodology)\/ 67\/ (2), 301--320
2005
Reviewed August 7, 2026 · model on record in the stance chip above.
Discussion (0). Sign in to comment.