REVIEW 3 major objections 5 minor 1 cited by
Abundance Effects from Protoplanetary Disk Outflows
T0 review · 3 major / 5 minor · reviewed 2026-08-07 · deepseek-v4-flash
Pith's one-line read The central claim is that the observed abundance differences that scale with condensation temperature are caused by protoplanetary disk outflows removing volatiles more efficiently than refractories, so the patterns are not records of…
desk verdict A new outflow-fractionation mechanism with a testable scaling law, but the paper's no-drift justification is contradicted by its own numbers; worth serious referee attention, not yet a confirmation. read the letter →
The pith
A machine-rendered reading of the paper's core claim, the machinery that carries it, and where it could break.
The reading
What carries the argument
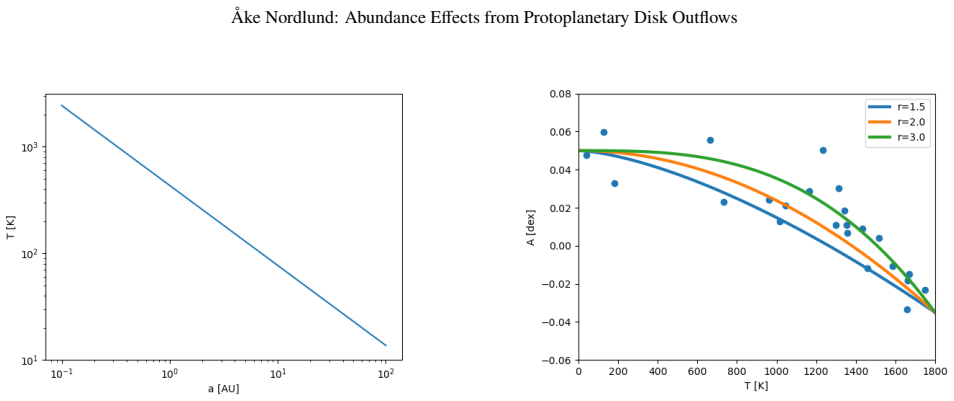
The central object is a semi-analytical protoplanetary disk model with an outflow. It takes a surface density profile $\Sigma \propto a^p$ (with $p=-3/2$ in the standard Minimum Mass Solar Nebula), balances accretion heating against radiative cooling to get a disk temperature $T_{\rm disk} \propto a^{-3/4}$, and follows a gas parcel inward with residence time $dt \propto a^{p+1}\,da$. The abundance of a species changes because the fraction of the local outflow contributed by species already sublimated scales as $f \propto a^q$, so the logarithmic abundance loss rate is $d\ln X_s/dt \sim -f v_K/H$, with $H$ the disk scale height. Integrating from large radius to the sublimation radius $a_s$ gives the paper's governing identity, $\Delta\ln X_s \propto a_s^{p+q-1+3/8} = a_s^{-r} = T_s^{4r/3}$, with a plausible range $1<r<3$. This condensation-temperature power law is what lets the model be compared directly with observed abundance trends.
What would settle it
A concrete check would be a protoplanetary disk simulation with dust-gas drift for realistic grain sizes: if refractory grains drift outward or are entrained into the wind before reaching the inner disk, the predicted refractory overabundance is suppressed, whereas if they stay with the accreting gas the $T_s^{4r/3}$ pattern survives.
Extended reading notes
Core claim
The central claim is that protoplanetary disk outflows remove material with a condensation-temperature-dependent efficiency, leaving the star with a general refractory overabundance relative to its natal material. Because the mass lost in outflows is comparable to the mass that reaches the star, the effect can be a whole-star change of order ten percent or more, with no need to confine the anomaly to a thin surface convection zone. The paper derives the relationship $\Delta\ln X_s \propto T_s^{4r/3}$ with $r$ roughly between 1 and 3, and shows that this single power law, adjusted only in zero point and amplitude, describes the Sun-solar-twin difference, the Sun-CI-chondrite difference, and binary-component differences. The interpretation is that the Sun is simply one member of an ensemble with randomly varying accretion histories, so its slight refractory deficit relative to solar twins and its slight refractory excess relative to CI chondrites are the same phenomenon seen against different reference frames.
Load-bearing premise
The load-bearing premise is that solid grains do not drift relative to the gas, so refractory material is carried inward with the accreting flow while volatile gas is preferentially blown away; if grains drift outward or are lost to the outflow, the enrichment pattern weakens or changes.
Editorial extensions
If this is right
- The Sun's slight refractory overabundance relative to CI chondrites and its refractory deficit relative to the average solar twin are two draws from one distribution of accretion histories, not separate puzzles.
- Abundance differences between components of binaries no longer require planet formation or planet destruction; they follow from the two disks having different accretion and outflow conditions.
- The predicted abundance shifts are whole-star effects, so they do not depend on the mass of a surface convection zone, which removes a long-standing objection to planet-based explanations.
- Because total outflow mass loss is comparable to the accreted mass, abundance shifts of several tens of percent can arise naturally, matching observed amplitudes.
- The similarity of the effect size across solar twins, CI chondrites, and binaries is an expected consequence of one mechanism rather than a coincidence among several.
Reading between the lines
- Beyond the paper, the mechanism implies that refractory overabundance should be a common property of low-mass stars, and its amplitude should correlate with indicators of cumulative accretion and outflow activity, such as protostellar accretion rates or jet momentum, if those can be reconstructed.
- Beyond the paper, if dust grains of realistic sizes drift relative to the gas, the mechanism's efficiency and its element pattern could change, so the model's clean power law doubles as a probe of grain dynamics in disks.
- Beyond the paper, the same differential volatile loss would also change the composition of the gas and solids that eventually form planets, suggesting a possible link between stellar abundance anomalies and the volatile budgets of exoplanets that the paper does not develop.
Editorial analysis
A structured set of objections, weighed in public.
Referee Report
Summary. The paper proposes that protoplanetary disk outflows, which are an unavoidable accompaniment of disk accretion, carry away gas with an efficiency that depends on condensation temperature, leaving the accreting star enriched in refractory elements. Starting from a standard MMSN-like disk model, the author derives a scaling law ΔlnX_s ∝ T_s^{4r/3}, where the exponent r is related to an assumed power-law radial dependence of the outflow mass-loading fraction, f ∼ a^q. This prediction is then compared by eye, with free amplitude and zero point, to three datasets: the Sun versus solar twins (Meléndez et al. 2009), the Sun versus CI chondrites (Asplund et al. 2021), and abundance differences between binary components (Ramírez et al. 2015). The author concludes that the observed condensation-temperature-dependent abundance differences are a natural outcome of star formation itself, rather than a signature of planet formation.
Significance. If the central claim holds, the paper offers a single, physically motivated mechanism that simultaneously explains three seemingly independent abundance patterns, and it would shift the interpretation of refractory-enrichment trends away from planet formation and toward the star formation process. The derivation of Eq. (10) from mass, momentum, and energy scaling is transparent and internally consistent, and the sign of the Sun–CI chondrite difference is a genuine prediction of the model rather than a fit. The paper is also commendably explicit about its limitations: it states that the fits are made by eye and that q, and hence r, is not determined from first principles. However, the load-bearing assumptions—neglect of radial drift and entrainment of solids in outflows—are asserted rather than demonstrated, and the claimed quantitative agreement with observations is not backed by any statistical measure. The paper is therefore a promising conceptual proposal but not yet a quantitatively established explanation.
major comments (3)
- [Section 2] The claim that "the drift of solids with respect to the gas can be neglected" is not supported by the paper's own numbers. Using Eq. (3) with Σ1 = 1700 g cm^-2 and Ṁ = 10^-5 M_sun/yr at 1 AU gives a radial accretion velocity v_a = Ṁ/(2πaΣ) ≈ 40 m/s, not 250 m/s as stated; this is comparable to the ~50–100 m/s headwind radial drift speed for St≈1 grains. Because the mechanism requires refractory solids to remain with the accreting gas until sublimation, a comparable or faster radial drift—and possible entrainment of small grains in the wind-launching layer—changes where and how much fractionation occurs. The manuscript should either quantify these effects or justify their neglect with a calculation or cited disk models.
- [Section 3, Eqs. (9)–(10)] The central scaling ΔlnX_s ∝ T_s^{4r/3} contains a free shape parameter r that is set by the ad hoc assumption f ∼ a^q with -2 < q < 0; no physical model or independent constraint is given for q. The paper then uses r as a fit parameter (r = 1.5, 2, 3 in Fig. 2; r = 2 or 3 for the solar twins; r ≈ 2 in Fig. 4). Thus the shape of the prediction is not fixed a priori, and the statement that the data select an outflow-dominated temperature range is a post-hoc inference. An independent estimate of q, for example from non-ideal MHD wind models, is needed to make the prediction genuinely falsifiable.
- [Section 4, Figs. 2–4] All three comparisons are made by eye, with free overall amplitude, free zero-point offset, and free power index r, as stated in Section 4. No goodness-of-fit, parameter uncertainties, or degeneracies are reported. The claim that the model "reproduces" the trends and magnitudes is therefore not quantitatively established; a simple least-squares fit over a grid of r, with confidence intervals, would materially strengthen the paper. As written, the consistency is plausible but not demonstrated.
minor comments (5)
- [Section 4.1] The heading contains a doubled word: "Sun and and solar twins" should be "Sun and solar twins."
- [Section 1] In the Introduction, "V olatile" should be "Volatile."
- [Section 3] The stated range "1 < r < 3" is slightly inconsistent with the adopted bounds -2 < q < 0, since q = -2 gives r = 3.125; the range should be stated as approximately 1 < r < 3.1 or the q-bounds revised.
- [Section 3, Eq. (10)] The notation a_s^{-r} with r = -(p + q + 3/8) is confusing because r is defined with a sign flip; a sentence connecting this definition to the plotted curves would help the reader.
- [Section 4, Fig. 2 caption] The caption says "normalized predictions," but the normalization procedure (amplitude and zero-point adjustment) is not defined; specify that the curves are arbitrary in amplitude and offset.
Circularity Check
The T_s^{4r/3} 'predictions' are fits: Section 4 adjusts zero point, amplitude, and exponent r by eye, so the claimed reproductions in all three contexts do not independently test the model.
-
fitted input called prediction
[Section 4, first paragraph]
"For simplicity, and since the observational error bars are significant (cf. the original figures), the fits to the observational trend have been made by eye, by adjusting the zero points and total amplitudes, and with the power index r controlling the shape of the curves."
Equation (10) predicts ΔlnX_s ∼ T_s^{4r/3}, but r is adjustable (only loosely bounded by 1<r<3 from the ad hoc f∼a^q mass-loading ansatz), and the zero point and amplitude are free. In Section 4 these three quantities are explicitly adjusted by eye to match each of the three observed datasets. The resulting curves are therefore fits, not predictions; presenting them as 'reproduced' trends converts the fit parameters into apparent confirmation. The only non-fitted elements are the sign of the Sun–CI refractory excess and the general monotonic increase with condensation temperature.
-
fitted input called prediction
[Section 4.1, discussion of Fig. 2]
"The sharply increasing trend for large temperatures indicates a power index in the range -2 to -3 (orange and green curves), a conclusion that is further strengthened by Fig. 4 below."
This sentence uses the observed trend itself to infer the value of the model's free exponent, then cites the same comparison as consistency. Since Section 4 declared r adjustable ('with the power index r controlling the shape'), the curvature match does not test the model; it only reports the fitted slope. The model's scaling family is broad enough to accommodate the data, so the observational 'confirmation' is partly constructed by the choice of r.
full rationale
The core scaling derivation (Eqs. 3–10) is a self-contained argument, and the self-citations (Nordlund et al. 2014; Kuffmeier et al. 2017) are contextual evidence for outflows and typical accretion rates, not load-bearing circular premises. The no-drift assumption in Section 2 is a modeling assumption whose numerical support is questionable, but that is a physical-correctness concern, not a circular reduction to the data. The circularity lies in the comparison section: Eq. 10 has a free exponent r, only weakly bounded by an assumed f∼a^q, and Section 4 explicitly says the zero point, total amplitude, and r were adjusted by eye to match the observed trends. The three 'reproductions' are therefore curve fits presented as predictions. The genuinely independent content is limited to the sign of the Sun–CI refractory excess and the monotonic increase with condensation temperature, while the solar-twin direction is explicitly allowed to go either way. Quantitatively, the slope and amplitude are fixed by the data, so the apparent agreements in Figs. 2–4 do not provide independent confirmation. Score 6 reflects that at least the shape/amplitude content of the central claim reduces to fits of free parameters, while the mechanism and the CI sign retain independent content.
Assumptions & free parameters
free parameters (3)
- q =
implied range -2 < q < 0, with resulting exponent r = 9/8 - q matched to data, roughly r = 2-3
- overall amplitude for each comparison =
not quoted; adjusted by eye
- zero point offset =
not quoted; adjusted by eye
assumptions (6)
- domain assumption MMSN surface density profile Σ = 1700 (a/AU)^-3/2 g cm^-2 (Hayashi 1981)
- domain assumption Optically thick disk with accretion heating balanced by radiative cooling gives T ∝ a^-3/4
- domain assumption Outflow mass loss is comparable to accreted mass (lever arm argument)
- domain assumption Radial drift of solids is negligible
- domain assumption Species sublimate at the radius where disk surface temperature equals their condensation temperature
- ad hoc to paper Outflow mass-loading fraction f scales as a^q with q between -2 and 0
Cite this review
Pith. "Pith review of Abundance Effects from Protoplanetary Disk Outflows." pith.science (2026). https://pith.science/paper/3NVMHDM6
@misc{pith2026250604199,
  author       = {Pith},
  title        = {Pith review of: Abundance Effects from Protoplanetary Disk Outflows},
  year         = {2026},
  howpublished = {\url{https://pith.science/paper/3NVMHDM6}},
  note         = {Machine review of arXiv:2506.04199}
}
read the original abstract
Systematic abundance differences that depend on the condensation temperatures of elements have been observed, in particular for stars similar to the Sun; solar twins and solar analogs. Similar differences have also recently been shown to exist between solar abundances and abundances of refractory elements in primitive chondrites. Numerous mechanisms have been proposed to account for these effects, including also differences observed in binary systems. Rather than relying on specific mechanisms, this paper aims to show that the observed effects are a natural and unavoidable outcome of the star formation process itself, in which the associated outflows (winds and jets) carry away material, with efficiency varying with condensation temperature. By using analysis based on modeling results and scaling laws, the trends and magnitudes of the effects are investigated, in three contexts: 1) with respect to differences between the Sun and solar twins, 2) with respect to differences between the Sun and CI-chondrites, and 3) with respect to differences between members of binaries. It is shown that protoplanetary disk outflows indeed are expected to have differential abundance effects, with trends and magnitudes consistent with observed abundance effects. The qualitative as well as semi-quantitative character of the effects are reproduced, in all three contexts. The results demonstrate that the observed systematic differences are likely results of the disk outflows associated with the accretion process. In contrast to mechanisms relying on the tiny mass of planets leaving an observable signature, outflows carry away masses similar to the entire mass of the star, thus much more easily resulting in differential effects with the magnitudes observed, without for example having to assume that the abundance differences are limited to the convection zones of the stars.
Figures


Forward citations
Cited by 1 Pith paper
-
Is the composition of the Solar atmosphere unusual, and if so, why? Possible interpretations
A review of the 10-20% solar volatile-to-refractory excess relative to solar twins, weighing galactic, protoplanetary, and planetary-ingestion explanations and finding no decisive answer.
Reference graph
Works this paper leans on
-
[1]
M., & Grevesse, N
Asplund, M., Amarsi, A. M., & Grevesse, N. 2021, A&A, 653, A141
2021
-
[2]
L., Meléndez, J., et al
Bedell, M., Bean, J. L., Meléndez, J., et al. 2018, ApJ, 865, 68
2018
-
[3]
Bedell, M. E. 2017, PhD thesis, University of Chicago
work page 2017
-
[4]
2006, Astronomy & Astrophysics, 454, 581
Bonanno, G. 2006, Astronomy & Astrophysics, 454, 581
work page 2006
-
[5]
2004, Astronomy & Astrophysics, 420, 683
Desidera, S., Gratton, R., Scuderi, S., et al. 2004, Astronomy & Astrophysics, 420, 683
work page 2004
- [6]
-
[7]
1981, Progress of Theoretical Physics Supplement, 70, 35
Hayashi, C. 1981, Progress of Theoretical Physics Supplement, 70, 35
1981
-
[8]
Katsova, M. M., Nizamov, B. A., & Shlyapnikov, A. A. 2022, Geomagnetism and Aeronomy, 62, 903
work page 2022
Show all 20 references
-
[9]
2017, ApJ, 846, 7
Kuffmeier, M., Haugbølle, T., & Nordlund, Å. 2017, ApJ, 846, 7
2017
-
[10]
2021, Monthly Notices of the Royal As- tronomical Society, 508, 1227
Liu, F., Bitsch, B., Asplund, M., et al. 2021, Monthly Notices of the Royal As- tronomical Society, 508, 1227
2021
-
[11]
T., Lehmann, C., et al
Liu, F., Murphy, M. T., Lehmann, C., et al. 2022, Monthly Notices of the Royal Astronomical Society [arXiv:2210.09776] Meléndez, J., Asplund, M., Gustafsson, B., & Yong, D. 2009, ApJ, 704, L66
2022 arXiv
-
[12]
Nissen, P. E. 2015, A&A, 579, A52
2015
-
[13]
Nissen, P. E. & Gustafsson, B. 2018, A&A Rev., 26, 6
2018
-
[14]
E., Silva Aguirre, V ., Christensen-Dalsgaard, J., et al
Nissen, P. E., Silva Aguirre, V ., Christensen-Dalsgaard, J., et al. 2017, A&A, 608, A112 Nordlund, Å., Haugbølle, T., Küffmeier, M., Padoan, P., & Vasileiades, A. 2014, in IAU Symposium, V ol. 299, Exploring the Formation and Evolution of Plan- etary Systems, ed. M. Booth, B....
2017
-
[15]
M., Brewer, J
Oh, S., Price-Whelan, A. M., Brewer, J. M., et al. 2018, ApJ, 854, 138
2018
-
[16]
E., Ouyed, R., Fendt, C., & Brandenburg, A
Pudritz, R. E., Ouyed, R., Fendt, C., & Brandenburg, A. 2006, Protostars and Planets V [arXiv:astro-ph/0603592] Ramírez, I., Asplund, M., Baumann, P., Meléndez, J., & Bensby, T. 2010, A&A, 521, A33 Ramírez, I., Khanal, S., Aleo, P., et al. 2015, ApJ, 808, 13
2006 arXiv
-
[17]
K., Edwards, G
Rampalli, R., Ness, M. K., Edwards, G. H., Newton, E. R., & Bedell, M. 2024, ApJ, 965, 176
2024
-
[18]
2017, A&A, 604, L4
Saffe, C., Jofré, E., Martioli, E., et al. 2017, A&A, 604, L4
2017
-
[19]
X., Gan, T., et al
Sun, Q., Wang, S. X., Gan, T., et al. 2025, ApJ, 980, 179 Tucci Maia, M., Meléndez, J., & Ramírez, I. 2014, ApJ, 790, L25
2025
-
[20]
V ., et al
Youngblood, A., Cranmer, S., Kooten, S. V ., et al. 2020, Heliophysics 2050 Workshop [arXiv:2009.05672] Article number, page 5 of 5
2020 arXiv
Reviewed August 7, 2026 · model on record in the stance chip above.
Discussion (0). Sign in to comment.