REVIEW 5 major objections 5 minor 54 references
Short-Term Power Demand Forecasting for Diverse Consumer Types to Enhance Grid Planning and Synchronisation
T0 review · 5 major / 5 minor · reviewed 2026-08-07 · deepseek-v4-flash
Pith's one-line read The paper claims that one generic forecasting model is the wrong frame for short-term grid demand: consumers should first be split into industrial, commercial, and residential types, then given models built on the features that actually…
desk verdict Honest applied forecasting paper, but the central accuracy claim is weakened by post hoc method selection and a threshold change after seeing results; still worth refereeing. read the letter →
The pith
A machine-rendered reading of the paper's core claim, the machinery that carries it, and where it could break.
The reading
What carries the argument
The mechanism that carries the argument is a three-stage, type-specific pipeline. Stage one is a rule-based classifier: industrial is labelled when holiday consumption is below half of workday consumption and Saturday mean consumption is below twice Sunday mean; commercial is labelled when the hourly standard deviation of mean consumption exceeds 0.1 with holiday consumption below workday consumption, or when Saturday mean consumption exceeds 1.5 times Sunday; everything else is residential. Stage two is backward-elimination feature selection using LightGBM and XGBoost errors, confirmed with SHAP values, which keeps calendar features and the holiday flag for all types, adds temperature for commercial, and shows weather and holidays are weak for residential. Stage three is the pair of corrective architectures: the fusion approach trains two LightGBM models (holiday-only and working-day-only) and picks the appropriate prediction using the known holiday schedule, which removes the holiday error spikes in industrial and one commercial consumer; the hybrid approach computes a weighted baseline from recent lags ('last day plus last week at the same hour' for day-ahead, and a 0.6/0.2/0.2 weighted combination for 15-minute) and feeds that baseline into the boosting model, which stabilizes the irregular residential series. The pipeline is evaluated in a production-like mode, re-predicting the next 24 hours at every time step, with the target being not just MAPE and MAE but the share of time-steps below threshold.
What would settle it
Hold out a full year of one consumer's data, retrain the fusion and hybrid models on the earlier years, and compare their quantitative-score metric against the single-model baseline over every overlapping 24-hour prediction; if the tailored architectures do not beat the single model on the held-out year, the central claim that they improve robustness is refuted.
Extended reading notes
Core claim
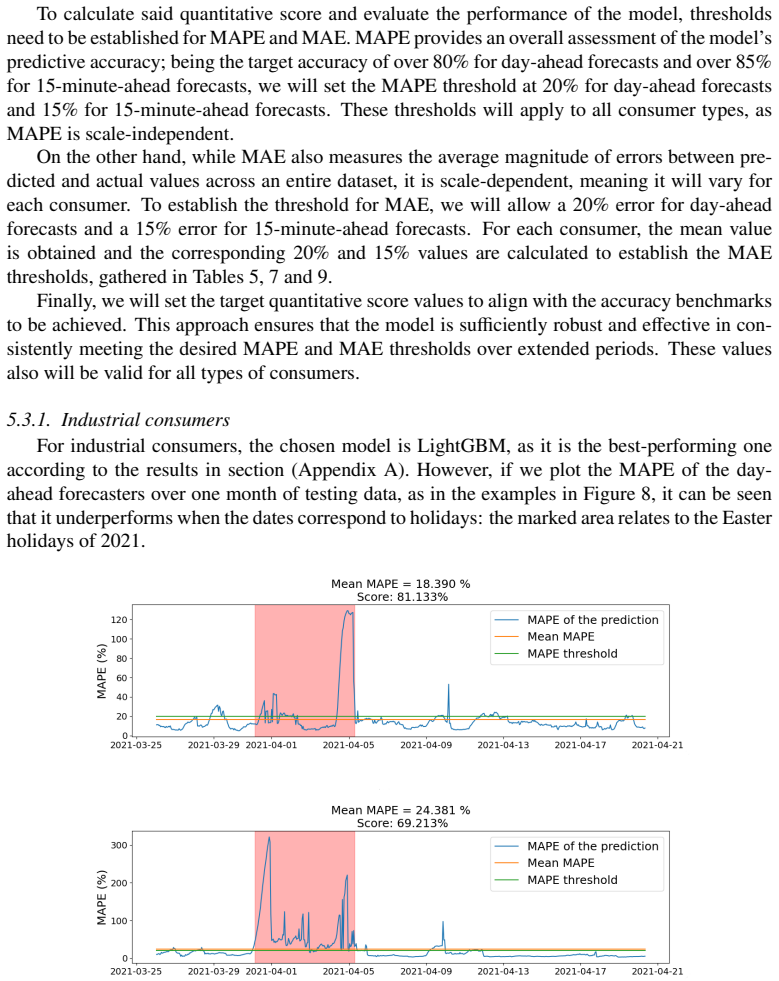
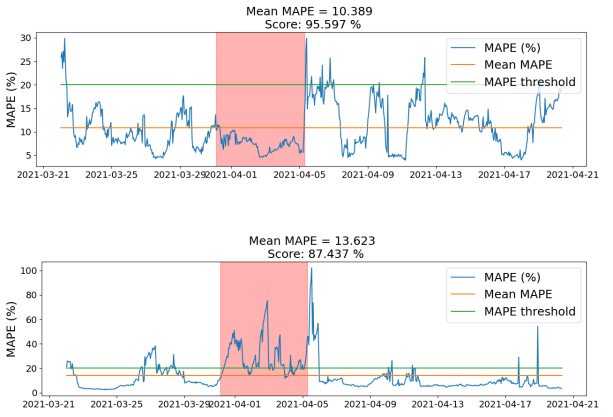
On the paper's own terms, the core finding is that the errors left over by a well-tuned single gradient-boosting model are not random; they are concentrated and type-specific. Industrial and one commercial consumer fail on holidays, because the forecaster occasionally treats a holiday like a working day and produces a bimodal error; the paper fixes this by training two LightGBM models, one on holidays and one on working days, and selecting the right output using the known holiday calendar, cutting the industrial day-ahead MAPE roughly from 18 percent to 10–14 percent. Residential consumers fail instead from high irregularity and low absolute loads, and the paper's fix is to build a baseline prediction—an average of recent same-hour values—and feed that baseline into the gradient-boosting model as an exogenous feature, which raises the frequency with which 15-minute forecasts stay under threshold but leaves day-ahead robustness still below target for two of five consumers. A secondary claim is that the simple threshold classifier, using only holiday/workday and Saturday/Sunday consumption ratios, already separates the three consumer types about as well as the unsupervised clustering in the literature, and that machine-learning regressors such as LightGBM outperform LSTM and MLP when the data are limited. The overall thesis is that forecast accuracy is gained by aligning model structure and feature set with the consumer class, not by making the model bigger.
Load-bearing premise
The paper assumes that eleven consumers (four industrial, two commercial, five residential) from two Spanish regions stand in for their entire consumer classes, and that the subsets created by splitting the same customers' data are independent enough for the classifier test; if those subsets share temporal or behavioural patterns, the 85 percent classification accuracy and the reported forecast improvements may not transfer to unseen consumers or regions.
Editorial extensions
If this is right
- For industrial consumers, weather inputs can be dropped and the model should be built around the calendar and the holiday flag; the fused holiday/workday model cuts day-ahead MAPE and raises the score of time-steps below threshold.
- For commercial consumers, temperature is worth keeping, and the same fusion fixes the holiday errors that appear in the day-ahead forecaster.
- For residential consumers, the baseline-hybrid improves stability and reduces error, but it still misses the robustness target on two of five day-ahead cases, so the paper's recipe marks residential 24-hour forecasting as the hardest remaining problem.
- A single MAPE or MAE value can look acceptable while the model is failing on a concentrated set of dates; the quantitative score is what exposes those weak periods, which is why production-style overlapping predictions are used.
- With limited data, gradient-boosting models (LightGBM and XGBoost) outperform LSTM and MLP in this study, pointing to boosting as the default base model in similar data-poor settings.
Reading between the lines
- Beyond the paper: the fusion idea is a generic regime-switch wrapper; any known error concentration—weekends, extreme heat days, local festivals—could be handled by training one model per regime and selecting with a known label.
- Beyond the paper: the residential baseline-hybrid is effectively a hand-built lag feature; its small gains suggest that without household-level covariates, 24-hour residential forecasts on this kind of data may be near their achievable accuracy.
- Beyond the paper: the classifier's rules are auditable thresholds; on a larger pool of labelled consumers one could test whether they remain stable across regions, or whether learned clusters would beat the fixed ratios.
- Beyond the paper: because the results use only eleven consumers, the strongest testable extension is a cross-region replication with the same pipeline, which would also show whether the holiday and weather findings are climate- or calendar-specific.
Editorial analysis
A structured set of objections, weighed in public.
Referee Report
Summary. The paper develops a customer-type-aware load forecasting framework for short-term (24-hour) and very-short-term (15-minute) horizons. It combines a rule-based classifier that separates industrial, commercial, and residential consumers; a backward-elimination feature selection using LightGBM/XGBoost with SHAP cross-checks; a comparison of six machine-learning models; and two tailored modifications: a holiday/workday fusion of two LightGBM models for industrial and commercial consumers, and a baseline-augmented hybrid for residential consumers. The experiments use two years of 15-minute consumption data from 11 Spanish consumers (4 industrial, 2 commercial, 5 residential) in two climatic regions, with weather data from ERA5 and Aemet. The central claim is that the tailored approaches outperform simpler single-model baselines on the reported test periods, and that weather, calendar, and holiday features have consumer-type-dependent importance.
Significance. The strength of the paper is its practical, interpretable pipeline: the production-style day-ahead simulation (predicting the next 24 hours at every time step), the use of both satellite-era reanalysis and national weather-station data, and the explicit cross-check of feature importance with SHAP are good practices. If the reported improvements are real, the fusion and hybrid heuristics could be plausibly useful to DSOs at low implementation cost. However, the evaluation does not yet establish the superiority claim: the proposed methods were designed after inspecting the very test periods on which they are then evaluated, the classification accuracy is computed from non-independent subsets of 11 consumers, and no confidence intervals are provided. The paper is therefore a promising case study rather than a confirmatory demonstration.
major comments (5)
- [5.3.1-5.3.3; Tables 4-9] The central claim that the fusion (industrial/commercial) and hybrid (residential) approaches outperform single models is not established because the methods were introduced after observing errors on the same test windows. Section 5.3.1 motivates the fusion model from the Easter 2021 failures in Figure 8 and then reports improvement on the same month in Figure 10 and Table 4; Section 5.3.2 uses December 2023 holidays in Figure 11 for Com.2; Section 5.3.3 introduces the residential hybrid after inspecting Figure 12. No separate holdout period for method selection is described. Please re-evaluate on a held-out period not used to motivate the designs, or explicitly label the results as exploratory.
- [3.1, Eq. (2)] The classification rule in Eq. (2) is internally inconsistent: the prose says a commercial dataset has "mean consumption on holidays ... lower than on workdays," but the displayed inequality is Ĉ_H > Ĉ_W. The logical relationship among the three inequalities in Eq. (2) is also ambiguous: the "additionally" Saturday/Sunday condition seems intended as an alternative, but the three conditions are grouped without OR/AND structure. Because the rule-based classifier is a contribution and its accuracy is a stated KPI, the implemented rule must be stated precisely and match the equations.
- [5.1, Figure 4] The 85% classification accuracy is computed on subsets created by splitting 11 datasets into 30 industrial/commercial and 6 residential subsets. These subsets are not independent: subsets of the same consumer share temporal and behavioral dependence, so the effective sample is much smaller than the confusion matrix suggests and the accuracy is not a reliable estimate for unseen consumers. Report consumer-level accuracy (for example, leave-one-consumer-out) or clearly state this limitation.
- [3.3.2 and 5.3.3] The KPI thresholds are adjusted post hoc. Section 3.3.2 sets MAPE thresholds of 20% (day-ahead) and 15% (15-minute-ahead) for all consumer types, while Section 5.3.3 raises residential thresholds to 30% and 25% after presenting the single-model results. Because the thresholds are used to claim that the models "meet the established standards," this change makes that claim circular. The thresholds should be pre-specified, or the residential evaluation should be framed as exploratory.
- [Tables 4-9] Several reported results contradict the superiority claim and are reported without uncertainty quantification. Com.1 day-ahead fusion increases MAPE from 5.17% to 5.92% (Table 6) and MAE from 2.9 to 3.3 kW (Table 7); Ind.4 day-ahead fusion increases MAPE from 4.3% to 4.6% (Table 4); Res.1 day-ahead hybrid leaves MAPE nearly unchanged while the MAE score drops from 88.2 to 83.4 (Table 9). No confidence intervals or significance tests are provided, so the reader cannot assess whether the improvements are real. Please add uncertainty quantification or state explicitly which consumer-type/horizon combinations benefit.
minor comments (5)
- [4.1] In Section 4.1, "data for fiveresidential consumers" contains a typo; it should read "five residential consumers."
- [3.2.3] In Section 3.2.3, "subrogate model" should be "surrogate model."
- [References] References [36] and [37] appear to be the same paper (identical title, authors, and venue) and should be merged or the duplicate removed.
- [Algorithm 1] In Algorithm 1, the condition "ei ≳ eu" is imprecise; the exact comparison or threshold used for retaining a feature should be specified.
- [5.3.2] In Section 5.3.2, the sentence "as the results of the MAPE and MAE and the achieved scores are gathered in Table 6 and 7 show" is grammatically unclear and should be rewritten.
Circularity Check
No significant circularity; post hoc design choices are validity concerns, not derivation-level circularity.
full rationale
The paper's central claims are empirical comparisons: fusion vs. single-model forecasts for industrial/commercial customers and hybrid vs. single-model forecasts for residential customers. None of these reduces to an input by construction. The fusion forecast is a conditional LightGBM model (holiday model vs. working-day model) selected at prediction time by the known holiday calendar; the output is not equal to a fitted parameter. The hybrid forecast uses a hand-specified baseline (Eqs. 5 and 6) only as an exogenous feature in a gradient-boosting model, so the final prediction is not identical to that baseline. Feature selection (Algorithm 1) and hyperparameter tuning are standard backward elimination and TPE loops using validation performance, not a relabeled fit. No load-bearing self-citation appears: the holiday-aware fusion is motivated by external work [45], and the baseline-refinement idea is explicitly attributed to the external reference [57] as an analogous approach. The manuscript does contain post hoc elements that weaken the evidential value of the reported superiority: Section 5.3 says that alternative approaches will be introduced when results do not meet standards; the fusion and hybrid designs were motivated by errors observed on the same test windows (Figures 8, 11, 12); and Section 5.3.3 raises residential MAPE thresholds from 20%/15% to 30%/25% after seeing the results. These are threats to generalizability and to the strength of the 'superior performance' claim, but they are not circularity under the definition used here: no equation equals its own input by construction, and no fitted value is renamed as a prediction. Therefore the circularity score is 0.
Assumptions & free parameters
free parameters (8)
- Classification threshold CH < CW/2 =
0.5 ratio
- Classification threshold C6 < 2*C7 =
2.0 ratio
- Commercial classification thresholds =
std > 0.1, CH > CW, C6 > 1.5*C7
- Day-ahead baseline weights =
0.5, 0.5
- 15-minute baseline weights =
0.6, 0.2, 0.2
- Forecast accuracy thresholds =
20%/15% MAPE, raised to 30%/25% for residential
- MAE threshold percentages =
20% day-ahead, 15% 15-min
- TPE hyperparameters
assumptions (5)
- domain assumption Historical load data and weather data are accurate and representative.
- domain assumption Future covariates (weather, holidays) are known exactly at prediction time.
- domain assumption The 11 consumers available are representative of their consumer classes.
- domain assumption Standard supervised learning assumptions hold (i.i.d. train/test, no concept drift in two-year period).
- domain assumption Off-the-shelf ML implementations behave as documented.
Cite this review
Pith. "Pith review of Short-Term Power Demand Forecasting for Diverse Consumer Types to Enhance Grid Planning and Synchronisation." pith.science (2026). https://pith.science/paper/O4KEE3AW
@misc{pith2026250604294,
  author       = {Pith},
  title        = {Pith review of: Short-Term Power Demand Forecasting for Diverse Consumer Types to Enhance Grid Planning and Synchronisation},
  year         = {2026},
  howpublished = {\url{https://pith.science/paper/O4KEE3AW}},
  note         = {Machine review of arXiv:2506.04294}
}
read the original abstract
Ensuring grid stability in the transition to renewable energy sources requires accurate power demand forecasting. This study addresses the need for precise forecasting by differentiating among industrial, commercial, and residential consumers through customer clusterisation, tailoring the forecasting models to capture the unique consumption patterns of each group. A feature selection process is done for each consumer type including temporal, socio-economic, and weather-related data obtained from the Copernicus Earth Observation (EO) program. A variety of AI and machine learning algorithms for Short-Term Load Forecasting (STLF) and Very Short-Term Load Forecasting (VSTLF) are explored and compared, determining the most effective approaches. With all that, the main contribution of this work are the new forecasting approaches proposed, which have demonstrated superior performance compared to simpler models, both for STLF and VSTLF, highlighting the importance of customized forecasting strategies for different consumer groups and demonstrating the impact of incorporating detailed weather data on forecasting accuracy. These advancements contribute to more reliable power demand predictions, thereby supporting grid stability.
Figures


Figures from the paper (10 more)





Reference graph
Works this paper leans on
-
[45]
A. Huang, J. Zhou, T. Cheng, X. He, J. Lv, M. Ding, Short-term load forecasting for holidays based on similar days selecting and xgboost model, in: 2023 IEEE 6th Inter- national Conference on Industrial Cyber-Physical Systems (ICPS), 2023, pp. 1–6. doi: 10.1109/ICPS58381.2023.10128055. 29
-
[57]
J.-W. Xiao, P. Liu, H. Fang, X.-K. Liu, Y .-W. Wang, Short-term residential load forecasting with baseline-refinement profiles and bi-attention mechanism, IEEE Transactions on Smart Grid 15 (1) (2024) 1052–1062. doi:10.1109/TSG.2023.3290598. 30
arXiv 2024
-
[1]
E. Commission, D.-G. for Communication, European green deal – Delivering on our tar- gets, Publications Office of the European Union, 2021. doi:doi/10.2775/373022
- [2]
-
[3]
I. K. Nti, M. Teimeh, O. Nyarko-Boateng, A. F. Adekoya, Electricity load forecasting: a systematic review, Journal of Electrical Systems and Information Technology 7 (2020) 13. doi:10.1186/s43067-020-00021-8
-
[4]
Z. Sheng, H. Wang, G. Chen, B. Zhou, J. Sun, Convolutional residual network to short-term load forecasting, Applied Intelligence 51 (2021). doi:10.1007/s10489-020-01932-9
-
[5]
M. A. Hammad, B. Jereb, B. Rosi, D. Dragan, et al., Methods and models for electric load forecasting: a comprehensive review, Logist. Sustain. Transp 11 (1) (2020) 51–76
work page 2020
- [6]
Show all 54 references
-
[7]
Holderbaum, F
W. Holderbaum, F. Alasali, A. Sinha, Energy Forecasting and Control Methods for Energy Storage Systems in Distribution Networks: Predictive Modelling and Control Techniques, Springer International Publishing, 2023. doi:10.1007/978-3-030-82848-6 . URL http://dx.doi.org/10.1007/...
2023 doi
-
[8]
Khwaja, A
A. Khwaja, A. Anpalagan, M. Naeem, B. Venkatesh, Joint bagged-boosted artificial neural networks: Using ensemble machine learning to improve short-term electricity load fore- casting, Electric Power Systems Research 179 (2020) 106080. doi:10.1016/j.epsr. 2019.106080
2020
-
[10]
A. M. N. C. Ribeiro, P. R. X. do Carmo, P. T. Endo, P. Rosati, T. Lynn, Short- and very short-term firm-level load forecasting for warehouses: A comparison of machine learning and deep learning models, Energies 15 (2022) 750. doi:10.3390/en15030750
2022 doi
-
[11]
du Toit, R
J. du Toit, R. Davimes, A. Mohamed, K. Patel, J. M. Nye, Customer segmentation using unsupervised learning on daily energy load profiles, Journal of Advances in Information Technology 7 (2016). doi:10.12720/jait.7.2.69-75
2016 doi
-
[12]
A. J. del Real, F. Dorado, J. Durán, Energy demand forecasting using deep learning: Ap- plications for the french grid, Energies 13 (2020) 2242. doi:10.3390/en13092242. 26
2020 doi
-
[13]
H. Hu, L. Wang, L. Peng, Y .-R. Zeng, Effective energy consumption forecasting using en- hanced bagged echo state network, Energy 193 (2020) 116778.doi:10.1016/j.energy. 2019.116778
2020
-
[14]
A. T. D. Perera, V . M. Nik, D. Chen, J.-L. Scartezzini, T. Hong, Quantifying the impacts of climate change and extreme climate events on energy systems, Nature Energy 5 (2020) 150–159. doi:10.1038/s41560-020-0558-0
2020 doi
-
[15]
A. Amin, M. Mourshed, Weather and climate data for energy applications, Renewable and Sustainable Energy Reviews 192 (2024) 114247. doi:10.1016/j.rser.2023.114247
2024
-
[16]
C. C. C. Service, Era5-land hourly data from 1950 to present (2019).doi:10.24381/CDS. E2161BAC. URL https://cds.climate.copernicus.eu/doi/10.24381/cds.e2161bac
2019 doi
-
[17]
S. Ali, S. Bogarra, M. N. Riaz, P. P. Phyo, D. Flynn, A. Taha, From time-series to hybrid models: Advancements in short-term load forecasting embracing smart grid paradigm, Ap- plied Sciences 14 (11) (2024). doi:10.3390/app14114442. URL https://www.mdpi.com/2076-3417/14/11/4442
2024 doi
-
[18]
Huang, Z
M. Huang, Z. Wei, Y . Lin, Forecasting-aided state estimation based on deep learn- ing for hybrid ac /dc distribution systems, Applied Energy 306 (2022) 118119. doi:https://doi.org/10.1016/j.apenergy.2021.118119. URL https://www.sciencedirect.com/science/article/pii/ S0306261921013982
2022
-
[19]
D. Said, M. Elloumi, L. Khoukhi, Cyber-attack on p2p energy transaction between con- nected electric vehicles: A false data injection detection based machine learning model, IEEE Access 10 (2022) 63640–63647. doi:10.1109/ACCESS.2022.3182689
2022
-
[20]
Huang, F
Y . Huang, F. Mo, Z. Zhang, C. Li, K. Li, Load autoformer: A transformer architecture for short-term load forecasting, in: 2023 IEEE Sustainable Power and Energy Conference (iSPEC), 2023, pp. 1–5. doi:10.1109/iSPEC58282.2023.10402999
2023
-
[21]
C. Si, S. Xu, C. Wan, D. Chen, W. Cui, J. Zhao, Electric load clustering in smart grid: Methodologies, applications, and future trends, Journal of Modern Power Systems and Clean Energy 9 (2) (2021) 237–252. doi:10.35833/MPCE.2020.000472
2021
-
[22]
F. L. Quilumba, W.-J. Lee, H. Huang, D. Y . Wang, R. L. Szabados, Using smart meter data to improve the accuracy of intraday load forecasting considering customer behavior similarities, IEEE Transactions on Smart Grid 6 (2) (2015) 911–918. doi:10.1109/TSG. 2014.2364233
2015
-
[23]
W. Xiao, T. Ding, H. Chen, Load characteristics classification of multiple users based on time series clustering, in: 2021 11th International Conference on Power and Energy Sys- tems (ICPES), 2021, pp. 569–574. doi:10.1109/ICPES53652.2021.9683860
2021
-
[24]
D. Zhe, W. Ya, M. Chuanxiao, A. Weihan, Load clustering method based on improved density peak and gaussian mixture model, Journal of Physics: Conference Series 2171 (2022) 012035. doi:10.1088/1742-6596/2171/1/012035. 27
2022 doi
-
[25]
M. Cai, Y . Zheng, Z. Peng, C. Huang, H. Jiang, Research on load clustering algorithm based on variational autoencoder and hierarchical clustering, PLOS ONE 19 (6) (2024) e0303977. doi:10.1371/journal.pone.0303977. URL http://dx.doi.org/10.1371/journal.pone.0303977
2024 doi
-
[26]
G. E. Okereke, M. C. Bali, C. N. Okwueze, E. C. Ukekwe, S. C. Echezona, C. I. Ugwu, K-means clustering of electricity consumers using time-domain features from smart meter data, Journal of Electrical Systems and Information Technology 10 (2023) 2. doi:10. 1186/s43067-023-00068-3
2023
-
[27]
K. Yu, J. Cao, X. Chen, Z. Yang, L. Gan, Residential load forecasting based on electricity consumption pattern clustering, Frontiers in Energy Research 10 (1 2023). doi:10.3389/ fenrg.2022.1113733
2023
-
[28]
Ringnér, What is principal component analysis?, Nature Biotechnology 26 (2008) 303– 304
M. Ringnér, What is principal component analysis?, Nature Biotechnology 26 (2008) 303– 304. URL https://api.semanticscholar.org/CorpusID:8198708
2008
-
[29]
Huang, X
L. Huang, X. Zhou, L. Shi, L. Gong, Time series feature selection method based on mutual information, Applied Sciences 14 (2024) 1960. doi:10.3390/app14051960
2024 doi
-
[30]
Z. Guo, J. R. O’Hanley, S. Gibson, Predicting residential electricity consumption patterns based on smart meter and household data: A case study from the republic of ireland, Utili- ties Policy 79 (2022) 101446. doi:https://doi.org/10.1016/j.jup.2022.101446. URL https://www.sc...
2022
-
[31]
Y . Wang, J. Chen, X. Chen, X. Zeng, Y . Kong, S. Sun, Y . Guo, Y . Liu, Short-term load forecasting for industrial customers based on tcn-lightgbm, IEEE Transactions on Power Systems PP (10 2020). doi:10.1109/TPWRS.2020.3028133
2020
-
[32]
Y . Zhao, L. Ye, P. Pinson, Y . Tang, P. Lu, Correlation-constrained and sparsity-controlled vector autoregressive model for spatio-temporal wind power forecasting, IEEE Transac- tions on Power Systems 33 (5) (2018) 5029–5040.doi:10.1109/TPWRS.2018.2794450
2018
-
[34]
H. Liu, X. Shen, X. Tang, J. Liu, Day-ahead electricity price probabilistic forecasting based on shap feature selection and lstnet quantile regression, Energies 16 (13) (2023). doi: 10.3390/en16135152. URL https://www.mdpi.com/1996-1073/16/13/5152
2023 doi
-
[36]
Triban, A
S. Triban, A. Lawgali, Residential short-term load forecasting based on cnn-lstm with con- sumer behavior pattern, in: 2023 IEEE 11th International Conference on Systems and Con- trol, ICSC 2023, Institute of Electrical and Electronics Engineers Inc., 2023, pp. 232–237. doi:10...
2023
-
[37]
D. Kim, D. Lee, H. Nam, S.-K. Joo, Short-term load forecasting for commercial build- ing using convolutional neural network (cnn) and long short-term memory (lstm) network with similar day selection model, Journal of Electrical Engineering and Technology 18 (09 2023). doi:10.1...
2023 doi
-
[38]
D. Wu, K. Hur, Z. Xiao, A gan-enhanced ensemble model for energy consumption fore- casting in large commercial buildings, IEEE Access 9 (2021) 158820–158830. doi: 10.1109/ACCESS.2021.3131185
2021
-
[39]
Y . Liu, Z. Liang, X. Li, Enhancing short-term power load forecasting for industrial and commercial buildings: A hybrid approach using timegan, cnn, and lstm, IEEE Open Jour- nal of the Industrial Electronics Society PP (2023) 1–12. doi:10.1109/OJIES.2023. 3319040
2023 doi
-
[40]
Ceperic, V
E. Ceperic, V . Ceperic, A. Baric, A strategy for short-term load forecasting by support vector regression machines, Power Systems, IEEE Transactions on 28 (2013) 4356–4364. doi:10.1109/TPWRS.2013.2269803
2013
-
[41]
Shwartz-Ziv, A
R. Shwartz-Ziv, A. Armon, Tabular data: Deep learning is not all you need, Information Fusion 81 (2022) 84–90. doi:https://doi.org/10.1016/j.inffus.2021.11.011. URL https://www.sciencedirect.com/science/article/pii/ S1566253521002360
2022 doi
-
[42]
S. Rai, M. De, Analysis of classical and machine learning based short-term and mid- term load forecasting for smart grid, International Journal of Sustainable Energy 40 (9) (2021) 821–839. arXiv:https://doi.org/10.1080/14786451.2021.1873339, doi: 10.1080/14786451.2021.1873339....
2021
-
[43]
Massana, C
J. Massana, C. Pous, L. Burgas, J. Melendez, J. Colomer, Short-term load forecasting for non-residential buildings contrasting artificial occupancy attributes, Energy and Buildings 130 (2016) 519–531. doi:https://doi.org/10.1016/j.enbuild.2016.08.081. URL https://www.sciencedi...
2016 doi
-
[44]
S. Park, S. Jung, S. Jung, S. Rho, E. Hwang, Sliding window-based lightgbm model for electric load forecasting using anomaly repair, The Journal of Supercomputing 77 (2021) 1–22. doi:10.1007/s11227-021-03787-4
2021 doi
-
[46]
S. Lei, X. Liang, X. Wang, J. Ding, X. Ge, F. Wang, J. Feng, A short-term net load fore- casting method based on two-stage feature selection and lightgbm with hyperparameter auto-tuning, in: 2023 IEEE/IAS 59th Industrial and Commercial Power Systems Technical Conference (I&CPS...
2023
-
[47]
Y . Wang, I. L. Bennani, X. Liu, M. Sun, Y . Zhou, Electricity consumer characteristics identification: A federated learning approach, IEEE Transactions on Smart Grid 12 (2021) 3637–3647. doi:10.1109/TSG.2021.3066577
2021
-
[48]
Dudek, A
G. Dudek, A. Gawlak, M. Kornatka, J. Szkutnik, Analysis of smart meter data for electricity consumers, in: 2018 15th International Conference on the European Energy Market (EEM), IEEE, 2018, pp. 1–5. doi:10.1109/EEM.2018.8469896
2018
-
[49]
X. Yao, X. Fu, C. Zong, Short-term load forecasting method based on feature preference strategy and lightgbm-xgboost, IEEE Access 10 (2022) 75257–75268. doi:10.1109/ ACCESS.2022.3192011
2022
-
[50]
Y . Zhou, Z. Ding, Q. Wen, Y . Wang, Robust load forecasting towards adversarial attacks via bayesian learning, IEEE Transactions on Power Systems 38 (2) (2023) 1445–1459. doi:10.1109/TPWRS.2022.3175252
2023
-
[51]
Ozaki, Y
Y . Ozaki, Y . Tanigaki, S. Watanabe, M. Nomura, M. Onishi, Multiobjective tree-structured parzen estimator, Journal of Artificial Intelligence Research 73 (2022) 1209–1250. doi: 10.1613/jair.1.13188
2022 doi
-
[52]
C. Chen, J. Twycross, J. M. Garibaldi, A new accuracy measure based on bounded relative error for time series forecasting, PLoS ONE 12 (2017). URL https://api.semanticscholar.org/CorpusID:14988266
2017
-
[53]
X. Luo, L. O. Oyedele, Forecasting building energy consumption: Adaptive long-short term memory neural networks driven by genetic algorithm, Advanced Engineering Informatics 50 (2021) 101357. doi:10.1016/j.aei.2021.101357
2021
-
[54]
Salata, V
F. Salata, V . Ciancio, J. Dell’Olmo, I. Golasi, O. Palusci, M. Coppi, Effects of local condi- tions on the multi-variable and multi-objective energy optimization of residential build- ings using genetic algorithms, Applied Energy 260 (2020) 114289. doi:10.1016/j. apenergy.2019.114289
2020
-
[55]
Government, Aemet, accessed: 2-Jan-2025 (2025)
S. Government, Aemet, accessed: 2-Jan-2025 (2025). URL https://www.aemet.es/en/eltiempo/prediccion
2025
-
[56]
Government, Statistical institute of catalonia, accessed: 2-Jan-2025 (2025)
C. Government, Statistical institute of catalonia, accessed: 2-Jan-2025 (2025). URL https://www.idescat.cat/?lang=en
2025
Reviewed August 7, 2026 · model on record in the stance chip above.
Discussion (0). Sign in to comment.