REVIEW 3 major objections 4 minor 70 references
NILMFormer: Non-Intrusive Load Monitoring that Accounts for Non-Stationarity
T0 review · 3 major / 4 minor · reviewed 2026-08-07 · deepseek-v4-flash
Pith's one-line read A Transformer that normalizes each meter subsequence and then rebuilds the removed statistics outperforms prior energy-disaggregation models on four datasets.
desk verdict Useful NILM architecture with strong ablations, but the 'significantly outperforms' claim outruns the reported statistics. read the letter →
The pith
A machine-rendered reading of the paper's core claim, the machinery that carries it, and where it could break.
The reading
What carries the argument
The load-bearing mechanism is the TokenStats/ProjStats pair: each input subsequence is z-normalized (mean subtracted, divided by standard deviation) before the Transformer; the removed mean $\mu$ and standard deviation $\sigma$ are linearly projected into a token that is concatenated to the sequence, and at the output a linear layer projects the token back into two scalars that act as a learned mean and standard deviation to denormalize the predicted appliance signal. Alongside it, TimeRPE encodes only the subsequence's discrete timestamps (minute, hour, day, month) through sinusoidal functions followed by a 1D convolution, providing global temporal context instead of only local token order.
What would settle it
Train NILMFormer on two synthetic appliances with identical activation shape but different true power levels (e.g., 2 kW and 4 kW), arranged so that the aggregate window mean and standard deviation are statistically matched; if the model cannot assign the correct scale to each appliance, the ProjStats reconstruction fails. A ready real-world check: the reported fridge under-performance on UKDALE, where a constant baseline load is the target, already shows the regime where the mechanism struggles.
Extended reading notes
Core claim
The central claim is that the performance bottleneck in sequence-to-sequence NILM is not model capacity but the distribution drift inside each input window, and that a stationarization/de-stationarization scheme tailored to disaggregation removes that bottleneck. The paper argues that standard per-window normalization (RevIN) fails for NILM because appliance identity lives partly in absolute power level, so simply restoring input statistics at the output is wrong. NILMFormer instead keeps the mean and standard deviation of each aggregate window in the network, projected via learnable layers, so the Transformer can use scale information as a first-class token while the shape information is processed on z-normalized values. The result is a model that the authors report significantly outperforms prior SotA NILM solutions, at an average rank of 1.83 versus 3.54 for the next best baseline, and that also improves per-day and per-month appliance consumption estimates over dedicated time-series extrinsic regression methods.
Load-bearing premise
The aggregate window's mean and standard deviation, after learned projections, carry enough information to reconstruct the absolute power scale of each appliance, even though the paper identifies maximum power as the distinguishing cue and z-normalization removes it before the Transformer.
Editorial extensions
If this is right
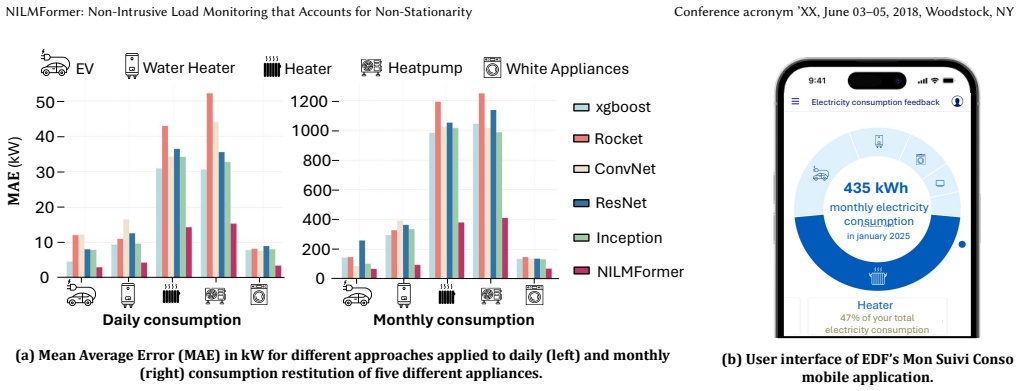
- If the claimed improvements hold, any downstream NILM application — per-day, weekly, or monthly appliance feedback — inherits them: the authors report a 51% MAE reduction for daily and 151% for monthly consumption over the best TSER baselines.
- The method is parameter-efficient relative to the transformer baselines it beats: NILMFormer uses 0.385M parameters regardless of window length, while the second-best baselines use over 1M and 11M parameters.
- A model that consumes only shape, timestamp, and two window statistics suggests that the stationarity bottleneck, not architecture size, is what limits current disaggregators.
- Because TimeRPE uses only timestamps, a model trained on one meter's sampling grid can in principle be applied to any household with the same timestamp resolution without re-embedding positions.
Reading between the lines
- The paper's own observation that 'the maximum power differentiates' appliances sits in tension with z-normalizing the input: if two appliances share a similar shape and similar aggregate window mean/standard deviation but differ in true peak power, the ProjStats projection would need to separate them from the window statistics alone. A targeted test: synthesize two such appliances and check whethe
- The same stationarization/token-stats recipe could generalize beyond electricity, e.g., to water or gas disaggregation, wherever a high-level aggregate carries both a shape and a scale that identifies the contributor.
- Because only two scalar statistics of the aggregate window are kept, the approach implicitly assumes appliance activation patterns are stationary within a window after z-normalization; windows spanning state changes (e.g., a heater turning on mid-window) stress this assumption most.
- The deployment figures (3.6M customers, weekly runs, ~11 hours per pass) suggest the efficiency claim is the product-side corollary: if accuracy degrades on constant-draw appliances (the fridge case the authors report), the same mechanism that helps variable loads may need a companion model for baseline loads.
Editorial analysis
A structured set of objections, weighed in public.
Referee Report
Summary. The paper proposes NILMFormer, a sequence-to-sequence Transformer for non-intrusive load monitoring (NILM) that explicitly addresses non-stationarity within input subsequences. The architecture z-normalizes each input window, propagates the removed mean and standard deviation into the Transformer as a TokenStats token, learns a ProjStats projection to denormalize the output, and uses a timestamp-only positional encoding (TimeRPE). The authors evaluate NILMFormer on four datasets (UKDALE, REFIT, and two private EDF datasets) against eleven baselines across three window lengths, reporting an average rank of 1.833 versus 3.536 for the next-best baseline and claiming over 15% MAE and 22% matching-ratio improvement on average. An ablation study uses critical-difference diagrams to justify the design choices, and a deployment section describes the use of NILMFormer in EDF's Mon Suivi Conso service.
Significance. If the central empirical claim is properly supported, this is a practically important contribution: NILM is a real deployment area, and the paper attacks a real distribution-shift problem that has received little attention in the NILM literature. The evaluation is broad (4 datasets, 11 baselines, 3 window lengths, private high-power appliance data), the source code is made available, and the deployment details give rare evidence of real-world impact. However, the headline 'significantly outperforms' claim is not backed by statistical tests on the main comparison, and a protocol inconsistency in the private-dataset description undermines reproducibility. The architecture's design rationale also contains an unresolved tension with the paper's own stated cue of maximum power. These issues are fixable, but they are load-bearing for the paper's main conclusions.
major comments (3)
- [Section 5.3, Table 2] The abstract, Section 5.3, and Section 7 claim that NILMFormer 'significantly outperforms' state-of-the-art approaches, but no statistical support is provided for the main results. Table 2 reports each score as the average of three runs, without standard deviations, confidence intervals, paired tests, or effect sizes. Several differences are small (e.g., EDF1 Heatpump at w=128: NILMFormer 270.5 vs Energformer 274.9; UKDALE Fridge shows NILMFormer worse than UNet-NILM at all window lengths). The ablation study in Section 5.4 uses a Friedman test with post-hoc Wilcoxon tests, but the main results table has no equivalent. The word 'significantly' is therefore not operationalized for the central claim. I ask the authors to report variance across runs and to run paired significance tests (e.g., Wilcoxon signed-rank over all dataset-case-window configurations) comparing NILMFormer with each baseline, or to soften the claim to a descriptive improvement.
- [Section 5.1.3] The data-split description contains a direct contradiction. Section 5.1.3 states 'For EDF2, which contains more than 350 houses, 70% of the houses were used for training, 10% for validation, and the remaining 20% for evaluation.' However, Table 1 and Section 5.1.2 both report EDF2 as containing 24 houses. A 70/10/20 split is not realizable with 24 houses in an integer way, and the sentence appears to describe EDF1 (which Table 1 gives as 369 houses). This ambiguity makes the private-dataset results impossible to audit. The sentence must be corrected and the exact split for EDF2 (e.g., number of houses for train/validation/test) must be stated.
- [Section 4.1 (Step 1 and Step 4) vs. Section 2.2] There is a conceptual tension between the design and the paper's own motivating observation. Section 2.2 says 'Similar patterns (shapes) may be common to multiple appliances, but the maximum power differentiates them.' Yet Step 1 z-normalizes each input subsequence, which removes absolute power levels, and the only absolute-level information routed to the network is the aggregate window mean and standard deviation through TokenStats, later reconstructed via learned ProjStats. If two appliances have similar shapes and similar aggregate window statistics but different true power levels, ProjStats cannot in principle recover the target appliance's scale. The paper does not test whether the mean/std statistics are sufficient, nor does it consider routing additional absolute cues such as the maximum power or quantiles. I ask the authors to provide direct evidence (e.g., an ablation feeding max/percentile features, or an analysis of failure cases on short high-power events) that the chosen statistics carry enough scale information for the disaggregation task.
minor comments (4)
- [Table 1 vs. Section 5.1.2] The number of houses in EDF1 is reported as 369 in Table 1 but 358 in Section 5.1.2; these numbers should be reconciled.
- [Figure 4 caption] Figure 4 is described as an Electric Vehicle example on EDF1, but Table 1 lists Electric Vehicle only under EDF2; either the dataset label or the table is wrong.
- [Section 4.1.1] The text says 'Not that a residual connection is used'; this should read 'Note that'.
- [Appendix C] The reproducibility section says scores are averaged over three household-disjoint train/test splits generated with seeds {0,1,2}; the procedure for generating these splits from the datasets (especially for the public datasets) should be described in more detail.
Circularity Check
No significant circularity: the headline result is an external benchmark comparison, and self-citations are not load-bearing.
full rationale
The central claim is an empirical benchmark claim: NILMFormer's MAE and MR scores are computed on held-out houses of UKDALE, REFIT, EDF1, and EDF2 (Section 5.3, Table 2) and compared against external baselines with fixed default parameters. There is no fitted parameter renamed as a prediction; the TokenStats/ProjStats denormalization is trained end-to-end with the MSE loss and then evaluated on unseen houses, and the per-period feedback experiments in Section 6 reuse the models already trained in Section 5.3 rather than fitting to the TSER targets. The architecture's components are either new (TimeRPE, TokenStats/ProjStats) or drawn from external work such as RevIN [33] and the Non-Stationary Transformer [36]; the diagonally masked attention is justified by the authors' prior VLDB paper [50], but that citation is not used as a uniqueness theorem and does not force the empirical outcome, so it is at most a minor self-citation rather than load-bearing circularity. The absence of variance and significance tests in Table 2 is an evidentiary weakness regarding the word 'significantly,' but it is not a derivation that reduces to its own inputs. No equation or experimental result in the paper is equivalent by construction to its inputs, so no circular step is identified.
Assumptions & free parameters
free parameters (2)
- Hyperparameter configuration =
d_model=96, 3 Transformer layers, 72 embedding filters, dropout 0.2, PE channel ratio d_model/4, learning rate 1e-4…
- Learned TokenStats and ProjStats projection weights =
Not reported (learned during training)
assumptions (5)
- domain assumption The aggregate signal is the sum of appliance signals plus noise, as in Eq. 1.
- domain assumption House-disjoint train/test splits within each dataset measure real-world generalization.
- ad hoc to paper Aggregate window mean and standard deviation, after learned projection, are sufficient to recover target appliance scale.
- domain assumption Timestamp-based positional encoding captures appliance usage regularities across houses.
- domain assumption Baselines trained with default parameters provide fair state-of-the-art comparisons.
Cite this review
Pith. "Pith review of NILMFormer: Non-Intrusive Load Monitoring that Accounts for Non-Stationarity." pith.science (2026). https://pith.science/paper/GBQCKQSX
@misc{pith2026250605880,
  author       = {Pith},
  title        = {Pith review of: NILMFormer: Non-Intrusive Load Monitoring that Accounts for Non-Stationarity},
  year         = {2026},
  howpublished = {\url{https://pith.science/paper/GBQCKQSX}},
  note         = {Machine review of arXiv:2506.05880}
}
read the original abstract
Millions of smart meters have been deployed worldwide, collecting the total power consumed by individual households. Based on these data, electricity suppliers offer their clients energy monitoring solutions to provide feedback on the consumption of their individual appliances. Historically, such estimates have relied on statistical methods that use coarse-grained total monthly consumption and static customer data, such as appliance ownership. Non-Intrusive Load Monitoring (NILM) is the problem of disaggregating a household's collected total power consumption to retrieve the consumed power for individual appliances. Current state-of-the-art (SotA) solutions for NILM are based on deep-learning (DL) and operate on subsequences of an entire household consumption reading. However, the non-stationary nature of real-world smart meter data leads to a drift in the data distribution within each segmented window, which significantly affects model performance. This paper introduces NILMFormer, a Transformer-based architecture that incorporates a new subsequence stationarization/de-stationarization scheme to mitigate the distribution drift and that uses a novel positional encoding that relies only on the subsequence's timestamp information. Experiments with 4 real-world datasets show that NILMFormer significantly outperforms the SotA approaches. Our solution has been deployed as the backbone algorithm for EDF's (Electricit\'e De France) consumption monitoring service, delivering detailed insights to millions of customers about their individual appliances' power consumption. This paper appeared in KDD 2025.
Figures


Figures from the paper (5 more)




Reference graph
Works this paper leans on
-
[1]
Angelis, Christos Timplalexis, Athanasios I
Georgios F. Angelis, Christos Timplalexis, Athanasios I. Salamanis, Stelios Krini- dis, Dimosthenis Ioannidis, Dionysios Kehagias, and Dimitrios Tzovaras. 2023. En- ergformer: A New Transformer Model for Energy Disaggregation. IEEE Transac- tions on Consumer Electronics 69, 3 (2023), 308–320. doi:10.1109/TCE.2023.3237862
arXiv 2023
-
[2]
Carrie Armel, Abhay Gupta, Gireesh Shrimali, and Adrian Albert
K. Carrie Armel, Abhay Gupta, Gireesh Shrimali, and Adrian Albert. 2013. Is disaggregation the holy grail of energy efficiency? The case of electricity. Energy Policy 52 (2013), 213–234. doi:10.1016/j.enpol.2012.08.062
-
[3]
Alessio Benavoli, Giorgio Corani, and Francesca Mangili. 2016. Should We Really Use Post-Hoc Tests Based on Mean-Ranks? Journal of Machine Learning Research 17, 5 (2016), 1–10. http://jmlr.org/papers/v17/benavoli16a.html
work page 2016
-
[4]
Laurent Bozzi and Philippe Charpentier. 2018. Évaluation d’Impact sur la Con- sommation Électrique de la Solution Digitale e.quilibre d’EDF. In Journées de Statistique (JdS). Société Française de Statistique (SFdS), France
work page 2018
- [5]
-
[6]
Tianqi Chen and Carlos Guestrin. 2016. XGBoost: A Scalable Tree Boosting System. In Proceedings of the 22nd ACM SIGKDD International Conference on Knowledge Discovery and Data Mining (San Francisco, California, USA) (KDD ’16). ACM, New York, NY, USA, 785–794. doi:10.1145/2939672.2939785
arXiv 2016
-
[7]
Xu Cheng, Meng Zhao, Jianhua Zhang, Jinghao Wang, Xueping Pan, and Xiufeng Liu. 2022. TransNILM: A Transformer-based Deep Learning Model for Non- intrusive Load Monitoring. In Proceedings of the 2022 International Conference on High Performance Big Data and Intelligent Systems (HDIS) . 13–20. doi:10.1109/ HDIS56859.2022.9991439
- [8]
Show all 70 references
-
[9]
Angus Dempster, François Petitjean, and Geoffrey I. Webb. 2019. ROCKET: Excep- tionally fast and accurate time series classification using random convolutional kernels. CoRR abs/1910.13051 (2019). arXiv:1910.13051 http://arxiv.org/abs/1910. 13051
2019 arXiv
-
[10]
DMLC. 2024. eXtreme Gradient Boosting. https://github.com/dmlc/xgboost
2024
-
[11]
EDF. 2024. Private communication with DATANUMIA Team Manager
2024
-
[12]
EDF. 2025. The digital revolution driving energy efficiency. https://www.edf.fr /en/the-edf-group/taking-action-as-a-responsible-company/corporate-social- responsibility/the-digital-revolution-driving-energy-efficiency
2025
-
[13]
EDF. 2025. Solution suivi conso EDF. https://particulier.edf.fr/fr/accueil/bilan- consommation/solution-suivi-conso.html
2025
-
[14]
French Patent FR1451531, 2014
Gregory Yard EDF, Laurent Bozzi. French Patent FR1451531, 2014. ESTIMATION DE LA CONSOMMATION ELECTRIQUE D’UN EQUIPEMENT DONNE PARMI UN ENSEMBLE D’EQUIPEMENTS ELECTRIQUES. https://data.inpi.fr/brevets/F R1451531
2014
-
[15]
French Patent FR3017975, 2016
Melanie Cazes EDF, Laurent Bozzi. French Patent FR3017975, 2016. ESTI- MATION FINE DE CONSOMMATION ELECTRIQUE POUR DES BESOINS DE CHAUFFAGE/CLIMATISATION D’UN LOCAL D’HABITATION. https: //data.inpi.fr/brevets/FR3017975
2016
-
[16]
EDF à la Réunion. 2024. Sarz la Kaz. https://reunion.edf.fr/edf-a-la-reunion/actu alites-a-la-reunion/sarz-la-kaz. Accessed: 2025-02-07
2024
-
[17]
Anthony Faustine and Lucas Pereira. 2020. Multi-Label Learning for Appliance Recognition in NILM Using Fryze-Current Decomposition and Convolutional Neural Network. Energies 13, 16 (2020). doi:10.3390/en13164154
2020 doi
-
[18]
Anthony Faustine, Lucas Pereira, Hafsa Bousbiat, and Shridhar Kulkarni. 2020. UNet-NILM: A Deep Neural Network for Multi-tasks Appliances State Detection and Power Estimation in NILM. InProceedings of the 5th International Workshop on Non-Intrusive Load Monitoring (Virtual Eve...
2020
-
[19]
Schmidt, Jonathan Weber, Geoffrey I
Hassan Ismail Fawaz, Benjamin Lucas, Germain Forestier, Charlotte Pelletier, Daniel F. Schmidt, Jonathan Weber, Geoffrey I. Webb, Lhassane Idoumghar, Pierre- Alain Muller, and François Petitjean. 2020. InceptionTime: Finding AlexNet for time series classification. Data Mining ...
2020 doi
-
[20]
William Fedus, Barret Zoph, and Noam Shazeer. 2022. Switch transformers: scaling to trillion parameter models with simple and efficient sparsity. J. Mach. Learn. Res. 23, 1, Article 120 (Jan. 2022), 39 pages
2022
-
[21]
Steven Firth, Tom Kane, Vanda Dimitriou, Tarek Hassan, Farid Fouchal, Michael Coleman, and Lynda Webb. 2017. REFIT Smart Home dataset. (6 2017). doi:10. 17028/rd.lboro.2070091.v1
2017
-
[22]
Navid Mohammadi Foumani, Chang Wei Tan, Geoffrey I Webb, and Mahsa Salehi
-
[23]
Green, Aaron W
Daisy H. Green, Aaron W. Langham, Rebecca A. Agustin, Devin W. Quinn, and Steven B. Leeb. 2023. Adaptation for Automated Drift Detection in Electrome- chanical Machine Monitoring. IEEE Transactions on Neural Networks and Learning Systems 34, 10 (2023), 6768–6782. doi:10.1109/T...
2023
-
[24]
G.W. Hart. 1992. Nonintrusive appliance load monitoring.Proc. IEEE 80, 12 (1992), 1870–1891. doi:10.1109/5.192069
1992 doi
- [25]
- [26]
-
[27]
Romain Ilbert, Ambroise Odonnat, Vasilii Feofanov, Aladin Virmaux, Giuseppe Paolo, Themis Palpanas, and Ievgen Redko. 2024. SAMformer: Unlocking the Potential of Transformers in Time Series Forecasting with Sharpness-Aware Minimization and Channel-Wise Attention. arXiv:2402.10...
2024 arXiv
- [28]
-
[29]
Maria Kaselimi, Eftychios Protopapadakis, Athanasios Voulodimos, Nikolaos Doulamis, and Anastasios Doulamis. 2022. Towards Trustworthy Energy Disag- gregation: A Review of Challenges, Methods, and Perspectives for Non-Intrusive Load Monitoring. Sensors 22 (08 2022), 5872. doi:...
2022 doi
-
[30]
Jack Kelly and William Knottenbelt. 2015. Neural NILM. In Proceedings of the 2nd ACM International Conference on Embedded Systems for Energy-Efficient Built Environments. ACM. doi:10.1145/2821650.2821672
2015
-
[31]
Jack Kelly and William Knottenbelt. 2015. The UK-DALE dataset, domestic appliance-level electricity demand and whole-house demand from five UK homes. Scientific Data 2 (03 2015). doi:10.1038/sdata.2015.7
2015 doi
-
[32]
Arlitt, Geoff Lyon, and Jiawei Han
Hyungsul Kim, Manish Marwah, Martin F. Arlitt, Geoff Lyon, and Jiawei Han
-
[33]
Taesung Kim, Jinhee Kim, Yunwon Tae, Cheonbok Park, Jang-Ho Choi, and Jaegul Choo. 2021. Reversible Instance Normalization for Accurate Time-Series Forecasting against Distribution Shift. In International Conference on Learning Representations. https://openreview.net/forum?id=...
2021
-
[34]
Zico Kolter
J. Zico Kolter. 2011. REDD : A Public Data Set for Energy Disaggregation Re- search
2011
-
[35]
Pauline Laviron, Xueqi Dai, Bérénice Huquet, and Themis Palpanas. 2021. Electric- ity Demand Activation Extraction: From Known to Unknown Signatures, Using Similarity Search. In e-Energy ’21: The Twelfth ACM International Conference on Future Energy Systems, Virtual Event, Tor...
2021
-
[36]
Yong Liu, Haixu Wu, Jianmin Wang, and Mingsheng Long. 2022. Non-stationary Transformers: Exploring the Stationarity in Time Series Forecasting. In Neu- ral Information Processing Systems . https://api.semanticscholar.org/CorpusID: 252968420
2022
-
[37]
Prajowal Manandhar, Hasan Rafiq, Edwin Rodriguez-Ubinas, and Themis Pal- panas. 2024. New Forecasting Metrics Evaluated in Prophet, Random Forest, and Long Short-Term Memory Models for Load Forecasting. Energies 17, 23 (2024). doi:10.3390/en17236131
2024 doi
-
[38]
Luca Massidda, Marino Marrocu, and Simone Manca. 2020. Non-Intrusive Load Disaggregation by Convolutional Neural Network and Multilabel Classification. Applied Sciences 10, 4 (2020). doi:10.3390/app10041454
2020 doi
-
[39]
Petersen, Ryan Butner, and Erica M
Ebony Mayhorn, Greg Sullivan, Joseph M. Petersen, Ryan Butner, and Erica M. Johnson. 2016. Load Disaggregation Technologies: Real World and Laboratory Performance. https://api.semanticscholar.org/CorpusID:115779193
2016
-
[40]
Matthew Middlehurst, Ali Ismail-Fawaz, Antoine Guillaume, Christopher Holder, David Guijo Rubio, Guzal Bulatova, Leonidas Tsaprounis, Lukasz Mentel, Martin Walter, Patrick Schäfer, and Anthony Bagnall. 2024. aeon: a Python toolkit for learning from time series. arXiv:2406.1423...
2024 arXiv
-
[41]
Kumar Venayagamoorthy
Megan Milam and G. Kumar Venayagamoorthy. 2014. Smart meter deployment: US initiatives. In ISGT 2014. 1–5. doi:10.1109/ISGT.2014.6816507
2014
-
[42]
Nguyen, Phanwadee Sinthong, and Jayant Kalagnanam
Yuqi Nie, Nam H. Nguyen, Phanwadee Sinthong, and Jayant Kalagnanam. 2023. A Time Series is Worth 64 Words: Long-term Forecasting with Transformers. In International Conference on Learning Representations
2023
-
[43]
Martinez, Daniel de Oliveira, Geraldo Zimbrão, Gisele Lobo Pappa, and Marta Mattoso
Eduardo Ogasawara, Leonardo C. Martinez, Daniel de Oliveira, Geraldo Zimbrão, Gisele Lobo Pappa, and Marta Mattoso. 2010. Adaptive Normalization: A novel data normalization approach for non-stationary time series.The 2010 International Joint Conference on Neural Networks (IJCN...
2010
-
[44]
Keiron O’Shea and Ryan Nash. 2015. An Introduction to Convolutional Neural Networks. CoRR abs/1511.08458 (2015). arXiv:1511.08458 http://arxiv.org/abs/ 1511.08458
2015 arXiv
-
[45]
Adam Paszke, Sam Gross, Francisco Massa, Adam Lerer, James Bradbury, Gregory Chanan, Trevor Killeen, Zeming Lin, Natalia Gimelshein, Luca Antiga, Alban Desmaison, Andreas Köpf, Edward Yang, Zach DeVito, Martin Raison, Alykhan Tejani, Sasank Chilamkurthy, Benoit Steiner, Lu Fan...
2019
-
[46]
Adrien Petralia. 2025. Source code of NILMFormer experiments. https://github .com/adrienpetralia/NILMFormer
2025
-
[48]
Adrien Petralia, Paul Boniol, Philippe Charpentier, and Themis Palpanas. 2025. Few Labels are All You Need: A Weakly Supervised Framework for Appliance Localization in Smart-Meter Series . In 2025 IEEE 41st International Conference on Data Engineering (ICDE). 4386–4399. doi:10...
2025
-
[49]
Adrien Petralia, Philippe Charpentier, Paul Boniol, and Themis Palpanas. 2023. Appliance Detection Using Very Low-Frequency Smart Meter Time Series. In Proceedings of the 14th ACM International Conference on Future Energy Systems (Orlando, FL, USA) (e-Energy ’23). Association ...
2023
-
[50]
Adrien Petralia, Philippe Charpentier, and Themis Palpanas. 2023. ADF & TransApp: A Transformer-Based Framework for Appliance Detection Using Smart Meter Consumption Series. Proc. VLDB Endow. 17, 3 (nov 2023), 553–562. doi:10.14778/3632093.3632115
2023
-
[51]
Daniel Precioso Garcelán and David Gomez-Ullate. 2023. Thresholding methods in non-intrusive load monitoring. The Journal of Supercomputing 79 (04 2023), 1–24. doi:10.1007/s11227-023-05149-8
2023 doi
-
[52]
Hasan Rafiq, Prajowal Manandhar, Edwin Rodriguez-Ubinas, Omer Ahmed Qureshi, and Themis Palpanas. 2024. A review of current methods and chal- lenges of advanced deep learning-based non-intrusive load monitoring (NILM) in residential context. Energy and Buildings 305 (2024), 11...
2024
-
[53]
Olaf Ronneberger, Philipp Fischer, and Thomas Brox. 2015. U-Net: Convolutional Networks for Biomedical Image Segmentation. In Medical Image Computing and Computer-Assisted Intervention – MICCAI 2015 , Nassir Navab, Joachim Horneg- ger, William M. Wells, and Alejandro F. Frangi...
2015
-
[54]
Ruichen Sun, Kun Dong, and Jianfeng Zhao. 2023. DiffNILM: A Novel Framework for Non-Intrusive Load Monitoring Based on the Conditional Diffusion Model. Sensors 23, 7 (2023). doi:10.3390/s23073540
2023 doi
-
[55]
Stavros Sykiotis, Maria Kaselimi, Anastasios Doulamis, and Nikolaos Doulamis
-
[56]
Chang Wei Tan, Christoph Bergmeir, François Petitjean, and Geoffrey I. Webb
-
[57]
Sastry Varanasi and Sri Phani Krishna Karri
L.N. Sastry Varanasi and Sri Phani Krishna Karri. 2024. STNILM: Switch Transformer based Non-Intrusive Load Monitoring for short and long dura- tion appliances. Sustainable Energy, Grids and Networks 37 (2024), 101246. doi:10.1016/j.segan.2023.101246
2024
-
[58]
Gomez, Lukasz Kaiser, and Illia Polosukhin
Ashish Vaswani, Noam Shazeer, Niki Parmar, Jakob Uszkoreit, Llion Jones, Aidan N. Gomez, Lukasz Kaiser, and Illia Polosukhin. 2017. Attention Is All You Need. CoRR abs/1706.03762 (2017). arXiv:1706.03762 http://arxiv.org/abs/ 1706.03762
2017 arXiv
-
[59]
Mark Nelms
Lingxiao Wang, Shiwen Mao, and R. Mark Nelms. 2022. Transformer for Nonin- trusive Load Monitoring: Complexity Reduction and Transferability.IEEE Internet of Things Journal 9, 19 (2022), 18987–18997. doi:10.1109/JIOT.2022.3163347
2022
-
[60]
Min Xia, Wan’an Liu, Yiqing Xu, Ke Wang, and Xu Zhang. 2019. Dilated residual attention network for load disaggregation. Neural Computing and Applications 31, 12 (12 2019), 8931–8953. doi:10.1007/s00521-019-04414-3
2019 doi
-
[61]
Zhenrui Yue, Camilo Requena Witzig, Daniel Jorde, and Hans-Arno Jacobsen
-
[62]
George Zerveas, Srideepika Jayaraman, Dhaval Patel, Anuradha Bhamidipaty, and Carsten Eickhoff. 2021. A Transformer-based Framework for Multivariate Time Series Representation Learning. In Proceedings of the 27th ACM SIGKDD Conference on Knowledge Discovery & Data Mining (Virt...
2021
-
[63]
Chaoyun Zhang, Mingjun Zhong, Zongzuo Wang, Nigel Goddard, and Charles Sutton. 2018. Sequence-to-point learning with neural networks for non-intrusive load monitoring. In Proceedings of the Thirty-Second AAAI Conference on Arti- ficial Intelligence and Thirtieth Innovative App...
2018
-
[64]
Bochao Zhao, Minxiang Ye, Lina Stankovic, and Vladimir Stankovic. 2020. Non- intrusive load disaggregation solutions for very low-rate smart meter data. Ap- plied Energy 268 (2020), 114949. doi:10.1016/j.apenergy.2020.114949
2020
-
[65]
Haoyi Zhou, Shanghang Zhang, Jieqi Peng, Shuai Zhang, Jianxin Li, Hui Xiong, and Wan Zhang. 2020. Informer: Beyond Efficient Transformer for Long Sequence Time-Series Forecasting. In AAAI Conference on Artificial Intelligence . https: //api.semanticscholar.org/CorpusID:229156802
2020
-
[66]
Ziwei Zhu, Mengran Zhou, Feng Hu, Kun Wang, Guangyao Zhou, Weile Kong, Yijie Hu, and Enhan Cui. 2024. TSILNet: A novel hybrid model for energy disaggregation based on two-stage improved TCN combined with IECA-LSTM. Building Simulation 17, 11 (2024), 2083–2095. doi:10.1007/s122...
2024 doi
-
[2011]
Unsupervised Disaggregation of Low Frequency Power Measurements. In SDM. https://api.semanticscholar.org/CorpusID:18447017
-
[2020]
In Proceedings of the 5th International Workshop on Non-Intrusive Load Monitoring (Virtual Event, Japan) (NILM’20)
BERT4NILM: A Bidirectional Transformer Model for Non-Intrusive Load Monitoring. In Proceedings of the 5th International Workshop on Non-Intrusive Load Monitoring (Virtual Event, Japan) (NILM’20). Association for Computing Machinery, New York, NY, USA, 89–93. doi:10.1145/342777...
-
[2021]
Data Mining and Knowledge Discovery 35, 3 (5 2021), 1032–1060
Time series extrinsic regression. Data Mining and Knowledge Discovery 35, 3 (5 2021), 1032–1060. doi:10.1007/s10618-021-00745-9
2021 doi
-
[2022]
Sensors 22, 8 (2022)
ELECTRIcity: An Efficient Transformer for Non-Intrusive Load Monitoring. Sensors 22, 8 (2022). doi:10.3390/s22082926
2022 doi
-
[2024]
Data Mining and Knowledge Discovery 38, 1 (2024), 22–48
Improving position encoding of transformers for multivariate time series classification. Data Mining and Knowledge Discovery 38, 1 (2024), 22–48
2024
Reviewed August 7, 2026 · model on record in the stance chip above.
Discussion (0). Sign in to comment.