REVIEW 4 major objections 5 minor 1 cited by
The NetMob25 Dataset: A High-resolution Multi-layered View of Individual Mobility in Greater Paris Region
T0 review · 4 major / 5 minor · reviewed 2026-08-07 · deepseek-v4-flash
Pith's one-line read The paper introduces the NetMob25 dataset: seven days of GPS traces from 3,337 Greater Paris residents, with about 500 million points and over 80,000 validated trips, plus census-calibrated weights.
desk verdict A potentially valuable GPS mobility dataset, but the abstract's ~500M point count is off by an order of magnitude from the trip statistics; needs major revision before it can be trusted. read the letter →
The pith
A machine-rendered reading of the paper's core claim, the machinery that carries it, and where it could break.
The reading
What carries the argument
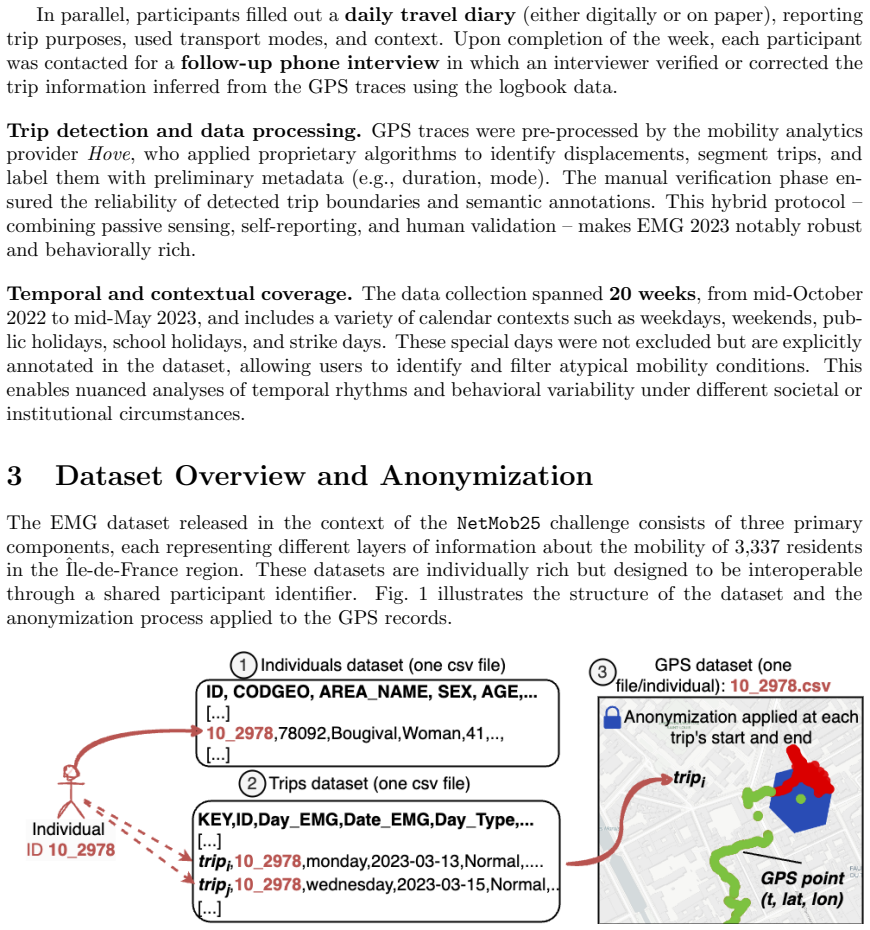
The carrying mechanism is the hybrid survey protocol: a BT-Q1000XT GPS travel recorder configured to log a position every 2–3 seconds only while motion is detected, a daily travel diary kept by each participant, and a follow-up phone interview in which inferred trips, modes, and purposes are verified or corrected. This protocol produces the trip-level ground truth that makes the raw traces interpretable. Around it sit three supporting machinery pieces: an H3 hexagonal grid blurring step that hides the first and last 50–100 meters of each trip, an anonymization and cleaning pipeline that removes non-trip points, and census-calibrated individual and trip weights that allow extrapolation to the Greater Paris population.
What would settle it
Take a subsample of participants and have them carry a second, independent always-on GPS logger (or share their phone's location history) for the same week; if the second logger records trips that are absent from the validated NetMob25 traces, or records movement during periods the device shows as a gap, the claim that the traces form a complete weekly mobility record would be contradicted.
Extended reading notes
Core claim
The central claim is that the dataset, built from the EMG 2023 GNSS-based mobility survey, provides a high-resolution, multi-layered record of individual mobility in a large European metropolis. It combines three linkable databases — individual sociodemographic and household characteristics, validated trips with timestamps, modes, and purposes, and raw GPS traces with points every 2–3 seconds — so that trajectories, behaviors, and population profiles can be analyzed together. The authors further claim that the collected sample, once reweighted against census marginals, supports population-level estimates of trip volumes, mode use, and spatial flows, and that the anonymization pipeline preserves analytical value by blurring only trip endpoints while keeping in-trip points at full resolution.
Load-bearing premise
The load-bearing premise is that participants carried the BT-Q1000XT device with them for seven consecutive days and that the device recorded a position whenever they moved, so that every gap in the GPS trace means a stationary period or no travel rather than a missed or unlogged trip.
Editorial extensions
If this is right
- Researchers can estimate population-level mobility for Greater Paris by applying the provided individual and trip weights to trip counts, mode shares, and spatial flows.
- The 2–3-second GPS traces, time-aligned with validated trips, can serve as reference data for evaluating trip detection and segmentation algorithms.
- Linked sociodemographic and trip data allow studies of transport mode choice, multimodal chains, teleworking patterns, and mobility differences across age, sex, and household type.
- Annotated special days and 'No Trip' or 'No Traces' rows let analysts filter or study atypical mobility during holidays, strikes, weekends, and school breaks.
- The anonymization design preserves in-trip trajectory detail while obscuring home and work locations, supporting spatial analyses of flows at fine geographic scale.
Reading between the lines
- If the motion-triggered logging behaved as described, then stationary gaps can be treated as periods of no travel; however, the dataset cannot by itself distinguish 'device left at home' from 'no travel,' so studies of immobility should treat those two cases as potentially confounded.
- The weight calibration is based on sociodemographic marginals and day of week, not on joint day-to-day mobility patterns; analyses of weekly rhythms or longitudinal dependencies may need to assess the extra uncertainty introduced by this.
- The full-resolution in-trip points, with endpoints blurred independently per trip, create an opportunity to benchmark privacy-preserving trajectory publishing: a researcher could attempt to re-identify homes or workplaces from the blurred endpoints and probe the actual protection offered by the chosen cell resolution.
- Because GPS files exist for only 3,320 of the 3,337 participants, any analysis that joins GPS traces to trip records should first verify whether the missing 17 introduce bias; the paper flags them but does not establish that their absence is random.
Editorial analysis
A structured set of objections, weighed in public.
Referee Report
Summary. The paper describes the NetMob25 dataset, derived from the EMG 2023 GNSS-based mobility survey in the Île-de-France region. The dataset comprises three linked components: an individuals database with sociodemographic and household attributes for 3,337 participants, a trips database with over 80,000 validated trips annotated with modes and purposes, and a raw GPS traces database claimed to contain approximately 500 million high-frequency points. The paper presents the survey design, data collection protocol, anonymization pipeline, weighting methodology, and an exploratory characterization of individual and trip-level statistics, transport modes, and spatial flows. It also discusses intended use cases and access conditions under the NetMob25 Data Challenge.
Significance. If the dataset is as described, it would be a valuable resource for mobility research: it combines high-frequency GPS trajectories with human-validated trip boundaries, transport modes, purposes, and rich sociodemographic covariates, and it provides calibration weights for population-level inference. The multi-stage validation through logbooks and phone interviews is a notable strength, as is the careful documentation of anonymization steps (pseudonymization, removal of non-trip data, and H3-based blurring of trip endpoints). The exploratory analyses provide useful initial characterizations of travel behavior. However, the paper's current value as a dataset description is substantially weakened by internal inconsistencies in the headline-scale claims and the collection window, which must be resolved before the description can be trusted.
major comments (4)
- [Abstract; Section 3; Section 5.2] The claim of "approximately 500 million" GPS points is arithmetically inconsistent with the reported trip statistics. With 80,697 validated trips, a mean trip duration of 29.97 minutes (Fig. 8), and a 2–3 s sampling interval, the expected number of in-trip points is about 50–80 million (80,697 × 29.97 × 60 / 2.5 ≈ 58 million), roughly an order of magnitude below 500 million. Since Section 3 states that all non-trip points are discarded and Section 2 states that the device logs only during movement, the 500 million count implies either an average trip duration of about 4.3 hours, a sub-second sampling rate, or the inclusion of non-trip points—each contradicting the stated protocol. Please reconcile this discrepancy and specify the exact point count in the released GPS database.
- [Section 5.2 vs. Section 2 and Abstract] The data collection window is described inconsistently: Section 2 and the abstract state that data were collected between mid-October 2022 and mid-May 2023 (20 weeks), while Section 5.2 states that the dataset covers October 17, 2022 to January 15, 2023. Moreover, Fig. 5(a) shows trip activity between 2023-03-25 and 2023-04-15, which falls outside the January 15 end date. This contradiction affects all temporal-coverage claims and any analyses of daily, weekly, or seasonal patterns. The actual dates present in the released data must be clarified.
- [Section 4.4 and Section 5.1] The representativity evaluation in Section 5.1 is partially circular. The individual weights constructed in Section 4.4 are calibrated to INSEE census margins (department, age, sex, socio-professional category, household size, etc.), and the weighted age and sex distributions in Section 5.1 are then compared to those same INSEE margins. The resulting "good alignment" is a direct consequence of the calibration procedure, not an independent validation of sample representativity. The chi-squared test on raw counts (Fig. 3) is a valid check of the unweighted sample, but the paper should distinguish raw-sample goodness-of-fit from weighted alignment and ideally validate the weights on variables or margins not used in calibration (e.g., against the EGT survey or withheld INSEE variables).
- [Section 2] The interpretation of GPS gaps as stationary periods or absence of mobility relies on the assumption that participants carried the BT-Q1000XT continuously for seven days and that the motion-triggered logging reliably captures short or slow trips. The paper does not report any compliance statistics (e.g., the fraction of participants with valid recordings on all seven days, the distribution of daily recording durations) or a validation of the device's motion-trigger behavior against the logbook data. Without such information, the completeness of individual daily trajectories and the interpretation of "No Trip" days are difficult to assess. Please add any available compliance checks or explicitly discuss this limitation in the data collection description.
minor comments (5)
- [Abstract] The phrase "an unique GPS-based mobility dataset" should be corrected to "a unique GPS-based mobility dataset".
- [Figure 5] The caption says "estimated weighted number of trips per date and per hour," but panel (a) is aggregated per date and panel (b) per hour; clarify this in the caption to avoid confusion.
- [Table 3] The orientation of the inter-departmental flow matrix (rows as origin or destination) should be stated explicitly in the caption; currently the reader must infer the meaning from the percentages and diagonal dominance.
- [Section 4.4] The description of the weight calibration would benefit from the exact calibration formula or a direct reference to the documentation on how the pairwise marginal distributions are combined, since readers may want to replicate or evaluate the weighting procedure.
- [Figure 9] The mode labels in the figure panels appear truncated (e.g., "ELECT_BIKE"); ensure the final version uses complete and readable mode names, and define abbreviations such as PRIV_CAR_DRIVER.
Circularity Check
Post-stratification alignment with INSEE is guaranteed by construction; no load-bearing circularity in the core dataset description.
-
fitted input called prediction
[Section 4.4 (Weight construction) and Section 5.1 (Individual-Level Statistics, Fig. 4).]
"To ensure representativeness, calibration weights were computed independently for individuals and trips using pairwise marginal distributions derived from census statistics. As a corrective, post-stratification weights are applied to each individual to restore representativity (Fig. 4)."
The individual weights are calibrated so their weighted margins match INSEE census counts for department, age, sex, socio-professional category, household size, car ownership, and diploma. The 'good alignment' with INSEE shown after weighting in Section 5.1 is therefore the calibration constraint restated, not an independent empirical validation. The paper presents this weighted alignment as evidence of representativity, but it is forced by the construction of the weights. The unweighted chi-square test against INSEE (p = 1.2e-9) is an independent demonstration of the original sample imbalance, so the tautology affects only the post-weighting alignment claim.
full rationale
This is a dataset description paper rather than a derivation-based or predictive paper, so most circularity patterns do not apply. The only reduction-by-construction found is the representativity check: weights are calibrated to INSEE margins in Section 4.4, then Section 5.1 presents the resulting weighted INSEE alignment as a positive characterization. That alignment is guaranteed by the calibration, but it is not the central claim and does not affect the released GPS, trip, or individual data. The paper's notable internal inconsistencies, for example the roughly 500 million claimed GPS points versus about 80 thousand validated trips at 2-3 second sampling and the conflicting collection-window dates in Section 5.2 versus the abstract, are quantitative correctness or data-quality issues rather than circularity and are not scored here. No load-bearing self-citations, imported uniqueness theorems, or ansatz-smuggling steps are present. Score 2 reflects a minor tautological validation claim within an otherwise self-contained dataset description.
Assumptions & free parameters
assumptions (5)
- domain assumption The BT-Q1000XT device logs positions only when motion is detected, so gaps in the recorded traces correspond to stationary periods or absence of mobility, not signal loss.
- domain assumption Proprietary processing by Hove plus follow-up phone interviews produce correct trip boundaries, modes, and purposes.
- domain assumption Post-stratification weights calibrated to census marginal distributions make the volunteer sample representative of the Ile-de-France population.
- ad hoc to paper Blurring the first and last points of each trip to H3 resolution 10 centroids is sufficient for GDPR-compliant anonymization while preserving analytical utility.
- domain assumption GPS points outside validated trips carry no useful mobility information and can be discarded.
Cite this review
Pith. "Pith review of The NetMob25 Dataset: A High-resolution Multi-layered View of Individual Mobility in Greater Paris Region." pith.science (2026). https://pith.science/paper/3KBVPX3K
@misc{pith2026250605903,
  author       = {Pith},
  title        = {Pith review of: The NetMob25 Dataset: A High-resolution Multi-layered View of Individual Mobility in Greater Paris Region},
  year         = {2026},
  howpublished = {\url{https://pith.science/paper/3KBVPX3K}},
  note         = {Machine review of arXiv:2506.05903}
}
read the original abstract
High-quality mobility data remains scarce despite growing interest from researchers and urban stakeholders in understanding individual-level movement patterns. The Netmob25 Data Challenge addresses this gap by releasing a unique GPS-based mobility dataset derived from the EMG 2023 GNSS-based mobility survey conducted in the Ile-de-France region (Greater Paris area), France. This dataset captures detailed daily mobility over a full week for 3,337 volunteer residents aged 16 to 80, collected between October 2022 and May 2023. Each participant was equipped with a dedicated GPS tracking device configured to record location points every 2-3 seconds and was asked to maintain a digital or paper logbook of their trips. All inferred mobility traces were algorithmically processed and validated through follow-up phone interviews. The dataset includes three components: (i) an Individuals database describing demographic, socioeconomic, and household characteristics; (ii) a Trips database with over 80,000 annotated displacements including timestamps, transport modes, and trip purposes; and (iii) a Raw GPS Traces database comprising about 500 million high-frequency points. A statistical weighting mechanism is provided to support population-level estimates. An extensive anonymization pipeline was applied to the GPS traces to ensure GDPR compliance while preserving analytical value. Access to the dataset requires acceptance of the challenge's Terms and Conditions and signing a Non-Disclosure Agreement. This paper describes the survey design, collection protocol, processing methodology, and characteristics of the released dataset.
Figures


Figures from the paper (19 more)


Forward citations
Cited by 1 Pith paper
-
Paris as a 15-Minute City: An Explainable AI Perspective
Using 70,000 trip segments from the NetMob 2025 Paris dataset, the paper finds that higher local POI availability is associated with less car use and more active travel in central Paris, with weaker effects in outer a...
Reference graph
Works this paper leans on
-
[1]
A multi-source dataset of urban life in the city of milan and the province of trentino
Gianni Barlacchi, Marco De Nadai, Roberto Larcher, Antonio Casella, Cristiana Chitic, Giovanni Torrisi, Fabrizio Antonelli, Alessandro Vespignani, Alex Pentland, and Bruno Lepri. A multi-source dataset of urban life in the city of milan and the province of trentino. Scientific Data , 2(1):150055, 2015
work page 2015
-
[2]
Bittencourt and Mariana Giannotti
Tain´ a A. Bittencourt and Mariana Giannotti. Evaluating the accessibility and availability of public services to reduce inequalities in everyday mobility. Transportation Research Part A: Policy and Practice, 177:103833, 2023
work page 2023
-
[3]
Vincent D. Blondel, Markus Esch, Connie Chan, Fabrice Clerot, Pierre Deville, Etienne Huens, Fr´ ed´ eric Morlot, Zbigniew Smoreda, and Cezary Ziemlicki. Data for development: the d4d challenge on mobile phone data, 2013
work page 2013
-
[4]
Yves-Alexandre de Montjoye, Zbigniew Smoreda, Romain Trinquart, Cezary Ziemlicki, and Vincent D. Blondel. D4d-senegal: The second mobile phone data for development challenge, 2014
2014
-
[5]
The death and life of great italian cities: A mobile phone data perspective
Marco De Nadai, Jacopo Staiano, Roberto Larcher, Nicu Sebe, Daniele Quercia, and Bruno Lepri. The death and life of great italian cities: A mobile phone data perspective. In Proceedings of the 25th International Conference on World Wide Web , WWW ’16, page 413–423, Republic and Canton of Geneva, CHE, 2016. International World Wide Web Conferences Steering...
work page 2016
-
[6]
Foursquare. Future cities challenge. https://location.foursquare.com/resources/blog/ leadership/how-location-technology-can-drive-urban-innovation/ , 2018. Accessed: 2025-06- 06
work page 2018
-
[7]
Big data for development: preventing the spread of epidemics
International Telecommunication Union. Big data for development: preventing the spread of epidemics. https://www.itu.int/en/ITU-D/Emergency-Telecommunications/Pages/BigData/ default.aspx, n.d. Accessed: 2025-06-06
work page 2025
-
[8]
Ghazaleh Khodabandelou, Vincent Gauthier, Marco Fiore, and Mounim A. El-Yacoubi. Estimation of static and dynamic urban populations with mobile network metadata. IEEE Transactions on Mobile Computing, 18(9):2034–2047, 2019
work page 2019
Show all 21 references
-
[9]
Understanding commuting patterns using transit smart card data
Xiaolei Ma, Congcong Liu, Huimin Wen, Yunpeng Wang, and Yao-Jan Wu. Understanding commuting patterns using transit smart card data. Journal of Transport Geography, 58:135–145, 2017
2017
-
[10]
The netmob23 dataset: A high-resolution multi-region service-level mobile data traffic cartography, 2023
Orlando E Mart ´ ınez-Durive, Sachit Mishra, Cezary Ziemlicki, Stefania Rubrichi, Zbigniew Smoreda, and Marco Fiore. The netmob23 dataset: A high-resolution multi-region service-level mobile data traffic cartography, 2023. 1https://drive.google.com/file/d/13Jssi358EDWu9Jf4DROT...
2023
-
[11]
Mobility patterns are associated with experienced income segregation in large us cities
Esteban Moro, Dan Calacci, Xiaowen Dong, and Alex Pentland. Mobility patterns are associated with experienced income segregation in large us cities. Nature Communications, 12(1):4633, 2021
2021
-
[12]
M. M. Nyhan, I. Kloog, R. Britter, C. Ratti, and P. Koutrakis. Quantifying population exposure to air pollution using individual mobility patterns inferred from mobile phone data. Journal of Exposure Science & Environmental Epidemiology , 29(2):238–247, 2019
2019
-
[13]
BT-Q1000XT GPS Travel Recorder User Manual , 2010
Qstarz International Co. BT-Q1000XT GPS Travel Recorder User Manual , 2010. Accessed: 2025-05- 27
2010
-
[14]
Enquˆ ete r´ egionale sur la mobilit´ e des franciliens
Institut Paris Region. Enquˆ ete r´ egionale sur la mobilit´ e des franciliens. https://www.institutparisregion.fr/mobilite-et-transports/deplacements/ enquete-regionale-sur-la-mobilite-des-franciliens/ , 2023. Accessed: 2025-06-03
2023
-
[15]
Slides: Enquˆ ete mobilit´ e par gnss (emg) premiers r´ esultats et potentiel des bases de donn´ ees
Institut Paris Region. Slides: Enquˆ ete mobilit´ e par gnss (emg) premiers r´ esultats et potentiel des bases de donn´ ees. https://infogram.com/premiers-resultats-emg-1hxj48mp3xy3q2v , 2023. Accessed: 2025-06-03
2023
-
[16]
Data for refugees: The d4r challenge on mobility of syrian refugees in turkey, 2018
Albert Ali Salah, Alex Pentland, Bruno Lepri, Emmanuel Letouze, Patrick Vinck, Yves-Alexandre de Montjoye, Xiaowen Dong, and Ozge Dagdelen. Data for refugees: The d4r challenge on mobility of syrian refugees in turkey, 2018
2018
-
[17]
Estimation of urban zonal speed dynamics from user-activity-dependent positioning data and regional paths
Manon Seppecher, Ludovic Leclercq, Angelo Furno, Delphine Lejri, and Thamara Vieira da Rocha. Estimation of urban zonal speed dynamics from user-activity-dependent positioning data and regional paths. Transportation Research Part C: Emerging Technologies, 129:103183, 2021
2021
-
[18]
The netmob25 dataset: A high-resolution multi-layered view of individual mobility in greater paris region
NetMob 2025 Data Challenge Team. The netmob25 dataset: A high-resolution multi-layered view of individual mobility in greater paris region. https://gitlab.inria.fr/netmob2025/data-challenge/ -/blob/main/docs/NetMob25%20Dataset%20Slides.pdf, 2025. Accessed: 2025-06-02
2025
-
[19]
News or social media? socio-economic divide of mobile service consumption
I˜ naki Ucar, Marco Gramaglia, Marco Fiore, Zbigniew Smoreda, and Esteban Moro. News or social media? socio-economic divide of mobile service consumption. Journal of the Royal Society Interface , 18(185):20210350, December 2021
2021
-
[20]
Aggregated mobility and density data for the netmob 2024 data chal- lenge
World Bank. Aggregated mobility and density data for the netmob 2024 data chal- lenge. https://datacatalog.worldbank.org/search/dataset/0066094/aggregated_mobility_and_ density_data_for_the_netmob_2024_data_challenge, 2024. Accessed: 2025-06-06
2024
-
[21]
Jones, P
Takahiro Yabe, Nicholas K.W. Jones, P. Suresh C. Rao, Marta C. Gonzalez, and Satish V. Ukkusuri. Mobile phone location data for disasters: A review from natural hazards and epidemics. Computers, Environment and Urban Systems , 94:101777, 2022. 26
2022
Reviewed August 7, 2026 · model on record in the stance chip above.
Discussion (0). Sign in to comment.