REVIEW 3 major objections 5 minor 66 references
Robustness of complexity estimation in event-driven signals against accuracy of event detection method
T0 review · 3 major / 5 minor · reviewed 2026-08-07 · deepseek-v4-flash
Pith's one-line read Temporal complexity estimates can survive, and even benefit from, false-positive events.
desk verdict A solid, useful empirical validation of EDDiS robustness, but the 'improvement with false positives' headline is confounded by unseparated false-positive and false-negative rates. read the letter →
The pith
A machine-rendered reading of the paper's core claim, the machinery that carries it, and where it could break.
The reading
What carries the argument
The mechanism is event-driven diffusion as implemented by EDDiS: detected events define a counting process X(t) = #{n : t_n < t} under the asymmetric-jump rule, and two scaling analyses run on this diffusion — Detrended Fluctuation Analysis for the second-moment scaling H and Diffusion Entropy for the PDF scaling delta. Both are anchored to theoretical relations H(mu) and delta(mu) from continuous-time random walk theory for renewal point processes. The companion piece is the RTEF detector, built on threshold crossings of the derivative of the signal envelope, applied here to the Hilbert envelope of a damped-oscillator response convolved with an event pulse train plus additive Gaussian noise. The paper's key observation is that the statistics of the detected events, H and delta, are robust even when the detection counts themselves are far from accurate.
What would settle it
Generate the same synthetic signals but add false positives as an independent Poisson process at the measured rates, then run the RTEF-EDDiS pipeline: if H falls toward 0.5 as the false-positive rate rises, the robustness claim depends on false positives being clustered around true events rather than independent. A direct check is to compute the waiting-time distribution or cross-correlation between detected and true event times to test that clustering premise.
Extended reading notes
Core claim
The central claim is that the EDDiS algorithm is able to decrease the masking effect of false positives and consequently the error in the estimation of temporal complexity. Concretely, applying RTEF with low percentile thresholds produces detected event counts two to ten times the real number of RTEs, yet for inverse power-law IETs with mu up to 2.5 the estimated H from the detected events is as accurate as, or better than, the reference error obtained from the true event sequence; best-case mean relative errors of H fall around 4-7%. The dependence is counter-intuitive: for power-law signals, accuracy in H improves as the percentile decreases and false positives increase, whereas the opposite trend holds for exponential IETs. The paper interprets this within EDDiS's design principle, rooted in diffusion processes driven by crucial events, where secondary noisy events tend to generate normal diffusion while complex events generate anomalous diffusion, so the scaling of the second moment remains dominated by the true complex events.
Load-bearing premise
The robustness result assumes the detector's false positives are statistically associated with the true event times rather than forming an independent Poisson background, but the paper never measures false-positive and false-negative rates separately.
Editorial extensions
If this is right
- For signals driven by power-law IETs with mu <= 2.5, running the detector at low percentile thresholds to capture true events will not degrade, and may improve, the H estimate even when false positives vastly outnumber real events.
- The second-moment scaling H is a more reliable complexity index than the diffusion entropy delta in this pipeline, with delta errors typically two to four times larger in power-law cases.
- The exponential (Poisson) case behaves oppositely: H accuracy worsens as the false-positive rate rises, so detector calibration must be tuned differently for Poisson versus power-law signals.
- Complexity estimation errors of a few percent are achievable even when the event detector's raw output contains two to ten times more events than actually occurred.
- The combination of RTEF and EDDiS yields H estimates whose errors are comparable to or below the reference errors from the true event sequence, meaning the detection step is not the dominant source of uncertainty for H.
Reading between the lines
- A testable extension: if false positives were independent Poisson events rather than clustered around true events, the counting process would approach Poisson statistics on long timescales and H would fall toward 0.5, so the claimed robustness should fail in that case; the clustering of false positives is the real mechanism.
- The result suggests a detector-design principle for complexity estimation: the optimal operating point may favour high sensitivity at the cost of specificity, because EDDiS appears to preserve the scaling signature of crucial events while secondary events wash out.
- The same robustness argument should transfer to other EDDiS walking rules and to real signals such as EEG or fMRI where ground truth is unknown; a practical protocol would be to compare H across percentile settings and take the plateau as the robust estimate.
- Because delta depends on the full diffusion PDF and is more sensitive to the central region, it may carry complementary information about false-positive contamination and could serve as a diagnostic for detector reliability.
Editorial analysis
A structured set of objections, weighed in public.
Referee Report
Summary. The paper addresses the robustness of temporal-complexity estimation when the event detection step is imperfect. The authors introduce an event detector (RTEF) that identifies rapid transition events (RTEs) by thresholding the derivative of the Hilbert envelope of a noisy signal, and they evaluate the combined RTEF-EDDiS pipeline on synthetic signals with known ground-truth event times. The synthetic model generates power-law (mu = 2.3, 2.5, 2.7) or exponential inter-event-time distributions, with each event triggering a damped oscillator and additive Gaussian white noise. The core empirical finding is that, for power-law IETs, the second-moment scaling exponent H estimated by DFA has small relative errors (about 4-10%) even when the RTEF detector produces far more events than the true count, and that H errors tend to decrease as the detection percentile is lowered, i.e., as the number of apparent false positives increases. The paper also reports reference errors from applying EDDiS directly to the ground-truth IET samples and compares them with the pipeline errors.
Significance. If the central claim holds, the paper is a useful empirical contribution to event-based complexity analysis: it demonstrates that the EDDiS framework can tolerate noisy event detection in practical settings such as EEG/MEG analysis. The main strengths are the use of ground-truth simulations (exact event times are known), the systematic variation of detector parameters (percentile, frequency band, derivative window), and the reliance on established CTRW relations H(mu) and delta(mu), which are not fitted to the target quantities. However, the specific counter-intuitive claim that H estimation improves as false positives increase is not yet isolated from confounds: lowering the percentile simultaneously recovers missed true events and increases the detected-event count, and the comparison with reference errors is affected by different series lengths. The paper does not directly measure false-positive and false-negative rates or the statistical structure of the false positives, so the mechanism invoked in the discussion remains an assumption. The potential value of the result justifies additional analysis rather than rejection.
major comments (3)
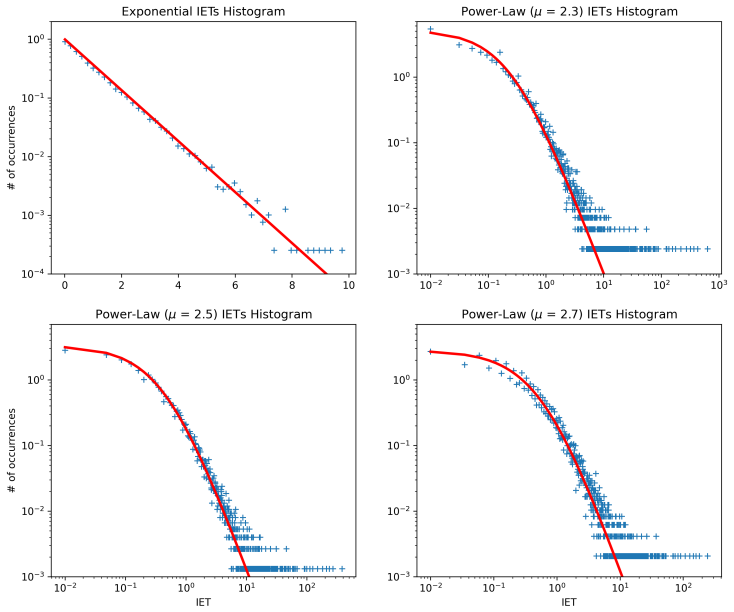
- [Section 5.2, Figure 8, Tables 3-5] The central counter-intuitive claim—that H estimation improves as the false-positive rate increases—is confounded by the percentile threshold. Lowering the RTEF percentile simultaneously (i) admits more spurious events and (ii) recovers true events that are missed at higher thresholds. Figure 8 reports only total detected event counts, not false-positive rates, false-negative rates, or precision/recall. Consequently, Tables 3-5 cannot attribute the observed improvement in MRE H to the presence of false positives; it could equally be due to the recovery of genuine RTEs that would otherwise be missed. This confound directly affects the abstract, the highlights, and the concluding interpretation in Section 6.
- [Section 6, Figures 8-10] The explanation that false positives act as 'thickened' real events rather than independent noise is an untested assumption. If the false positives were an independent Poisson process, the detected IET statistics would tend toward exponential and H would drift toward 0.5, contradicting the small H errors in Tables 3-5. The paper never measures the statistical relationship between false positives and true RTEs, such as the conditional IET distribution of false positives or their clustering near true events. I recommend adding a direct control: inject independent Poisson false positives into the ground-truth event sequence at rates matching those of Figure 8 and show that H degrades, or alternatively compute precision/recall and the false-positive IET distribution. Without this, the claimed improvement is not established as a property of the EDDiS algorithm; it may be an artifact of the specific detector's false-positive structure.
- [Tables 1, 6, Figure 8] The comparison between pipeline errors and the 'reference errors' is not a like-for-like comparison because the detected event sequences are much longer than the original M = 20000 RTE samples. Figure 8 shows detected counts roughly two to ten times larger than the true count at low percentiles, and DFA/DE finite-sample error generally decreases with series length. Thus the observation that some power-law MRE H values are smaller than the reference errors (e.g., mu = 2.3, band [8,12], 85th percentile: 0.064 vs. 0.088 in Table 3 versus Table 1) may reflect increased sample size rather than a beneficial effect of false positives. The reference errors should be recomputed on event sequences of the same length as the detected sequences, or the comparison should be restricted to the 98th-percentile case where counts are comparable.
minor comments (5)
- [Section 6] There is a typo in the first sentence of Section 6: 'stud,y' should be 'study'.
- [Figure 4 caption] The caption says 'On the first two top panels', but the figure has two panels (a) and (b); it would be clearer to refer to 'In the two top panels' or 'In each panel, the top part'.
- [Eq. (1), Section 2.1] The text says 'Nd = 5 symmetrical points' but the formula sums j = 1 to Nd, using 2*Nd sample points; the wording should be clarified, e.g., 'Nd lags on each side'.
- [Section 3, item 2] The grid size of Delta(omega_0) = 1 is given without units; specifying rad/s would make the parameter setting reproducible.
- [Throughout] The acronym 'DF A' appears with an unintended space in several places (e.g., Tables 1-5 and Section 5.1); it should be uniformly typeset as 'DFA'.
Circularity Check
No significant circularity: the RTEF-EDDiS complexity estimates are benchmarked against synthetic ground-truth signals, not fitted to or defined by the target exponents.
full rationale
The claimed result is that the EDDiS algorithm, applied to events detected by RTEF, estimates the theoretical diffusion-scaling exponents H(mu) and delta(mu) of Eqs. (5)-(6) with small mean relative errors, and that H errors improve when more false positives are present (Tables 3-5). This claim is supported by a closed simulation loop: the authors generate event sequences with known power-law or exponential IET-PDFs (Section 3), construct noisy synthetic signals from those known events, detect events with RTEF, and compare EDDiS estimates against the theoretical H and delta values associated with the known generating mu. No parameter is fitted to the target H or delta values before the comparison. Eq. (7) defines relative error against the known ground-truth values, and Table 1 reports reference errors from applying EDDiS directly to the synthetic IET samples, so the pipeline evaluation is self-contained. The theoretical H(mu) and delta(mu) relations are cited from prior CTRW/EDDiS literature, including the authors' own work, but they are not re-derived from the current results and are independently testable against the synthetic ground truth. The main caveat identified by a skeptical reader is that the paper does not directly measure the false-positive IET statistics or their clustering around true events (only total detected counts are reported in Fig. 8). That is a validity or robustness concern about whether the simulation setup generalizes, not a circularity: the paper's estimate of H is not defined in terms of RTEF's output, and the improvement phenomenon is an empirical finding on synthetic data rather than a quantity manufactured by construction. There is no equation in the paper that reduces an output to an input, and no fitted parameter is relabeled as a prediction. Accordingly, no specific circular step can be quoted, and the score is 0.
Assumptions & free parameters
free parameters (7)
- DFA/DE fit range =
not specified
- RTEF percentile threshold =
85, 90, 95, 98 (scanned)
- Derivative window Nd =
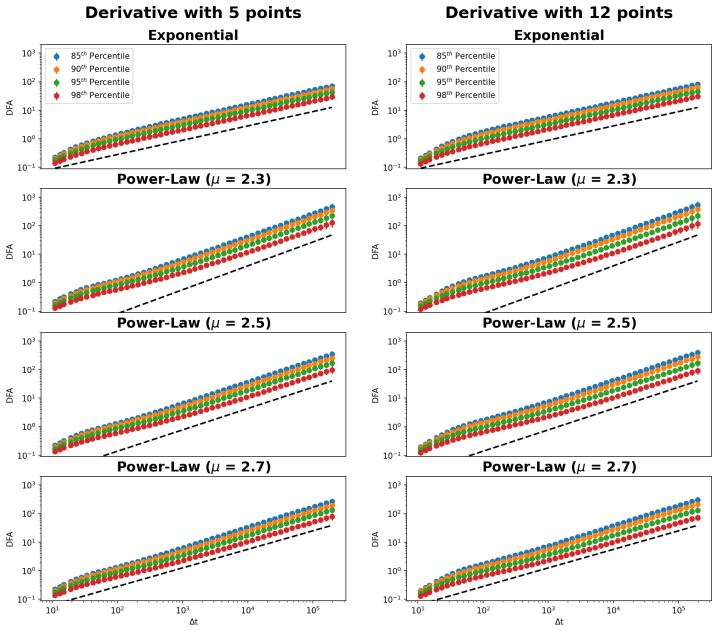
5 (main text), 12 (supplement)
- Noise variance fraction =
10% of signal variance
- Frequency band =
[0.5,4], [4,8], [8,12] Hz
- Number of IET samples M =
20000
- Sampling time Ts =
0.016 s (100 Hz)
assumptions (5)
- domain assumption The generated IET sequences are renewal processes (independent waiting times).
- standard math Equations (5)-(6) give the true scaling exponents H and delta for renewal processes with power-law IETs.
- domain assumption The DFA and DE estimators on a finite sample of M=20000 events have biases equal to the reference errors in Table 1.
- ad hoc to paper False positives generated by RTEF are clustered near true events and do not behave as an independent Poisson background.
- domain assumption The damped-oscillator response with additive white noise is a representative model of event-driven signals.
Cite this review
Pith. "Pith review of Robustness of complexity estimation in event-driven signals against accuracy of event detection method." pith.science (2026). https://pith.science/paper/GDHBGO7H
@misc{pith2026250606168,
  author       = {Pith},
  title        = {Pith review of: Robustness of complexity estimation in event-driven signals against accuracy of event detection method},
  year         = {2026},
  howpublished = {\url{https://pith.science/paper/GDHBGO7H}},
  note         = {Machine review of arXiv:2506.06168}
}
abstract
Complexity has gained recent attention in machine learning for its ability to extract synthetic information from large datasets. Complex dynamical systems are characterized by temporal complexity associated with intermittent birth-death events of self-organizing behavior. These rapid transition events (RTEs) can be modelled as a stochastic point process on the time axis, with inter-event times (IETs) revealing rich dynamics. In particular, IETs with power-law distribution mark a departure from the Poisson statistics and indicate the presence of nontrivial complexity that is quantified by the power-law exponent $\mu$ of the IET distribution. However, detection of RTEs in noisy signals remains a challenge, since false positives can obscure the statistical structure of the underlying process. In this paper, we address the problem of quantifying the effect of the event detection tool on the accuracy of complexity estimation. This is reached through a systematic evaluation of the Event-Driven Diffusion Scaling (EDDiS) algorithm, a tool exploiting event-driven diffusion to estimate temporal complexity.After introducing the event detection method RTE-Finder (RTEF), we assess the performance of the RTEF-EDDiS pipeline using event-driven synthetic signals. The reliability of the RTEF is found to strongly depend on parameters such as the percentile and the number of false positives can be much higher than the number of genuine complex events. Despite this, we found that the complexity estimation is quite robust with respect to the rate of false positives. For the power-law distributed IETs with $\mu\le2.5$, the second moment scaling $H$ appears to even improve as the rate of false positives increases, reaching estimation errors of about 4-7%.
Figures


Figures from the paper (7 more)




Reference graph
Works this paper leans on
-
[1]
H. Niu, Y. Chen, B. West, Why do big data and machine learning entail the fractional dynamics ?, Entropy 23 (2021) 1–32. doi: 10.3390/e23030297, dOI: 10.3390/e23030297
- [2]
-
[3]
P. Paradisi, G. Kaniadakis, A. M. Scarfone, The emergence of self-organization in complex systems - preface, Chaos Soliton Fract 81 (2015) 407–11. 40
work page 2015
-
[4]
S. Boccaletti, V. Latora, Y. Moreno, M. Chavez, D.-U. Hwang, Complex net- works: Structure and dynamics, Phys. Rep. 424 (2006) 175–308. doi: 10.1016/ j.physrep.2005.10.009, dOI: 10.1016/j.physrep.2005.10.009
-
[5]
F. Battiston, G. Cencetti, I. Iacopini, V. Latora, M. Lucas, A. Patania, J.- G. Young, G. Petri, Networks beyond pairwise interactions: Structure and dynamics, Physics Reports 874 (2020) 1 – 92. doi: 10.1016/j.physrep.2020. 05.004
-
[6]
P. Ji, J. Ye, Y. Mu, W. Lin, Y. Tian, C. Hens, M. Perc, Y. Tang, J. Sun, J. Kurths, Signal propagation in complex networks, Physics Reports 1017 (2023) 1 – 96. doi: 10.1016/j.physrep.2023.03.005
-
[7]
O. Artime, M. Grassia, M. De Domenico, J. P. Gleeson, H. A. Makse, G. Man- gioni, M. Perc, F. Radicchi, Robustness and resilience of complex networks, Nature Reviews Physics 6 (2024) 114 – 131. doi:10.1038/s42254-023-00676-y
-
[8]
E. Bullmore, O. Sporns, Complex brain networks: Graph theoretical analysis of structural and functional systems, Nature Reviews Neuroscience 10 (2009) 186 – 198. doi: 10.1038/nrn2575
doi:10.1038/nrn2575 2009
Show all 66 references
-
[9]
Rubinov, O
M. Rubinov, O. Sporns, Complex network measures of brain connectivity: Uses and interpretations, NeuroImage 52 (2010) 1059 – 1069. doi: 10.1016/ j.neuroimage.2009.10.003
2010
-
[10]
Sporns, The complex brain: connectivity, dynamics, information, Trends in Cognitive Sciences 26 (2022) 1066 – 1067
O. Sporns, The complex brain: connectivity, dynamics, information, Trends in Cognitive Sciences 26 (2022) 1066 – 1067. doi: 10.1016/j.tics.2022.08.002
2022 doi
-
[11]
Vaiana, S
M. Vaiana, S. F. Muldoon, Multilayer brain networks, Journal of Nonlinear Science 30 (2020) 2147 – 2169. doi: 10.1007/s00332-017-9436-8 . 41
2020 doi
-
[12]
C.-H. Yeh, D. K. Jones, X. Liang, M. Descoteaux, A. Connelly, Mapping struc- tural connectivity using diffusion mri: Challenges and opportunities, Journal of Magnetic Resonance Imaging 53 (2021) 1666 – 1682. doi: 10.1002/jmri.27188
2021 doi
-
[13]
Chiarion, L
G. Chiarion, L. Sparacino, Y. Antonacci, L. Faes, L. Mesin, Connectivity anal- ysis in eeg data: A tutorial review of the state of the art and emerging trends, Bioengineering 10 (2023). doi: 10.3390/bioengineering10030372
2023 doi
-
[14]
Borra, D
E. Borra, D. K. Jones, M. Parent, L. Petit, K. S. Rockland, R. J. Rushmore, D. Szczupak, Brain connectivity: complex, not chaotic, Brain Structure and Function 230 (2025). doi:10.1007/s00429-025-02943-3
2025 doi
-
[15]
Laasch, W
N. Laasch, W. Braun, L. Knoff, J. Bielecki, C. C. Hilgetag, Compari- son of derivative-based and correlation-based methods to estimate effective connectivity in neural networks, Scientific Reports 15 (2025). doi: 10.1038/ s41598-025-88596-y
2025
-
[16]
J. Gund, Y. Mishra, B. Mallick, R. K. B. Singh, Functional switching among dynamic neuronal hub-nodes in the brain induces maintenance/transition of cognitive states, Applied Network Science 10 (2025). doi: 10.1007/ s41109-024-00688-2
2025
-
[17]
Grigolini, Emergence of biological complexity: Criticality, renewal and mem- ory, Chaos Solit
P. Grigolini, Emergence of biological complexity: Criticality, renewal and mem- ory, Chaos Solit. Fractals 81 (2015) 575–88
2015
-
[18]
Paradisi, P
P. Paradisi, P. Allegrini, Intermittency-driven complexity in signal processing, in: R. Barbieri, E. P. Scilingo, G. Valenza (Eds.), Complexity and Nonlinearity in Cardiovascular Signals, Springer, Cham, 2017, pp. 161–195. doi: 10.1007/ 978-3-319-58709-7-6 . 42
2017
-
[19]
Fingelkurts, A
A. Fingelkurts, A. Fingelkurts, C. Krause, A. Kaplan, S. Borisov, M. Sams, Structural (operational) synchrony of eeg alpha activity during an auditory memory task, NeuroImage 20 (2003) 529 – 542. doi: 10.1016/S1053-8119(03) 00305-7
2003 doi
-
[20]
A. Y. Kaplan, A. A. Fingelkurts, A. A. Fingelkurts, S. V. Borisov, B. S. Dark- hovsky, Nonstationary nature of the brain activity as revealed by eeg/meg: Methodological, practical and conceptual challenges, Signal Processing 85 (2005) 2190 – 2212. doi: 10.1016/j.sigpro.2005.07.010
2005 doi
-
[21]
M. I. Rabinovich, R. Huerta, P. Varona, V. S. Afraimovich, Transient cognitive dynamics, metastability, and decision making, PLOS Computational Biology 4 (2008) 1–9. doi: 10.1371/journal.pcbi.1000072
2008 doi
-
[22]
M. I. Rabinovich, V. S. Afraimovich, C. Bick, P. Varona, Information flow dynamics in the brain, Physics of Life Reviews 9 (2012) 51–73. doi: 10.1016/j. plrev.2011.11.002
2012 doi
-
[23]
A. A. Fingelkurts, A. A. Fingelkurts, C. F. Neves, Consciousness as a phe- nomenon in the operational architectonics of brain organization: Criticality and self-organization considerations, Chaos, Solitons and Fractals 55 (2013) 13–31. doi:10.1016/j.chaos.2013.02.007, emergent...
2013 doi
-
[24]
Turalska, B
M. Turalska, B. J. West, P. Grigolini, Temporal complexity of the order param- eter at the phase transition, Physical Review E 83 (2011) 061142
2011
-
[25]
M. T. Beig, A. Svenkeson, M. Bologna, B. J. West, P. Grigolini, Critical slowing down in networks generating temporal complexity, Physical Review E 91 (2015) 012907. 43
2015
-
[26]
Mahmoodi, S
K. Mahmoodi, S. E. Kerick, P. J. Franaszczuk, T. D. Parsons, P. Grigolini, B. J. West, Complexity synchronization in emergent intelligence, Scientific Reports 14 (2024). doi: 10.1038/s41598-024-57384-5
2024 doi
-
[27]
Paradisi, P
P. Paradisi, P. Allegrini, Scaling law of diffusivity generated by a noisy telegraph signal with fractal intermittency, Chaos, Solitons and Fractals 81 (2015) 451–
2015
-
[28]
D. Cox, V. Isham, Point Processes, Chapman and Hall, London, 1980. First CRC press reprint: 2000
1980
-
[29]
Allegrini, D
P. Allegrini, D. Menicucci, R. Bedini, L. Fronzoni, A. Gemignani, P. Grigolini, B. West, P. Paradisi, Spontaneous brain activity as a source of ideal 1/f noise, Phys. Rev. E 80 (2009). doi:10.1103/PhysRevE.80.061914, dOI: 10.1103/Phys- RevE.80.061914
2009 doi
-
[30]
Allegrini, D
P. Allegrini, D. Menicucci, R. Bedini, A. Gemignani, P. Paradisi, Complex intermittency blurred by noise: theory and application to neural dynamics, Phys. Rev. E 82 (2010) 015103
2010
-
[31]
Tagliazucchi, P
E. Tagliazucchi, P. Balenzuela, D. Fraiman, D. R. Chialvo, Criticality in large- scale brain fmri dynamics unveiled by a novel point process analysis, Frontiers in Physiology 3 (2012) 15. doi: 10.3389/fphys.2012.00015
2012 arXiv
-
[32]
Tagliazucchi, M
E. Tagliazucchi, M. Siniatchkin, H. Laufs, D. R. Chialvo, The voxel-wise func- tional connectome can be efficiently derived from co-activations in a sparse spatio-temporal point-process, Frontiers in Neuroscience 10 (2016) 381. doi: 10. 3389/fnins.2016.00381. 44
2016
-
[33]
Cox, Renewal Processes, Methuen & Co., London, 1970
D. Cox, Renewal Processes, Methuen & Co., London, 1970. ISBN: 0-412-20570- X; first edition 1962
1970
-
[34]
Manneville, Intermittency, self-similarity and 1/f spectrum in dissipative dynamical systems, J
P. Manneville, Intermittency, self-similarity and 1/f spectrum in dissipative dynamical systems, J. Phys. (Paris) 41 (1980) 1235–1243. doi: 10.1051/jphys: 0198000410110123500, dOI: 10.1051/jphys:0198000410110123500
1980 doi
-
[35]
Pomeau, P
Y. Pomeau, P. Manneville, Intermittent transition to turbulence in dissipative dynamical systems, Commun. Math. Phys. 74 (1980) 189–197. doi: 10.1007/ BF01197757, dOI: 10.1007/BF01197757
1980 doi
-
[36]
Allegrini, G
P. Allegrini, G. Aquino, P. Grigolini, L. Palatella, A. Rosa, Gener- alized master equation via aging continuous-time random walks, Phys. Rev. E 68 (2003) 561231–5612311. doi: 10.1103/physreve.68.056123, dOI: 10.1103/physreve.68.056123
2003 doi
-
[37]
M. I. Rabinovich, R. Huerta, V. Afraimovich, Dynamics of sequential decision making, Phys. Rev. Lett. 97 (2006) 188103. doi: 10.1103/PhysRevLett.97. 188103
2006 doi
-
[38]
M. Zare, P. Grigolini, Criticality and avalanches in neural networks, Chaos, Solitons and Fractals 55 (2013) 80 – 94. doi: 10.1016/j.chaos.2013.05.009
2013 doi
-
[39]
Cafiso, P
M. Cafiso, P. Paradisi, Temporal complexity of a hopfield-type neural model in random and scale-free graphs, in: Proceedings of the 16th International Joint Conference on Computational Intelligence - Volume 1:NCTA2024, INSTICC, SciTePress, 2024, pp. 438–448. doi: 10.5220/00130...
2024 doi
-
[40]
Paradisi, R
P. Paradisi, R. Cesari, A. Donateo, D. Contini, P. Allegrini, Scaling laws of dif- fusion and time intermittency generated by coherent structures in atmospheric 45 turbulence, Nonlinear Proc. Geoph. 19 (2012) 113–126. P. Paradisi et al., Cor- rigendum, Nonlin. Processes Geophy...
2012
-
[41]
Grigolini, L
P. Grigolini, L. Palatella, G. Raffaelli, Asymmetric anomalous diffusion: an efficient way to detect memory in time series, Fractals 9 (2001) 439–449
2001
-
[42]
Klafter, A
J. Klafter, A. Blumen, M. Shlesinger, Stochastic pathway to anomalous diffu- sion, Phys. Rev. A 35 (1987) 3081–3085. doi: 10.1103/PhysRevA.35.3081, dOI: 10.1103/PhysRevA.35.3081
1987 doi
-
[43]
Montroll, Random walks on lattices, Proc
E. Montroll, Random walks on lattices, Proc. Symp. Appl. Math. 16 (1964) 193–220
1964
-
[44]
E. W. Montroll, G. H. Weiss, Random walks on lattices. II, J Math Phys 6 (1965) 167–181
1965
-
[45]
Montroll, Random walks on lattices
E. Montroll, Random walks on lattices. iii. calculation of first-passage times with application to exciton trapping on photosynthetic units, J. Math. Phys. 10 (1969) 753–765. doi: 10.1063/1.1664902, dOI: 10.1063/1.1664902
1969 doi
-
[46]
Montroll, H
E. Montroll, H. Scher, Random walks on lattices. iv. continuous-time walks and influence of absorbing boundaries, J. Stat. Phys. 9 (1973) 101–135. doi: 10. 1007/BF01016843, dOI: 10.1007/BF01016843
1973 doi
-
[47]
Scafetta, P
N. Scafetta, P. Grigolini, Scaling detection in time series: diffusion entropy analysis, Phys. Rev. E 66 (2002). doi: 10.1103/PhysRevE.66.036130, dOI: 10.1103/PhysRevE.66.036130
2002 doi
-
[48]
Shlesinger, Asymptotic solutions of continuous-time random walks, J
M. Shlesinger, Asymptotic solutions of continuous-time random walks, J. Stat. Phys. 10 (1974) 421–434. doi:10.1007/BF01008803, dOI: 10.1007/BF01008803. 46
1974 doi
-
[49]
Tunaley, Asymptotic solutions of the continuous-time random walk model of diffusion, J
J. Tunaley, Asymptotic solutions of the continuous-time random walk model of diffusion, J. Stat. Phys. 11 (1974) 397–408. doi: 10.1007/BF01026731, dOI: 10.1007/BF01026731
1974 doi
-
[50]
Tunaley, Some properties of the asymptotic solutions of the montroll- weiss equation, J
J. Tunaley, Some properties of the asymptotic solutions of the montroll- weiss equation, J. Stat. Phys. 12 (1975) 1–10. doi: 10.1007/BF01024180, dOI: 10.1007/BF01024180
1975 doi
-
[51]
Tunaley, Moments of the montroll-weiss continuous-time random walk for arbitrary starting time, J
J. Tunaley, Moments of the montroll-weiss continuous-time random walk for arbitrary starting time, J. Stat. Phys. 14 (1976) 461–463. doi: 10.1007/ BF01040704, dOI: 10.1007/BF01040704
1976 doi
-
[52]
Metzler, J
R. Metzler, J. Klafter, The random walk’s guide to anomalous diffusion: A fractional dynamics approach, Physics Report 339 (2000) 1 – 77. doi: 10.1016/ S0370-1573(00)00070-3
2000
-
[53]
O. Akin, P. Paradisi, P. Grigolini, Periodic trend and fluctuations: The case of strong correlation, Phys. A 371 (2006) 157–170
2006
-
[54]
O. Akin, P. Paradisi, P. Grigolini, Perturbation-induced emergence of poisson- like behavior in non-poisson systems, J. Stat. Mech.: Theory Exp. (2009) P01013. doi:10.1088/1742-5468/2009/01/P01013
2009 doi
-
[55]
G. H. Weiss, R. J. Rubin, Random walks: theory and selected applications, Advances in Chemical Physics 52 (1983) 363–505
1983
-
[56]
Shlesinger, B
M. Shlesinger, B. West, J. Klafter, L´ evy dynamics of enhanced diffusion: Ap- plication to turbulence, Phys. Rev. Lett. 58 (1987) 1100–1103. doi: 10.1103/ PhysRevLett.58.1100, dOI: 10.1103/PhysRevLett.58.1100. 47
1987 doi
-
[57]
Zaburdaev, S
V. Zaburdaev, S. Denisov, J. Klafter, L´ evy walks, Rev. Mod. Phys. 87 (2015) 483–530. doi:10.1103/RevModPhys.87.483, dOI: 10.1103/RevModPhys.87.483
2015 doi
-
[58]
Allegrini, P
P. Allegrini, P. Paradisi, D. Menicucci, M. Laurino, A. Piarulli, A. Gemignani, Self-organized dynamical complexity in human wakefulness and sleep: Different critical brain-activity feedback for conscious and unconscious states, Phys. Rev. E Stat. Nonlin. Soft Matter Phys 92 (...
2015 doi
-
[59]
C.-K. Peng, S. V. Buldyrev, S. Havlin, M. Simons, H. E. Stanley, A. L. Gold- berger, Mosaic organization of dna nucleotides, Phys. Rev. E 49 (1994) 1685–
1994
-
[60]
Hurst, Long-term storage capacity of reservoirs, Trans
H. Hurst, Long-term storage capacity of reservoirs, Trans. Am. Soc. Civil Eng. 116 (1951) 770–799. doi: 10.1061/TACEAT.0006518
1951 doi
-
[61]
Guardabasso, G
V. Guardabasso, G. De Nicolao, M. Rocchetti, D. Rodbard, Evaluation of pulse- detection algorithms by computer simulation of hormone secretion, American Journal of Physiology - Endocrinology and Metabolism 255 (1988) 18/6
1988
-
[62]
Allegrini, G
P. Allegrini, G. Aquino, P. Grigolini, L. Palatella, A. Rosa, Generalized master equation via aging continuous-time random walks, Phys. Rev. E 68 (2003) 056123. URL: https://link.aps.org/doi/10.1103/PhysRevE.68. 056123. doi:10.1103/PhysRevE.68.056123
2003 doi
-
[63]
J. W. Kantelhardt, S. A. Zschiegner, E. Koscielny-Bunde, S. Havlin, A. Bunde, H. E. Stanley, Multifractal detrended fluctuation analysis of nonstationary time series, Physica A 316 (2002) 87 – 114. doi: 10.1016/S0378-4371(02)01383-3
2002 doi
-
[64]
Allegrini, J
P. Allegrini, J. Bellazzini, G. Bramanti, M. Ignaccolo, P. Grigolini, J. Yang, 48 Scaling breakdown:a signature of aging, Physical Review E 66 (2002). doi: 10. 1103/PhysRevE.66.015101. 49
2002
-
[462]
doi:10.1016/j.chaos.2015.07.003
2015 doi
-
[1689]
doi:10.1103/PhysRevE.49.1685
Reviewed August 7, 2026 · model on record in the stance chip above.
Discussion (0). Sign in to comment.