REVIEW 3 major objections 4 minor 17 references
Wine Quality Prediction with Ensemble Trees: A Unified, Leak-Free Comparative Study
T0 review · 3 major / 4 minor · reviewed 2026-08-07 · deepseek-v4-flash
Pith's one-line read On the standard Vinho Verde wine datasets, Gradient Boosting achieves the highest weighted F1, Random Forest offers the best accuracy-to-cost trade-off, and five physicochemical variables preserve most of the predictive signal.
desk verdict Careful benchmark, but the leak-free claim is undone by unique group IDs; results are plausible but incremental. read the letter →
The pith
A machine-rendered reading of the paper's core claim, the machinery that carries it, and where it could break.
The reading
What carries the argument
The argument is carried by a fixed, staged evaluation protocol rather than a single mathematical object. After an 80:20 stratified split, the training portion is cut with five-fold StratifiedGroupKFold; inside each fold a StandardScaler is fitted, SMOTE-Tomek resampling balances classes (reducing the imbalance ratio from 20.7 to 1.04 on red and 82.9 to 1.02 on white), and inverse-frequency class weights are applied to the loss. Optuna with Tree-structured Parzen Estimator and median pruning performs 120–200 trials per model, and a two-stage feature-selection step ranks the variables by native importance and refits on the top five. All preprocessing parameters are learned only on training folds, validation and test folds stay untouched, and weighted F1 is the headline metric. This machinery is what gives the comparisons their claimed fairness and leak-free status.
What would settle it
Hash the raw feature vectors of all red and white wine records and count exact duplicates; if any duplicate rows exist, then under the paper's group definition (one unique group per record) StratifiedGroupKFold behaves like plain stratified k-fold, and those duplicates can fall on both sides of a train/validation split. Showing that this happens would falsify the specific leakage-control claim, even though the raw performance numbers could still be approximately right.
Extended reading notes
Core claim
The central discovery, on the paper's own terms, is that under a unified leakage-controlled evaluation, Gradient Boosting outperforms the other four ensembles on both wines (weighted F1 0.693 ± 0.028 red, 0.664 ± 0.016 white), followed within three percentage points by Random Forest and XGBoost; LightGBM trails slightly and CatBoost ranks last. The same evaluation shows Random Forest is the best accuracy-per-compute choice: it keeps weighted F1 around 0.65, holds the highest macro-AUC on both datasets, loses under two points after feature pruning, and finishes in under 50 minutes versus 12 hours for Gradient Boosting. A further result is that models trained on five variables retain more than 93 percent of full-model weighted F1, indicating that a few cheap chemical measurements carry most of the quality signal. The paper frames these findings as decision guidance: Gradient Boosting as the offline accuracy ceiling, Random Forest as the production default, XGBoost and LightGBM as GPU-efficient intermediates, and CatBoost as the least attractive.
Load-bearing premise
The paper's leak-free claim depends on treating each record as a one-row group, and with one row per group the grouping method cannot keep duplicate or near-identical records out of both training and validation.
Editorial extensions
If this is right
- If the comparison is accepted, Gradient Boosting becomes the reference accuracy ceiling for this dataset family, at 12 hours per five-fold study.
- Random Forest is the recommended production model: weighted F1 of 0.657 (red) and 0.651 (white), top macro-AUC, sub-fifty-minute training, and less than two-point loss after feature pruning.
- Cutting to five features reduces dimensionality by 55 percent with median weighted-F1 drops of 2.6 (red) and 3.0 (white) percentage points, so compact, low-cost feature sets are viable.
- XGBoost and LightGBM give GPU-based alternatives that finish in 2–3 hours while staying within about three percentage points of the leader.
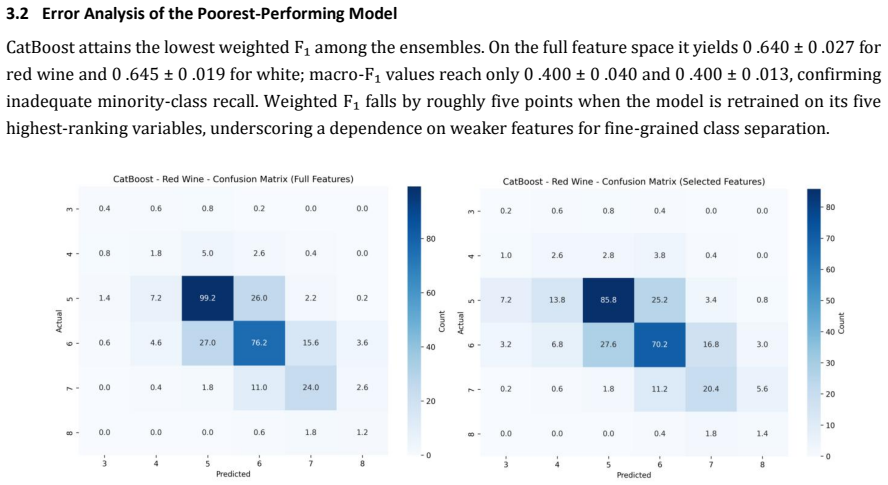
- CatBoost's sensitivity to pruning and lowest macro-F1 mark it as the least suitable choice of the five.
Reading between the lines
- Beyond the paper: since each record is its own group, the grouping step adds no protection beyond ordinary stratification; a version of this benchmark that groups by actual batch, producer, or vintage, or that de-duplicates rows, would test whether the accuracy ranking survives.
- Beyond the paper: the five-variable result suggests a practical field assay, measuring alcohol, volatile acidity, sulphates, free SO2, and chlorides could support low-cost quality screening, but that deployment claim would need validation on new vintages and regions, which the paper explicitly leaves untested.
- Beyond the paper: the stated runtime gap of roughly 14 times between Gradient Boosting and Random Forest means that for frequent retraining schedules, the small weighted-F1 advantage of Gradient Boosting may not be worth the compute; a production team could set a minimum acceptable F1 and select the fastest model above it.
- Beyond the paper: the paper excludes deep tabular networks; applying the same leak-free protocol to such models would be a direct test of whether the ensemble baseline still holds.
Editorial analysis
A structured set of objections, weighed in public.
Referee Report
Summary. This paper presents a benchmark comparison of five tree-ensemble classifiers (Random Forest, Gradient Boosting, XGBoost, LightGBM, CatBoost) on the UCI Vinho Verde red- and white-wine datasets. The pipeline includes an 80/20 stratified split, five-fold StratifiedGroupKFold on the training portion, per-fold standardisation, SMOTE-Tomek resampling, inverse-frequency class weighting, Optuna hyper-parameter search, and a two-stage feature-selection refit. The reported results identify Gradient Boosting as the accuracy leader, Random Forest as the most cost-effective model, and a five-variable feature subset as retaining most predictive signal. The main claimed contribution is a unified and leak-free methodology for comparing these models.
Significance. If the leak-free claim were valid, the paper would provide a useful reproducible benchmark for imbalanced multi-class wine-quality prediction, with transparent preprocessing, a fixed computational environment, and a wide metric set. The study does several things well: preprocessing is confined to training folds, hyper-parameter search is performed inside cross-validation, and the feature-reduction analysis is a practical contribution. The runtime profiling with a fixed node adds practical value. However, the central methodological novelty—the 'strictly leak-free evaluation'—rests on a construction that does not do what the paper claims, because unique group identifiers make StratifiedGroupKFold equivalent to plain stratified k-fold. The performance rankings also rest on a single test split without significance testing. With these fixed, the empirical comparison would be a solid benchmark study.
major comments (3)
- [2.1.1] The leak-free claim is not supported. The paper states that each wine record is assigned a unique group identifier and that StratifiedGroupKFold then prevents near-duplicate observations from appearing in both training and validation. With group sizes of one, StratifiedGroupKFold reduces exactly to StratifiedKFold; it cannot keep duplicate rows together. The UCI wine-quality data are known to contain exact duplicate rows, so duplicates can straddle the 80/20 train/test split and the CV folds. This directly undermines the abstract's 'leakage-free workflow' and the 'strictly leak-free evaluation' assertion in Section 2.1.3. The authors should either remove exact duplicates before splitting, group identical records by feature values, or otherwise demonstrate that no duplicate leakage can occur.
- [3.1 / Table A.2] The model ranking is based on a single 80/20 test split, and Table A.2 reports only point estimates. The abstract's '0.693 ± 0.028' does not correspond to a reported test-set confidence interval; it is presumably a cross-validation standard deviation, but the test-set scores in Table A.2 have no error bars. The claim that Gradient Boosting 'dominates' and that Random Forest and XGBoost form a 'second tier' requires either repeated stratified splits, bootstrap confidence intervals, or a significance test such as McNemar's test over paired predictions. As it stands, the observed differences of one to three percentage points may not be statistically reliable.
- [2.3.2] The two-stage feature-selection protocol uses the full training set to compute importance and then refits on the top-five subset before evaluating on the test set. This is not leakage, because the test set is untouched during selection, but the procedure should be described more carefully. In particular, if the same test set is used both to compare the full-feature models and to select the top-five features, the reported feature-selection results are conditional on that test set and may overstate the benefit of the chosen subset. A nested CV approach would give unbiased estimates of the pruning effect.
minor comments (4)
- [2.1.1] The phrase 'natural sample groupings' is misleading when the group identifier is unique per record; there are no actual groups in the data. This wording conflates the intended purpose of StratifiedGroupKFold with what the implementation actually does.
- [Table A.1] The caption says 'Hyperparameter grid search space for the three ensemble models,' but the table lists five models. Please correct the caption.
- [References] References [10]–[17] do not appear to be cited anywhere in the text. Please either cite them where relevant or remove them from the reference list.
- [2.3.4] The runtime comparison uses up to eight concurrent worker processes on the same node, but the paper does not say whether the wall-clock times include all eight workers or are per-run times. This should be clarified so that the efficiency comparison is interpretable.
Circularity Check
No circular derivation; headline results are empirical measurements on held-out test data.
full rationale
The paper is an empirical benchmark, not a derivation. All headline claims (Gradient Boosting's weighted F1 leadership, Random Forest's cost-effectiveness, and the five-variable feature-pruning retention) are obtained by fitting models on training folds and measuring performance on an untouched test split. There is no equation that defines a claimed output in terms of the very quantity it is supposed to predict, and no fitted parameter is renamed as a prediction: feature importances are computed on training folds, then models are retrained on the reduced subset and evaluated on the test set, so the reported F1 changes are measured outcomes, not forced identities. The paper contains no load-bearing self-citations and invokes no uniqueness theorem; the references are external or unrelated to the author (the 'Palmer & Chen' item is not authored by Zilang Chen). The StratifiedGroupKFold-with-unique-group-IDs issue in Section 2.1.1 is a genuine methodological weakness that may undermine the 'leak-free' claim because duplicate UCI rows can still appear in both train and validation partitions, but this is a correctness/validity concern, not a circularity of the form where a result reduces to its own inputs by construction. Under the stated criteria, the central empirical claims are self-contained and not circular.
Assumptions & free parameters
free parameters (6)
- StratifiedGroupKFold n_splits =
5
- Train/test split ratio =
80:20
- SMOTE k neighbors =
min(5, N-1)
- Top-5 feature budget =
5
- Minimum importance cutoff =
5%
- Optuna trial budgets =
120-200 per model
assumptions (5)
- domain assumption The UCI Vinho Verde wine quality data set is representative of wine quality in the region.
- domain assumption SMOTE-Tomek produces synthetic samples that are valid for training tree ensembles.
- domain assumption Model feature importance scores reveal which variables carry predictive signal for held-out data.
- ad hoc to paper Unique group identifiers in StratifiedGroupKFold prevent near-duplicate leakage.
- domain assumption Weighted F1 is an appropriate headline metric for imbalanced ordinal classes.
Cite this review
Pith. "Pith review of Wine Quality Prediction with Ensemble Trees: A Unified, Leak-Free Comparative Study." pith.science (2026). https://pith.science/paper/OC62HT3L
@misc{pith2026250606327,
  author       = {Pith},
  title        = {Pith review of: Wine Quality Prediction with Ensemble Trees: A Unified, Leak-Free Comparative Study},
  year         = {2026},
  howpublished = {\url{https://pith.science/paper/OC62HT3L}},
  note         = {Machine review of arXiv:2506.06327}
}
read the original abstract
Accurate and reproducible wine-quality assessment is critical for production control yet remains dominated by subjective, labour-intensive tasting panels. We present the first unified benchmark of five ensemble learners (Random Forest, Gradient Boosting, XGBoost, LightGBM, CatBoost) on the canonical Vinho Verde red- and white-wine datasets (1,599 and 4,898 instances, 11 physicochemical attributes). Our leakage-free workflow employs an 80:20 stratified train-test split, five-fold StratifiedGroupKFold within the training set, per-fold standardisation, SMOTE-Tomek resampling, inverse-frequency cost weighting, Optuna hyper-parameter search (120-200 trials per model) and a two-stage feature-selection refit. Final scores on untouched test sets are reported with weighted F1 as the headline metric. Gradient Boosting achieves the highest accuracy (weighted F1 0.693 +/- 0.028 for red and 0.664 +/- 0.016 for white), followed within three percentage points by Random Forest and XGBoost. Limiting each model to its five top-ranked variables lowers dimensionality by 55 percent while reducing weighted F1 by only 2.6 percentage points for red and 3.0 percentage points for white, indicating that alcohol, volatile acidity, sulphates, free SO2 and chlorides capture most predictive signal. Runtime profiling on an EPYC 9K84/H20 node reveals a steep efficiency gradient: Gradient Boosting averages 12 h per five-fold study, XGBoost and LightGBM require 2-3 h, CatBoost 1 h, and Random Forest under 50 min. We therefore recommend Random Forest as the most cost-effective production model, XGBoost and LightGBM as GPU-efficient alternatives, and Gradient Boosting as the accuracy ceiling for offline benchmarking. The fully documented pipeline and metric set provide a reproducible baseline for future work on imbalanced multi-class wine-quality prediction.
Figures


Figures from the paper (3 more)


Reference graph
Works this paper leans on
-
[1]
Cortez, P., Cerdeira, A., Almeida, F., Matos, T., & Reis, J. (2009). Wine Quality (data set). UCI Machine Learning Repository
work page 2009
-
[2]
Budnyak, A. (2020). Wine Rating & Price (data set). Kaggle. (Accessed 27 August 2020)
work page 2020
-
[3]
Budnyak, A. (2020). Wines: EDA and Rating Prediction. Kaggle Notebook (September 3, 2020)
work page 2020
-
[4]
Palmer, J., & Chen, B. (2018). Wineinformatics: Regression on the Grade and Price of Wines through Their Sensory Attributes. Fermentation, 4(4), 92
work page 2018
-
[5]
Liu, Z. (2023). Comparison of the red wine quality prediction accuracy using 5 machine learning models. Highlights in Science , Engineering and Technology, 11, 36–45
work page 2023
-
[6]
Patkar, G. S., & Chakkaravarthy, M. (2022). Exploration of Wine Features Using Data Analytics. Proc. INCOFT 2022, 1 –4
work page 2022
-
[7]
Zaza, S., Atemkeng, M., & Hamlomo, S. (2023). Wine Feature Importance and Quality Prediction: A Comparative Study of Machine Learning Algorithms with Unbalanced Data. Proc. SAFER -TEA 2023, 27–33
work page 2023
-
[8]
Rani, U., Jebamalai, J., & Prabu, C. (2023). Analysis of Multiclass Imbalance Handling in Red Wine Quality Dataset Using Over sampling and Machine Learning Techniques. J. Theor. Appl. Info. Tech., 101(5), 1303 –1315
work page 2023
Show all 17 references
-
[9]
R., Dahal, J
Dahal, K. R., Dahal, J. N., Banjade, H., & Gaire, S. (2021). Prediction of Wine Quality Using Machine Learning Algorithms. Open Journal of Statistics, 11(2), 278–289
2021
-
[10]
Ye, K. (2023). Wine quality prediction by several data mining classification models. Highlights in Science, Engineering and Technology
2023
-
[11]
Kaur, N., Kaur, G., Aruchamy, P., & Chaudhary, N. (2025). An Integrated Approach Based on Fuzzy Logic and Machine Learning Te chniques for Reliable Wine Quality Prediction. Procedia Computer Science
2025
-
[12]
Ma, R., Mao, D., Cao, D., Luo, S., Gupta, S., & Wang, Y. (2024). From vineyard to table: Uncovering wine quality for sales ma nagement through machine learning. Journal of Business Research
2024
-
[13]
Jindal, A., & Singh Gill, K. (2024). From Vineyard Data to Flavour Profiles: Machine Learning Predicts Wine Quality. 2024 12th International Conference on Internet of Everything, Microwave, Embedded, Communication and Networks (IEMECON), 1 -6
2024
-
[14]
Singla, M., Gill, K.S., Chauhan, R., Pokhariya, H.S., & Chanti, Y. (2024). Analysing Red Wine Quality Data Exploratorily usin g Support Vector Machines and Other Machine Learning Methods. 2024 2nd International Conference on Computer, Communication and Cont rol (IC4), 1-6
2024
-
[15]
Singla, M., Gill, K.S., Upadhyay, D., & Singh, V. (2024). Exploratory Data Analysis for Red Wine Quality Prediction Using a Decision Tree Approach and Machine Learning Methods. 2024 3rd International Conference for Innovation in Technology (INOCON), 1 -5
2024
-
[16]
Nguyen, Q.D., Le, H.V., Nakano, T., & Tran, T.H. (2024). Wine quality assessment through lightweight deep learning: integrati ng 1D-CNN and LSTM for analyzing electronic nose VOCs signals. Applied Computing and Informatics
2024
-
[17]
Dí az, R., & Solares, A. (2025). Wine quality assessment using machine learning. Advances in AI for Industrial Processes (Lect ure Notes in Computer Science, Vol. 13823). Springer. A APPENDICES A.1 Hyperparameter grid search space for the three ensemble models. Table A.1. Hype...
2025
Reviewed August 7, 2026 · model on record in the stance chip above.
Discussion (0). Sign in to comment.