REVIEW 5 major objections 7 minor 21 references
Learning based on neurovectors for tabular data: a new neural network approach
T0 review · 5 major / 7 minor · reviewed 2026-08-07 · deepseek-v4-flash
Pith's one-line read A dictionary of stored training rows, tokenized as feature-name-plus-value strings, predicts by retrieving the row that shares the most tokens with the query, and on three tabular benchmarks this matches Random Forest, gradient boosting…
desk verdict The method is condensed nearest neighbor / IB2 repackaged as 'neurovectors,' and the experimental section is not internally consistent enough to support the claims. read the letter →
The pith
A machine-rendered reading of the paper's core claim, the machinery that carries it, and where it could break.
The reading
What carries the argument
The central object is the neurovector: an entire training row represented by one node per feature, where each node is keyed by the string token formed from feature name plus value. Prediction relies on the token-count rule $\mathrm{count}(NV)=\sum_{l=1}^d \mathbf{1}[NV\in f(\tau_{j,l})]$ and the argmax $NV_m = \arg\max_{NV\in C_{nv}} \mathrm{count}(NV)$; the energy in Eqs. (9)--(10) is the tie-breaker that records each stored row's historical success. Dictionary lookups give $O(1)$ expected cost per token, so candidate retrieval is $O(d)$ and the claimed FLOP advantage follows from avoiding any weight-based computation.
What would settle it
On a synthetic regression problem with real-valued features drawn from a continuous distribution so that exact equality of feature-value strings is essentially unique, measure the fraction of predictions whose winning count equals 1 and compare the method's MAE to the MAE of choosing, among all single-token matches, the row with the highest energy. If those errors are statistically indistinguishable, exact token matching contributes no signal beyond the energy tie-breaker and the central accuracy claim fails for non-repeated continuous data.
Extended reading notes
Core claim
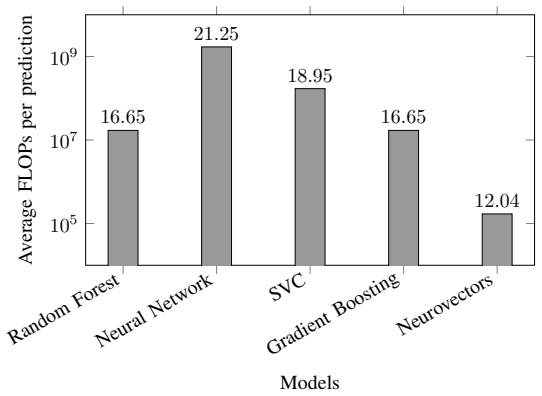
The paper claims that a predictive model for tabular data can be built without trained weights: each row is converted into a neurovector, a dictionary entry keyed by tokens of the form $\tau_{j,l} = \text{feature name}_l + v_{j,l}$. At inference a query is tokenized the same way, the dictionary returns every stored neurovector sharing at least one token, and the stored row with the highest token count is selected, with energy $E(NV)=success(NV)^2/use(NV)$ (and an error-scaled factor for regression) deciding ties. Only mispredicted training rows are added to the dictionary, so the model stores a sublinear selection of examples rather than the full training set. On the three benchmarks the resulting accuracy is competitive with all baselines and best on the wine-quality task, while per-prediction cost is about $1.70\times10^5$ FLOPs, two to four orders of magnitude below the alternatives.
Load-bearing premise
The load-bearing premise is that two rows are similar when they contain the same feature-name-plus-value strings; for real-valued data where nearly every value is unique, this leaves almost all rows tied at a single matching token, so the method's accuracy then rests on the energy-based tie-breaker, whose reliability the paper does not independently test.
Editorial extensions
If this is right
- Deploying a model can mean shipping a lookup table of stored rows rather than a weight matrix, with predictions obtained by token search and count ranking.
- Every prediction is explainable: the output is the target value of an actual training row, so a user can inspect the exact stored example that produced the answer.
- The same no-backpropagation procedure covers binary classification, multiclass classification, and regression without architecture changes or feature preprocessing.
- Because only mispredicted rows are stored and counters update incrementally, the model supports cheap online updates on streaming tabular data.
- Per-query cost near $10^5$ FLOPs would make the approach suitable for embedded or low-power deployment where tree ensembles and deep networks are too expensive.
Reading between the lines
- The mechanism is functionally a sparse exact-match nearest-neighbor rule; bucketing continuous values or adding a graded distance to the token count would be a natural extension that the paper does not explore, and it would determine whether the approach generalizes beyond repeated-value datasets.
- The efficiency comparison uses published per-node and per-sample FLOP estimates rather than measured latency, so an independent timing benchmark on identical hardware is the decisive next test of the cost claim.
- The authors' own limitation statement points to failure on long digit sequences with high variability; this suggests the method's accuracy should degrade smoothly as feature-value cardinality grows, which is a direct synthetic-data experiment.
- If the same token-store machinery is applied to natural language, the count metric will face vocabulary mismatch between query and stored tokens; whether the energy score remains a useful tie-breaker in that setting is a testable extension beyond the paper's tabular claims.
Editorial analysis
A structured set of objections, weighed in public.
Referee Report
Summary. The paper proposes "Neurovectors," a non-parametric, memory-based method for tabular classification and regression. Each training instance is stored as a Python dictionary of feature-name-plus-value string tokens; at inference, tokens of a test instance are looked up, candidate stored neurovectors are those sharing at least one token, and the prediction is taken from the neurovector with the largest exact token-overlap count, with ties broken by an energy score reflecting the neurovector's historical success. Training is "partial": a new neurovector is created only when an instance is mispredicted, and counters and energies are updated on correct predictions. Experiments on Breast Cancer Wisconsin, Absenteeism at Work, and Red Wine Quality compare the method with Random Forest, a deep neural network, SVC, and Gradient Boosting, reporting competitive accuracy/MAE and drastically lower FLOPs.
Significance. If the empirical claims were valid, the method would be an interesting, extremely cheap, parameter-light learner for small tabular datasets: the algorithm is simple, has no hidden layers or backpropagation, and the FLOPs advantage over tree ensembles and neural networks would be substantial. The paper has strengths worth acknowledging: the algorithm is described explicitly in Section III, the experimental protocol fixes seeds and gives baseline hyperparameters, and the datasets are public, so the results are in principle reproducible. However, several load-bearing internal inconsistencies and an unexplained mismatch between the described matching mechanism and the reported performance currently prevent the central claims from being accepted.
major comments (5)
- [III-B, Eq. (6)] The core matching rule is based on exact string equality of feature-name-plus-value tokens (Eq. 3) and the exact token-overlap count (Eq. 6). For real-valued features, which dominate all three datasets, an unprocessed test value rarely appears verbatim in a training row, so count(NV) is 0 or 1 for almost every stored neurovector. The algorithm then degenerates to exact-exemplar lookup with no graded similarity or interpolation, and the reported accuracy/MAE values in Table II cannot be derived from the described mechanism unless unstated discretization or float quantization is performed. The paper explicitly claims that the proposed method requires no preprocessing (Section IV-C), yet no discretization is mentioned anywhere. Please state exactly how continuous feature values are tokenized, and report the distribution of nonzero counts over the test sets to show that Eq. (6) actually carries signal.
- [IV-A vs. IV-C and Table I] The data-split description is internally contradictory: Section IV-A states a 60/20/20 train/validation/test split, while Section IV-C states a 70/30 train/test split. More seriously, the neurovector counts in Table I (456, 592, 1280) exceed both the 60% training sizes (341, 444, 959) and the 70% training sizes (398, 518, 1119) for the three datasets. The training statistics in Table I therefore cannot correspond to the described training procedure, which undermines the reproducibility of all reported results.
- [III-C, Eq. (10)] The regression energy definition is not coherent. Section III-C states that for regression "a prediction is correct if the predicted value is identical to the current value," which for a continuous target would make success essentially always zero; yet Table I reports a mean success of 2.013 for the Absenteeism dataset. Eq. (10) also mixes success with an accumulative MAE term, uses an unspecified hyperparameter α, and the sentence "therefore the MAE is 0" is incompatible with the presence of MAE in the same equation. Since the regression results are a central part of the comparison, this must be resolved and the energy values in Table I recalculated.
- [III-D, Eqs. (5)-(8)] The training procedure is underspecified for the initial stage. At the start of training, or for any instance whose tokens have no matching nodes, the candidate set Cnv from Eq. (5) is empty, so arg max in Eq. (7) is undefined and no prediction is available to determine whether the instance was misclassified. The paper does not state how the first neurovector is created or how an empty candidate set is handled. This is not a cosmetic detail: without an initialization rule, the claimed "partial training" process cannot be implemented as written.
- [IV-D, Table III, and Fig. 1] The computational-cost claims are inconsistent with the reported numbers. Table III gives total FLOPs of 2.67×10^4, 3.47×10^4, and 7.50×10^4 for the three datasets, whose average is about 4.55×10^4, yet the text concludes that the method needs about 1.70×10^5 FLOPs per prediction. Figure 1 is labeled "Average FLOPs per prediction" but its plotted values (e.g., 12.04 for Neurovectors) are not comparable to the Table III entries, and the axis appears to be in log scale without a clear meaning for the numeric labels. The per-dataset vs. per-prediction distinction is also blurred: the worked example in Section IV-D computes a total cost for 569 samples, then treats that total as a per-dataset figure. The FLOPs claim is central to the paper's significance and must be corrected and made consistent.
minor comments (7)
- [IV-C] There is a typo: "the the Gini measure" should be "the Gini measure."
- [IV-D] The processor name is misspelled: "Rizen 7 5800X" should be "Ryzen 7 5800X."
- [III-C and IV-D] The variables "M AE(N V)" and "byj" have formatting issues; the latter should be consistent with the definition of ŷ in Eq. (11).
- [IV-D, Table I] In the worked FLOPs example, the neurovector creation cost assumes 284 neurovectors ("50% neurovectors"), but Table I reports 456 neurovectors for Breast Cancer; the arithmetic should be reconciled.
- [IV-D] The text says "the energy values are very close to the success values of the neural vectors," which likely should read "neurovectors."
- [IV-D, Table I] The notation "18 (row #23)" and "13.474 (row #370)" is unexplained; it is unclear whether these refer to original dataset rows, training order, or something else.
- [IV, Fig. 1] The y-axis labels 10^5, 10^7, 10^9 together with the per-model labels such as 16.65 and 12.04 are confusing; the figure needs a clear explanation of what the plotted value represents and its units.
Circularity Check
No significant circularity: the neurovector predictor is an explicit memory lookup, and the reported comparisons are empirical rather than derived from the method's own definitions.
full rationale
The paper's derivation chain is self-contained. The prediction rule (Eqs. 3-8) defines tokens as feature-name-plus-value strings, retrieves stored neurovectors by exact token match, counts matches with Eq. 6, and outputs the target of the highest-count neurovector. This is a direct exemplar lookup; it does not fit any parameter to the target quantity it later reports as a prediction. The energy in Eqs. 9-10 is a training-time confidence statistic computed from past success and is used only to break ties after the count-based selection of Eq. 7, so it does not determine the primary predictive signal. No load-bearing self-citations or imported uniqueness theorems appear in the paper; the method is compared against standard baselines on external datasets. Potential concerns—exact-match tokenization for continuous features, inconsistent reported train splits (60% in Section IV-A vs 70% in Section IV-C), and estimated FLOP figures—are correctness or reproducibility issues, not cases where a prediction reduces by construction to its input. Even if the method is best understood as a form of nearest-neighbor lookup, renaming a known algorithm is not circularity under the specified criteria. Therefore no circular step is exhibited.
Assumptions & free parameters
free parameters (2)
- alpha (regression energy decay)
- Tokenization precision / string representation of feature values
assumptions (4)
- ad hoc to paper Energy E = success^2 / use (Eq. 9) is a better tie-breaker than random selection or raw count.
- domain assumption The number of neurovectors grows sublinearly with training set size.
- ad hoc to paper Baseline FLOP estimates from reference [21] and hand counts for the proposed method are comparable and accurate.
- domain assumption Exact string equality of feature-name+value is a sufficient similarity signal for tabular prediction.
invented entities (1)
-
Neurovector
Cite this review
Pith. "Pith review of Learning based on neurovectors for tabular data: a new neural network approach." pith.science (2026). https://pith.science/paper/DDKYRHBH
@misc{pith2026250607185,
  author       = {Pith},
  title        = {Pith review of: Learning based on neurovectors for tabular data: a new neural network approach},
  year         = {2026},
  howpublished = {\url{https://pith.science/paper/DDKYRHBH}},
  note         = {Machine review of arXiv:2506.07185}
}
read the original abstract
In this paper, we present a novel learning approach based on Neurovectors, an innovative paradigm that structures information through interconnected nodes and vector relationships for tabular data processing. Unlike traditional artificial neural networks that rely on weight adjustment through backpropagation, Neurovectors encode information by structuring data in vector spaces where energy propagation, rather than traditional weight updates, drives the learning process, enabling a more adaptable and explainable learning process. Our method generates dynamic representations of knowledge through neurovectors, thereby improving both the interpretability and efficiency of the predictive model. Experimental results using datasets from well-established repositories such as the UCI machine learning repository and Kaggle are reported both for classification and regression. To evaluate its performance, we compare our approach with standard machine learning and deep learning models, showing that Neurovectors achieve competitive accuracy.
Figures
Reference graph
Works this paper leans on
-
[1]
Y . LeCun, Y . Bengio, and G. Hinton, “Deep learning,” Nature, vol. 521, pp. 436–444, 2015
work page 2015
-
[2]
Goodfellow, Y
I. Goodfellow, Y . Bengio, and A. Courville, Deep Learning. MIT Press, 2016
2016
-
[3]
Imagenet classification with deep convolutional neural networks,
A. Krizhevsky, I. Sutskever, and G. E. Hinton, “Imagenet classification with deep convolutional neural networks,” in Proceedings of the 26th International Conference on Neural Information Processing Systems (NIPS), 2012, pp. 1097–1105
work page 2012
-
[4]
Random forests,
L. Breiman, “Random forests,” Machine Learning , vol. 45, no. 1, pp. 5–32, 2001
2001
-
[5]
Xgboost: A scalable tree boosting system,
T. Chen and C. Guestrin, “Xgboost: A scalable tree boosting system,” in Proceedings of the 22nd ACM SIGKDD International Conference on Knowledge Discovery and Data Mining , 2016, pp. 785–794
2016
-
[6]
A tutorial on energy-based learning,
Y . LeCun, S. Chopra, R. Hadsell, M. Ranzato, and L. Huang, “A tutorial on energy-based learning,” Predicting Structured Data, vol. 1, pp. 306– 323, 2006
work page 2006
-
[7]
G. E. Hinton, “Boltzmann machines,” in Proceedings of the 1985 Connectionist Models Summer School , 1985, pp. 448–454
work page 1985
-
[8]
Language models are realistic tabular data generators,
V . Borisov, K. Seßler, T. Leemann, M. Pawelczyk, and G. Kasneci, “Language models are realistic tabular data generators,” in The Eleventh International Conference on Learning Representations (ICLR) , 2023
work page 2023
Show all 21 references
-
[9]
Why do tree-based models still outperform deep learning on typical tabular data?
L. Grinsztajn, E. Oyallon, and G. Varoquaux, “Why do tree-based models still outperform deep learning on typical tabular data?” in Proceedings of the 36th International Conference on Neural Information Processing Systems (NIPS) , 2022
2022
-
[10]
Tabular data: Deep learning is not all you need,
R. Shwartz-Ziv and A. Armon, “Tabular data: Deep learning is not all you need,” Information Fusion, vol. 81, pp. 84–90, 2022
2022
-
[11]
Danets: Deep abstract networks for tabular data classifcation and regression,
J. Chen, K. Liao, Y . Wan, D. Z. Chen, and J. Wu, “Danets: Deep abstract networks for tabular data classifcation and regression,” in Proceedings of the 36th AAAI Conference on Artificial Intelligence , 2022
2022
-
[12]
Tabtransformer: Tabular data modeling using contextual embeddings,
K. Huang, C. Xiao, L. M. Glass, and J. Sun, “Tabtransformer: Tabular data modeling using contextual embeddings,” arXiv preprint, 2020
2020
-
[13]
Tabpfn: A transformer that solves small tabular classification problems in a sec- ond,
N. Hollmann, S. M ¨uller, K. Eggensperger, and F. Hutter, “Tabpfn: A transformer that solves small tabular classification problems in a sec- ond,” in Proceedings of the 11th International Conference on Learning Representations (ICLR), 2023
2023
-
[14]
Accurate predictions on small data with a tabular foundation model,
N. Hollmann, S. M ¨uller, Purucker, and L. et al., “Accurate predictions on small data with a tabular foundation model,” Nature, vol. 637, p. 319–326, 2025
2025
-
[15]
Revisiting deep learning models for tabular data,
Y . Gorishniy, I. Rubachev, V . Khrulkov, and A. Babenko, “Revisiting deep learning models for tabular data,” arXiv preprint, 2021
2021
-
[16]
Ncart: Neural classification and regression tree for tabular data,
J. Luo and S. Xu, “Ncart: Neural classification and regression tree for tabular data,” Pattern Recognition, vol. 154, p. 110578, 2024
2024
-
[17]
Revisiting nearest neigh- bor for tabular data: A deep tabular baseline two decades later,
L. Grinsztajn, E. Oyallon, and G. Varoquaux, “Revisiting nearest neigh- bor for tabular data: A deep tabular baseline two decades later,” in Proceedings of the 13th International Conference on Learning Repre- sentations (ICLR), 2025
2025
-
[18]
Neural oblivious decision ensembles for deep learning on tabular data,
S. Popov, S. Morozov, and A. Babenko, “Neural oblivious decision ensembles for deep learning on tabular data,” in 8th International Conference on Learning Representations (ICLR) , 2020
2020
-
[19]
UCI machine learning repository,
“UCI machine learning repository,” http://archive.ics.uci.edu/ml, ac- cessed: 2025-05-30
2025
-
[20]
Kaggle: Your machine learning and data science community,
“Kaggle: Your machine learning and data science community,” https: //www.kaggle.com, accessed: 2025-05-30
2025
-
[21]
A comparative study of regression machine learning algorithms: Tradeoff between accuracy and computational complexity,
D. Gzar, A. Mahmood, and M. Abbas, “A comparative study of regression machine learning algorithms: Tradeoff between accuracy and computational complexity,” Mathematical Modelling of Engineering Problems, vol. 9, no. 5, pp. 1217–1224, 2022
2022
Reviewed August 7, 2026 · model on record in the stance chip above.
Discussion (0). Sign in to comment.