REVIEW 4 major objections 6 minor 47 references
Fractional Collisions: A Framework for Risk Estimation of Counterfactual Conflicts using Autonomous Driving Behavior Simulations
T0 review · 4 major / 6 minor · reviewed 2026-08-07 · deepseek-v4-flash
Pith's one-line read Counterfactual traffic conflicts can be scored as fractional collisions that sum to real crash counts within 1%.
desk verdict The fractional collision metric is worth taking seriously, but the paper's headline 1% validation is a selection artifact, not a confirmation, and the ADS comparison mixes discrete and fractional counts. read the letter →
The pith
A machine-rendered reading of the paper's core claim, the machinery that carries it, and where it could break.
The reading
What carries the argument
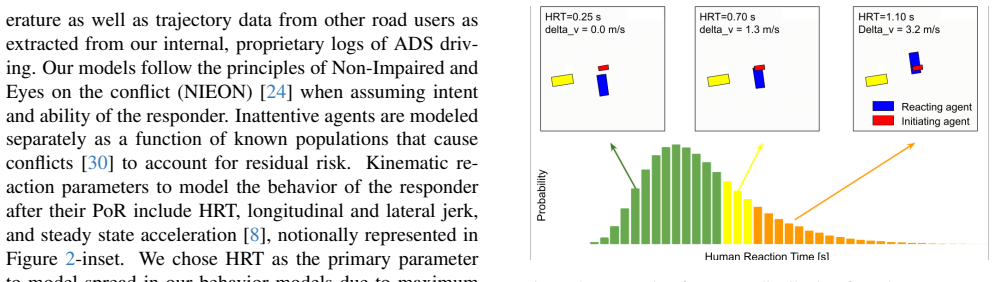
The load-bearing mechanism is the fractional collision scoring pipeline. For each two-agent conflict, the framework classifies the conflict type, assigns initiator and responder roles, determines the responder's point of reaction (the timestamp at which the human could first perceive the conflict and the clock for reaction time starts), draws counterfactual trajectories from joint distributions over human reaction time, longitudinal jerk, and steady-state acceleration, and maps each trajectory's velocity differential at impact through a crash severity model to a severity level. The output is a probability-weighted sum of severities, the fractional collision, which can be added across conflicts. The property that makes this useful is the aggregate hypothesis: over an unbiased sample of mileage, the summed fractional collisions should match the discrete ground-truth collision count, so the continuous risk signal remains calibrated to real-world crash exposure.
What would settle it
Apply the framework to a large random sample of naturalistic miles, running conflict detection, point-of-reaction labeling, and the responder models exactly as specified, and compare the summed fractional collisions with the actual crash count in that same sample by severity level; a divergence beyond the claimed 1 percent on total collisions, or systematic per-severity bias, would falsify the aggregate identity. A more targeted falsifier is a controlled early-versus-late shift of the point of reaction by about 0.2 seconds, which should change the reaction-time distribution enough to move the aggregate beyond the claimed tolerance if the metric is truly calibrated.
Extended reading notes
Core claim
The central claim is that a traffic conflict's risk can be expressed as a fractional collision: the probability-weighted sum of loss severities (no collision, L2 property damage, L1 injury, L0 higher-severity injury) over the distribution of plausible human responses after the point of reaction. When these fractional values are summed over a sample of mileage that represents the human responder population, the total is claimed to approximate the number of discrete collisions that actually occurred in that sample. The paper reports this on its selected naturalistic verification set, where the total fractional collision count was 17.15 against 17 ground-truth collisions, roughly 1% higher, and it positions this aggregate property as the justification for using fractional collisions in positive-risk-balance evaluations of ADS behavior.
Load-bearing premise
The aggregate accuracy depends on the point-of-reaction heuristic and the human reaction-time, jerk, and acceleration distributions being representative of real drivers across every operational design domain and conflict type; if the reaction-clock start is biased, the fractional totals shift across the board.
Editorial extensions
If this is right
- ADS software can be scored continuously per release, with each simulated conflict contributing an expected loss rather than a binary crash/no-crash outcome.
- Rare but dangerous agent-initiated scenarios become findable: the paper reports that on 250k miles of replay simulation only 13 of 376 conflicts showed a modeled human performing better than the ADS, allowing those scenes to be targeted for improvement.
- ADS-initiated collisions that never materialize on road can still be counted as fractional risk, e.g., six conflicts totaling 0.4 injury-causing and 1.7 property-damaging fractional collisions in the 250k-mile replay.
- The naturalistic aggregate check is reusable: any developer can validate a simulator or agent model by comparing summed fractional collisions against real crash counts in an unbiased mileage sample.
- Positive risk balance becomes a quantitative, scene-level comparison between the ADS outcome and the distribution of human outcomes rather than a single fleet-level ratio.
Reading between the lines
- If the aggregate agreement holds on uncurated random mileage, fractional collisions could be promoted from a development signal to an exposure-normalized risk metric for safety-case submissions, analogous to crash rates per mile but computed from counterfactuals.
- The same pipeline could absorb other uncertainty sources—sensor latency, controller error, responder aggressiveness—by widening the probability mass functions, a direction the paper names but does not implement.
- A sharp calibration test would be to run the framework with two different point-of-reaction definitions (surprise-based versus omniscient) and track how the aggregate total moves; the paper acknowledges point-of-reaction sensitivity but does not quantify it.
- Pose divergence in open-loop replays is tolerated for recall, but a safety case built on fractional collisions would eventually need a de-biasing step for that inflation.
Editorial analysis
A structured set of objections, weighed in public.
Referee Report
Summary. The paper introduces 'fractional collisions,' a Monte-Carlo-style risk metric that converts counterfactual two-agent conflicts into a continuous severity-weighted collision count. The framework classifies conflict type, identifies initiator and responder, estimates the responder's Point of Reaction (PoR), samples human kinematic reaction parameters (HRT, jerk, acceleration) from literature and proprietary distributions, computes delta-v via a crash severity model, and aggregates the resulting severity probabilities into a fractional collision score. The authors verify the approach on reconstructed SHRP2 and Nexar traffic scenes, reporting a 1% aggregate match against ground-truth collisions on 82 SHRP2 scenes, then apply the framework to evaluate an ADS in both synthetic and quarter-million-mile replay settings, claiming a 4x reduction in naturalistic collisions and ~62% reduction in fractional collision risk.
Significance. If the aggregate verification held, fractional collisions would be a valuable tool for ADS safety benchmarking because they are more frequent than discrete collisions, interpretable against real-world collision statistics, and usable for both AUR and PRB arguments. The manuscript is clearly written, describes a plausible end-to-end workflow, includes useful scene-level quality checks, and does not fit its parameters to the verification aggregate, which avoids a circular validation. However, the headline 'within 1%' result is not yet established, because the selected SHRP2 scene mix is not mileage-representative and the apparent agreement is a cancellation of opposite errors.
major comments (4)
- [§4.2, Table 1] The claimed 1% aggregate match does not test the stated aggregate hypothesis because the selected SHRP2 scenes are not proportionally representative of naturalistic driving. The manuscript states that the SHRP2 database has a collision-to-near-collision (C:NC) ratio of 1:15, yet the selected set has 17:65 (≈1:3.8), oversampling collisions by a factor of roughly four. Table 1 shows that the 17 collision scenes contribute 12.6 fractional collisions while the 65 near-collision scenes contribute 4.56. Reweighting the NC term to the naturalistic 255-per-17-collision ratio gives 12.6 + 4.56 × (255/65) ≈ 30.5 fractional collisions against 17 ground-truth collisions, a 79% overestimate. Thus the 17.15 ≈ 17 agreement is a selection artifact that cancels a 26% under-prediction on collision scenes with a 4.56-unit over-prediction on NC scenes. The paper must re-run the aggregate comparison on a mileage-representative sample (or reweight the existing one) and report the result, rather than presenting the selected-sample agreement as evidence for the framework's aggregate accuracy.
- [§4.2, Nexar discussion] The paper attributes Nexar's 40% under-prediction to the procured data's disproportionately high C:NC ratio, arguing that a dataset must contain statistically representative NC scenarios to predict total collisions accurately. The same logic applies symmetrically to the SHRP2 selection: the selected 17:65 ratio is also far from the naturalistic 1:15 ratio, and the paper's own reasoning implies that the SHRP2 aggregate cannot verify the unbiased-mileage hypothesis. A consistent treatment of both datasets is required—either reweight both to naturalistic conflict frequencies or present the 1% agreement only as a property of the hand-picked scene set, not as a general validation.
- [§3.2] The Point of Reaction (PoR) is a critical input: the manuscript notes that the human reaction time (HRT) distributions are measured relative to PoR and that the models are 'only valid when PoR is properly defined.' Yet PoR is currently determined by heuristics with human QA rather than an independently validated detector. Because any systematic bias in PoR timing would shift all HRT distributions and change every fractional collision estimate, the framework's accuracy claims---including the aggregate comparison in §4.2---depend on an unvalidated component. Please provide a sensitivity analysis (e.g., perturbing PoR by ±100–300 ms and reporting the resulting change in aggregate fractional collisions) or compare the heuristic PoR labels against an established surprise-based framework such as Ref. [12].
- [§4.1] The scene-level checks described in §4.1 are presented as verification, but two of the three checks only confirm internal consistency (reconstruction matches GT, and the no-reaction model is no better than GT). The more meaningful statistic---that the most probable severity matches GT in 91% of SHRP2 scenes---is reported without confidence intervals or a comparison to a baseline classifier, making it difficult to judge whether the model is genuinely predictive or merely reproducing the dominant severity class. Reporting a baseline (e.g., always-predict-NC accuracy) and per-conflict-type accuracy would strengthen the scene-level evidence.
minor comments (6)
- [§3.3] Typo: 'V olvo' should be 'Volvo'; the reference list also uses 'IS0 26262' instead of 'ISO 26262' in the text.
- [§3.4] In the paragraph describing the probabilistic collision value, the last term is listed as 'P(L2)' twice; one of these should presumably be 'P(L0)' to match the four-severity taxonomy.
- [§4.2] The sentence 'the number of discrete collisions that a NRM would had in those scenes' contains a grammatical error ('would had' should be 'would have had').
- [§5.1] 'The PRB gap in 3.5% scenes' should be 'in 3.5% of scenes'.
- [§5.2] The six ADS-initiated conflicts are described as surfacing from a quarter-million-mile replay, but the detection criterion is not specified beyond 'non-zero fractional collisions.' Clarify whether these are all conflicts found by the SSM pipeline and how false positives are handled.
- [References] Reference [18] is cited as 'ISO/PAS 26262:2018(en)' but ISO 26262 is an international standard (ISO 26262:2018) rather than a PAS; the citation should be corrected to avoid confusion.
Circularity Check
No significant circularity: fractional collisions are computed from externally sourced behavioral distributions and are not fitted to the ground-truth aggregate; the 1% match is a reported verification result, not an identity.
full rationale
The paper's derivation chain is not circular. Fractional collisions are probability-weighted severity sums (Section 3.4) built from responder behavior distributions (HRT, jerk, acceleration) attributed to external SHRP2-based studies, laboratory/field studies, and proprietary Nuro logs; the paper does not fit these distributions to the 17/65 validation scenes or to the GT total of 17. The aggregate comparison in Section 4.2 (17.15 vs 17) is reported as a verification result, not imposed by an equation or by a fitted parameter. The paper candidly notes that the selected SHRP2 C:NC ratio (17:65) differs from the database's 1:15 and states that 'the dataset must contain statistically representative NC scenarios' for accurate totals; that caveat concerns sample representativeness rather than circularity. The only author self-citation ([22], a Nature Communications risk-based driver model) is background motivation and is not load-bearing for the fractional-collision derivation. The 1% agreement may be fragile under reweighting, as a sampling critique, but that fragility is a validity limitation, not a reduction of the prediction to its inputs.
Assumptions & free parameters
free parameters (3)
- velocity-delta severity thresholds =
6 mph (L1/L2), 20 mph (L0); VRU thresholds 5 and 15 mph
- Human reaction time (HRT) distributions per conflict type =
not fully specified in paper
- Longitudinal jerk and steady-state acceleration distributions =
not specified
assumptions (4)
- domain assumption Responders behave according to NIEON (Non-Impaired and Eyes On the conflict) assumptions
- ad hoc to paper Aggregate fractional collisions should equal ground truth collisions on unbiased mileage
- domain assumption A few kinematic parameters (HRT, jerk, acceleration) suffice to model human evasive trajectories
- standard math Momentum-based crash severity model from Ref [6] is valid for the simulated impacts
Cite this review
Pith. "Pith review of Fractional Collisions: A Framework for Risk Estimation of Counterfactual Conflicts using Autonomous Driving Behavior Simulations." pith.science (2026). https://pith.science/paper/KQCJZFXU
@misc{pith2026250607540,
  author       = {Pith},
  title        = {Pith review of: Fractional Collisions: A Framework for Risk Estimation of Counterfactual Conflicts using Autonomous Driving Behavior Simulations},
  year         = {2026},
  howpublished = {\url{https://pith.science/paper/KQCJZFXU}},
  note         = {Machine review of arXiv:2506.07540}
}
read the original abstract
We present a methodology for estimating collision risk from counterfactual simulated scenarios built on sensor data from automated driving systems (ADS) or naturalistic driving databases. Two-agent conflicts are assessed by detecting and classifying conflict type, identifying the agents' roles (initiator or responder), identifying the point of reaction of the responder, and modeling their human behavioral expectations as probabilistic counterfactual trajectories. The states are used to compute velocity differentials at collision, which when combined with crash models, estimates severity of loss in terms of probabilistic injury or property damage, henceforth called fractional collisions. The probabilistic models may also be extended to include other uncertainties associated with the simulation, features, and agents. We verify the effectiveness of the methodology in a synthetic simulation environment using reconstructed trajectories from 300+ collision and near-collision scenes sourced from VTTI's SHRP2 database and Nexar dashboard camera data. Our methodology predicted fractional collisions within 1% of ground truth collisions. We then evaluate agent-initiated collision risk of an arbitrary ADS software release by replacing the naturalistic responder in these synthetic reconstructions with an ADS simulator and comparing the outcome to human-response outcomes. Our ADS reduced naturalistic collisions by 4x and fractional collision risk by ~62%. The framework's utility is also demonstrated on 250k miles of proprietary, open-loop sensor data collected on ADS test vehicles, re-simulated with an arbitrary ADS software release. The ADS initiated conflicts that caused 0.4 injury-causing and 1.7 property-damaging fractional collisions, and the ADS improved collision risk in 96% of the agent-initiated conflicts.
Figures


Figures from the paper (2 more)


Reference graph
Works this paper leans on
-
[12]
Modeling road user response timing in naturalistic traffic conflicts: A surprise-based framework
Johan Engstr ¨om, Shu-Yuan Liu, Azadeh Dinparastdjadid, and Camelia Simoiu. Modeling road user response timing in naturalistic traffic conflicts: A surprise-based framework. Accident Analysis and Prevention, 198:107460, 2024. 3
work page 2024
-
[1]
Active road user interactions with autonomous vehicles: Proactive safety as- sessment
Abdul Razak Alozi and Mohamed Hussein. Active road user interactions with autonomous vehicles: Proactive safety as- sessment. Transportation research record, 2677(7):74–89,
-
[2]
Safety assessment of autonomous cars using verification tech- niques
Matthias Althoff, Olaf Stursberg, and Martin Buss. Safety assessment of autonomous cars using verification tech- niques. In 2007 American Control Conference, pages 4154– 4159, 2007. 2
work page 2007
-
[3]
Proba- bilistic collision estimation system for autonomous vehicles
Stefan Annell, Alexander Gratne, and Lars Svensson. Proba- bilistic collision estimation system for autonomous vehicles. In Proceedings of the IEEE 19th International Conference on Intelligent Transportation Systems (ITSC), 2016. 2
work page 2016
-
[4]
Jonas B ¨argman, Malin Sv ¨ard, Simon Lundell, and Erik Hartelius. Methodological challenges of scenario genera- tion validation: a rear-end crash-causation model for virtual safety assessment. Transportation Research Part F: Traffic Psychology and Behaviour, 104:374–410, 2024. 2
work page 2024
-
[5]
The economic and societal impact of motor vehicle crashes, 2019
Lawrence Blincoe, Ted R Miller, Jing-Shiarn Wang, David Swedler, Tom Coughlin, Bruce Lawrence, Feng Guo, Sheila Klauer, and Thomas Dingus. The economic and societal impact of motor vehicle crashes, 2019. Technical Report DOT-HS-813403, National Highway Traffic Safety Admin- istration, 2022. 5
work page 2019
-
[6]
Residual crush energy partitioning, normal and tangential en- ergy losses
Raymond M Brach, Kevin J Welsh, and R Matthew Brach. Residual crush energy partitioning, normal and tangential en- ergy losses. Crash Reconstruction Research, 138:45, 2008. 4
work page 2008
-
[7]
An evaluation of bicycle- specific agility and reaction times in mountain bikers and road cyclists
Kim Buchholtz and TL Burgess. An evaluation of bicycle- specific agility and reaction times in mountain bikers and road cyclists. South African journal of sports medicine , 32 (1):1–5, 2020. 4
work page 2020
Show all 47 references
-
[8]
Counterfactual simulations applied to shrp2 crashes: The ef- fect of driver behavior models on safety benefit estimations of intelligent safety systems
Jonas B ¨argman, Christian-Nils Boda, and Marco Dozza. Counterfactual simulations applied to shrp2 crashes: The ef- fect of driver behavior models on safety benefit estimations of intelligent safety systems. Accident Analysis and Preven- tion, 102:165–180, 2017. 4
2017
-
[9]
nuscenes: A multi- modal dataset for autonomous driving
Holger Caesar, Varun Bankiti, Alex H Lang, Sourabh V ora, Venice Erin Liong, Qiang Xu, Anush Krishnan, Yu Pan, Gi- ancarlo Baldan, and Oscar Beijbom. nuscenes: A multi- modal dataset for autonomous driving. In Proceedings of the IEEE/CVF conference on computer vision and patte...
2020
-
[10]
Cummings and Ben Bauchwitz
M.L. Cummings and Ben Bauchwitz. Identifying research gaps through self-driving car data analysis. IEEE Transac- tions on Intelligent Vehicles, pages 1–10, 2024. 1, 2
2024
-
[11]
Muttart, Darlene E
Swaroop Dinakar, Jeffrey W. Muttart, Darlene E. Edewaard, Michael Giannone, and Connor Dickson. Driver response time in cut-off scenarios from the second strategic highway research program naturalistic database. Transportation Re- search Record, 2676(2):706–717, 2022. 3, 4
2022
-
[13]
Description of the shrp 2 naturalistic database and the crash, near-crash, and baseline data sets
Jonathan M Hankey, Miguel A Perez, and Julie A McClaf- ferty. Description of the shrp 2 naturalistic database and the crash, near-crash, and baseline data sets. Technical report, Virginia Tech Transportation Institute, 2016. 5
2016
-
[14]
A new com- putational perceived risk model for automated vehicles based on potential collision avoidance difficulty (pcad)
Xiaolin He, Riender Happee, and Meng Wang. A new com- putational perceived risk model for automated vehicles based on potential collision avoidance difficulty (pcad). Trans- portation Research Part C, 166(104751), 2024. 2
2024
-
[15]
Gaia-1: A generative world model for au- tonomous driving
Anthony Hu, Lloyd Russell, Hudson Yeo, Zak Murez, George Fedoseev, Alex Kendall, Jamie Shotton, and Gian- luca Corrado. Gaia-1: A generative world model for au- tonomous driving. arXiv preprint arXiv:2309.17080, 2023. 2
2023 arXiv
-
[16]
Emergency braking performance of motorcycle riders: skill identification in a real-life perception-action task designed for training purposes
Pedro Huertas-Leyva, Marilee Nugent, Giovanni Savino, Marco Pierini, Niccol `o Baldanzini, and Simon Rosalie. Emergency braking performance of motorcycle riders: skill identification in a real-life perception-action task designed for training purposes. Transportation research ...
2019
-
[17]
Road vehicles — safety of the intended functionality
ISO/PAS 21448:2022(en). Road vehicles — safety of the intended functionality. Standard, International Organization for Standardization, Geneva, CH, 2022. 1
2022
-
[18]
Road vehicles — functional safety
ISO/PAS 26262:2018(en). Road vehicles — functional safety. Standard, International Organization for Standard- ization, Geneva, CH, 2018. 4
2018
-
[19]
Road vehicles — safety and arti- ficial intelligence
ISO/PAS 8800:2024(en). Road vehicles — safety and arti- ficial intelligence. Standard, International Organization for Standardization, Geneva, CH, 2024. 1
2024
-
[20]
Nidhi Kalra and Susan M. Paddock. Driving to safety: How many miles of driving would it take to demonstrate au- tonomous vehicle reliability? Transportation Research Part A: Policy and Practice, 94:182–193, 2016. 1
2016
-
[21]
Evaluation of autonomous driving safety by operational de- sign domains (odd) in mixed traffic
Hoseon Kim, Jieun Ko, Cheol Oh, and Seoungbum Kim. Evaluation of autonomous driving safety by operational de- sign domains (odd) in mixed traffic. Sustainability, 16(22): 9672, 2024. 3
2024
-
[22]
Human-like driving behaviour emerges from a risk-based driver model
Sarvesh Kolekar, Joost De Winter, and David Abbink. Human-like driving behaviour emerges from a risk-based driver model. Nature communications, 11(1):1–13, 2020. 2
2020
-
[23]
Breaking the tyranny of net risk metrics for automated vehicle safety
Philip Koopman, William H Widen, et al. Breaking the tyranny of net risk metrics for automated vehicle safety. Safety-Critical Systems eJournal, 3(1), 2024. 1
2024
-
[24]
Kusano, Kurt Beatty, Scott Schnelle, Francesca Favaro, Cam Crary, and Trent Victor
Kristofer D. Kusano, Kurt Beatty, Scott Schnelle, Francesca Favaro, Cam Crary, and Trent Victor. Collision avoidance testing of the waymo automated driving system, 2022. 4
2022
-
[25]
Framework for a conflict typology including contributing factors for use in ads safety evaluation
Kristofer D Kusano, John M Scanlon, Mattias Br ¨annstr¨om, Johan Engstr¨om, and Trent Victor. Framework for a conflict typology including contributing factors for use in ads safety evaluation. In 27th International Technical Conference on the Enhanced Safety of Vehicles (ESV) ...
2023
-
[26]
Modular vehicle sensing, assisting con- nected system, 2022
Lev Yitzhak Lavy. Modular vehicle sensing, assisting con- nected system, 2022. US Patent 11,405,235. 5
2022
-
[27]
Formal validation of probabilistic collision risk estimation for autonomous driv- ing
Philippe Ledent, Anshul Paigwar, Alessandro Renzaglia, Radu Mateescu, and Christian Laugier. Formal validation of probabilistic collision risk estimation for autonomous driv- ing. In 2019 IEEE International Conference on Cybernet- ics and Intelligent Systems (CIS) and IEEE Con...
2019
-
[28]
A method for predicting crash configurations using counterfac- tual simulations and real-world data
Alexandros Leledakis, Magdalena Lindman, Jonas ¨Osth, Li- nus W ˚agstr¨om, Johan Davidsson, and Lotta Jakobsson. A method for predicting crash configurations using counterfac- tual simulations and real-world data. Accident Analysis and Prevention, 150:105932, 2021. 2, 3
2021
-
[29]
Learning autonomous vehicle safety concepts from demonstrations
Karen Leung, Sushant Veer, Edward Schmerling, and Marco Pavone. Learning autonomous vehicle safety concepts from demonstrations. In 2023 American Control Conference (ACC), pages 3193–3200. IEEE, 2023. 2
2023
-
[30]
A farewell to brake reaction times? kinematics-dependent brake response in naturalistic rear-end emergencies
Gustav Markkula, Johan Engstr ¨om, Johan Lodin, Jonas B¨argman, and Trent Victor. A farewell to brake reaction times? kinematics-dependent brake response in naturalistic rear-end emergencies. Accident Analysis and Prevention, 95: 209–226, 2016. 4
2016
-
[31]
Fuzzy surro- gate safety metrics for real-time assessment of rear-end colli- sion risk
Konstantinos Mattas, Michail Makridis, George Botzoris, Akos Kriston, Fabrizio Minarini, Basil Papadopoulos, Fab- rizio Re, Greger Rognelund, and Biagio Ciuffo. Fuzzy surro- gate safety metrics for real-time assessment of rear-end colli- sion risk. a study based on empirical o...
2020
-
[32]
Assessing and explaining collision risk in dynamic environments for autonomous driving safety
Richa Nahata, Daniel Omeiza, Rhys Howard, and Lars Kunze. Assessing and explaining collision risk in dynamic environments for autonomous driving safety. In 2021 IEEE international intelligent transportation systems conference (ITSC), pages 223–230. IEEE, 2021. 2
2021
-
[33]
Val- idation of human benchmark models for automated driving system approval: How competent and careful are they really? Accident Analysis and Prevention, 213:107922, 2025
Pierluigi Olleja, Gustav Markkula, and Jonas B ¨argman. Val- idation of human benchmark models for automated driving system approval: How competent and careful are they really? Accident Analysis and Prevention, 213:107922, 2025. 2
2025
-
[34]
Passenger car safety beyond adas: defining remain- ing accident configurations as future priorities
Martin ¨Ostling, Nils Lubbe, Hanna Jeppsson, and Pradeep Puthan. Passenger car safety beyond adas: defining remain- ing accident configurations as future priorities. In The 26th International Technical Conference on the Enhanced Safety of Vehicles, Eindhoven, Netherlands, page...
2019
-
[35]
Modeling driver risk perception on city roads using deep learning
Peng Ping, Yuan Sheng, Wenhu Qin, Chiyomi Miyajima, and Kazuya Takeda. Modeling driver risk perception on city roads using deep learning. IEEE Access , 6:68850–68866,
-
[36]
Scanlon, Kristofer D
John M. Scanlon, Kristofer D. Kusano, Tom Daniel, Christo- pher Alderson, Alexander Ogle, and Trent Victor. Waymo simulated driving behavior in reconstructed fatal crashes within an autonomous vehicle operating domain. Accident Analysis and Prevention, 163:106454, 2021. 2, 3
2021
-
[37]
Waymo public road safety performance data
Matthew Schwall, Tom Daniel, Trent Victor, Francesca Favaro, and Henning Hohnhold. Waymo public road safety performance data. arXiv preprint arXiv:2011.00038, 2020. 1
2011 arXiv
-
[38]
On a formal model of safe and scalable self-driving cars
Shai Shalev-Shwartz, Shaked Shammah, and Amnon Shashua. On a formal model of safe and scalable self-driving cars. arXiv preprint arXiv:1708.06374, 2017. 2
2017 arXiv
-
[39]
Wijayaratna, Navreet Virdi, and Vinayak Dixit
Amolika Sinha, Sai Chand, Kasun P. Wijayaratna, Navreet Virdi, and Vinayak Dixit. Comprehensive safety assessment in mixed fleets with connected and automated vehicles: A crash severity and rate evaluation of conventional vehicles. Accident Analysis and Prevention, 142:105567, 2020. 3
2020
-
[40]
Risk control is not risk adjustment: the zero-risk theory of driver behaviour and its implications
Heikki Summala. Risk control is not risk adjustment: the zero-risk theory of driver behaviour and its implications. Er- gonomics, 31(4):491–506, 1988. 2
1988
-
[41]
Integrated safety: Es- tablishing links for a comprehensive virtual tool chain
Linus W ˚agstr¨om, Alexandros Leledakis, Jonas ¨Osth, Mag- dalena Lindman, and Lotta Jakobsson. Integrated safety: Es- tablishing links for a comprehensive virtual tool chain. In 26th International Technical Conference on the Enhanced Safety of Vehicles (ESV): Technology: Enab...
2019
-
[42]
Safety of autonomous vehicles.Journal of advanced transportation, 2020(1):8867757, 2020
Jun Wang, Li Zhang, Yanjun Huang, and Jian Zhao. Safety of autonomous vehicles.Journal of advanced transportation, 2020(1):8867757, 2020. 1
2020
-
[43]
Criticality metrics for automated driving: A review and suitability analysis of the state of the art
Lukas Westhofen, Christian Neurohr, Tjark Koopmann, Martin Butz, Barbara Sch ¨utt, Fabian Utesch, Birte Neurohr, Christian Gutenkunst, and Eckard B ¨ode. Criticality metrics for automated driving: A review and suitability analysis of the state of the art. Archives of Computati...
2023
-
[44]
Harmonized approaches for baseline creation in prospective safety performance assess- ment of driving automation systems
Peter Wimmer, O Op Den Camp, Hendrik Weber, Henri Chajmowicz, Michael Wagner, Jorge Lorente Mallada, Felix Fahrenkrog, and Florian Denk. Harmonized approaches for baseline creation in prospective safety performance assess- ment of driving automation systems. In 27th internatio...
2023
-
[45]
Exploring the in- fluence of simulated road environments on cyclist behavior
Jing Xu, Yingzi Lin, and David Schmidt. Exploring the in- fluence of simulated road environments on cyclist behavior. International Journal of Virtual Reality, 17(3):15–26, 2017. 4
2017
-
[46]
Unisim: A neural closed-loop sensor simulator
Ze Yang, Yun Chen, Jingkang Wang, Sivabalan Mani- vasagam, Wei-Chiu Ma, Anqi Joyce Yang, and Raquel Ur- tasun. Unisim: A neural closed-loop sensor simulator. In Proceedings of the IEEE/CVF Conference on Computer Vi- sion and Pattern Recognition, pages 1389–1399, 2023. 2
2023
-
[47]
How would autonomous vehicles behave in real-world crash scenarios? Accident Analysis and Prevention , 202: 107572, 2024
Rui Zhou, Guoqing Zhang, Helai Huang, Zhiyuan Wei, Hanchu Zhou, Jieling Jin, Fangrong Chang, and Jiguang Chen. How would autonomous vehicles behave in real-world crash scenarios? Accident Analysis and Prevention , 202: 107572, 2024. 2 10
2024
Reviewed August 7, 2026 · model on record in the stance chip above.
Discussion (0). Sign in to comment.