REVIEW 2 major objections 3 minor 69 references
Back-Focal-Plane Imaging and Linear Density Measurements Of Sub-Diffraction Sized Biological Filaments and Particles
T0 review · 2 major / 3 minor · reviewed 2026-08-07 · deepseek-v4-flash
Pith's one-line read Back-focal-plane detection can image sub-diffraction filaments and quantify their mass and diameter directly from optical tweezer signals.
desk verdict Useful extension of BFP detection to quantitative filament imaging; absolute diameter and linear-density values carry a shape-dependent calibration bias that needs a cylinder-aware check. read the letter →
The pith
A machine-rendered reading of the paper's core claim, the machinery that carries it, and where it could break.
The reading
What carries the argument
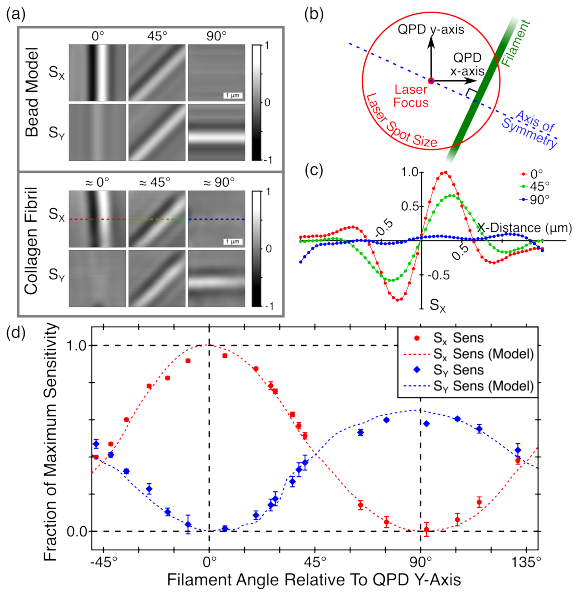
The load-bearing object is the 'bead model': a filament is divided into cylindrical sections of radius r and height h, each replaced by a spherical bead of radius r with a volume correction factor 3h/(4r), so the detector response is a convolution-like sum of shifted single-particle response templates. A single 110 nm polystyrene bead scan serves as the experimental template, and the model's angle-dependent sensitivity predicts that Sx and Sy vary with filament orientation. This machinery converts measured maximum sensitivities into absolute diameter and linear density through scaling relations and refractive-index corrections.
What would settle it
Measure the same filament with this technique and with an independent absolute method, for example electron microscopy or atomic force microscopy on the same collagen fibril or on a microtubule with a known protofilament number. If the BFP-derived diameter or linear density deviates systematically with filament diameter or protofilament count, the independent-scatterer and sphere-based polarizability assumptions fail; the linear scaling of maximum sensitivity with volume below 240 nm would also be refuted if a filament of known mass showed a nonlinear sensitivity-mass relation.
Extended reading notes
Core claim
The central claim is that BFP differential detection is quantitatively additive for weakly scattering objects: as long as the scattered field is much weaker than the unscattered beam, the interference signal at the quadrant photodiode is a sum of single-particle interference terms, so an image of a complex object equals the weighted sum of single-bead response templates. The paper confirms this by fitting three-particle and multi-particle scans as sums of a measured 110 nm bead template, and by showing that the maximum QPD sensitivity grows as the particle volume cubed for objects below about 240 nm diameter. Applying the same bead model to filaments, the paper quantifies local collagen fibril diameter from the corrected maximum sensitivity (d_cf = A*sqrt(S)) and microtubule linear density (mu_mt = 169 MDa/um), and uses the Sx/Sy orientation asymmetry to subtract point-like background from filament images.
Load-bearing premise
The absolute diameter and linear-density numbers rest on the bead model: a filament behaves as a row of independent Rayleigh-scattering spheres with a cylinder-to-sphere volume correction, with no coherent coupling among neighboring scatterers and no shape-specific polarizability for the cylindrical geometry.
Editorial extensions
If this is right
- Any optical tweezer with BFP position detection can be used as a label-free quantitative microscope without major optical modifications, needing only an additional neutral density filter to avoid trapping forces.
- Calibrated against one small reference bead, the method yields absolute mass, diameter, and linear density, removing the need for fluorescence labels that can alter filament mechanics.
- Filament diameter profiles can be measured deep inside the sample volume, far from the coverslip, as demonstrated for collagen fibrils suspended on a carbon grid 20-80 um above the surface.
- The simultaneous Sx/Sy images give a built-in background subtraction that lifts the signal-to-background ratio of microtubule images from roughly 3-6 to 10-12, comparable to established label-free techniques.
- The measured microtubule linear density of 169 MDa/um matches a 12-protofilament microtubule, suggesting that protofilament number can be inferred from a label-free measurement.
Reading between the lines
- The additivity assumption implies the method should transfer directly to networks: a network image is a superposition of filament and particle templates, so the same template-fitting machinery could disentangle crossing filaments and measure individual segment diameters, a step the paper only gestures toward in its outlook.
- Because the signal scales as wavelength^-2 for Rayleigh scatterers, switching to a shorter-wavelength laser should improve both spatial and mass resolution quadratically; the paper notes but does not test this.
- The bead model's independence assumption could be tested by imaging filaments with known substructure, such as microtubules with different protofilament numbers, and comparing measured linear densities; if neighboring protofilaments produce coherent coupling, the linear scaling with mass would fail at some diameter.
- Since the method requires only low laser power (about 0.13 mW) and works far from the coverslip, it would be natural to combine BFP imaging with simultaneous force or rheology measurements, letting a single instrument record both structure and mechanics of the same filament.
Editorial analysis
A structured set of objections, weighed in public.
Referee Report
Summary. The paper presents a scanning microscopy technique that uses back-focal-plane (BFP) detection in an optical tweezer setup to image sub-diffraction biological filaments label-free. The central idea is that the QPD signal from an extended object is a linear superposition of signals from individual point-like Rayleigh scatterers. The authors validate this additivity by fitting multi-bead images with summed single-bead templates and by comparing filament images to a 'bead model' in which a filament is represented as a row of spheres. Calibration with a 110 nm polystyrene bead establishes a volume scaling law for the maximum QPD sensitivity for objects below about 240 nm. The method is applied to measure collagen fibril α-tip diameter profiles (reported down to 13 nm diameter) and to measure a microtubule linear density of 169 MDa/µm, which the authors interpret as corresponding to a 12-protofilament microtubule. A background-subtraction scheme exploits the orientation-dependent QPD response to remove point-like protein aggregates from images of surface-bound microtubules.
Significance. If the absolute calibration is sound, this is a valuable extension of optical tweezers into label-free quantitative imaging, with the notable advantage of operating far from the coverslip surface. The additivity principle is well supported by the bead fits and the angle-dependent filament scans, and the microtubule linear density result is checked against an independent molecular-scale prediction, which is a strong point. The background-subtraction approach is clever and demonstrates a practical benefit of simultaneous two-channel detection. However, the absolute diameters and linear densities rest on an assumption for cylindrical scatterers that is not independently validated; this is a load-bearing point that limits confidence in the quantitative claims as currently stated.
major comments (2)
- [§3.2, Eqs. (12), (15), (16)] The bead model's central assumption—that a cylindrical filament section scatters like an equal-volume sphere of the same radius, using the spherical Clausius-Mossotti factor of Eq. (6)—is load-bearing for the absolute diameters in Eq. (15) and linear densities in Eq. (16), but it is not independently validated. A dielectric cylinder has depolarization factors 0 (E parallel to the axis) and 1/2 (E perpendicular), not 1/3 as for a sphere; for refractive indices near 1.5 this changes the polarizability per unit length by roughly 10–15% depending on orientation. The angle-dependent scans in Fig. 5d validate the spatial arrangement of the scatterers, but not the per-unit-length polarizability, because the same sphere-based bead model is used to predict the angular response. Without either a rigorous cylinder scattering calculation (e.g., T-matrix) or a measurement of a filament with known absolute diameter (e.g., EM of the same fibril), the reported d_cf = 58.6 nm·√S and μ_mt = 169 MDa/µm carry an unquantified systematic bias. Please add such a validation, or explicitly quantify and propagate this systematic uncertainty into the reported values and central claims.
- [§3.2, 'bead model' paragraph] The statement 'the shape of the QPD response of an object smaller than the beam waist does not depend on the object’s shape, only on the volume' is too strong. In the Rayleigh regime, the far-field pattern is dipole-like, but the polarizability tensor is shape-dependent (isotropic for a sphere, anisotropic for a cylinder with different responses for E parallel and perpendicular). The QPD signal depends on this tensor, not merely on the enclosed volume. This is the root of the calibration concern in the previous comment. The wording should be revised to acknowledge the shape dependence of the polarizability and to state the conditions under which the volume-only approximation is expected to be adequate (e.g., when the depolarization correction is within the measurement uncertainty).
minor comments (3)
- [§5, background subtraction paragraph] The sentence 'a uniform filament oriented along the QPD x−axis remains invisible in the Sy channel' is inconsistent with the symmetry argument in §3.2 and with Fig. 5d. A filament aligned with the QPD y-axis has a horizontal symmetry axis and is invisible in Sy; a filament aligned with the x-axis is invisible in Sx. The experimental data in Fig. 7 show the former case, so the text should state that the filament is aligned with the QPD y-axis.
- [§2.2, mass resolution paragraph] The phrase 'We can resolve the mass of polystyrene particles up to 950 kDa' should read 'down to' or 'as small as', since the context is a resolution limit and the quoted value is much smaller than the mass of the 110 nm reference bead (≈440 MDa).
- [§4, Eq. (15)] The numerical value A = 58.6 nm is stated without showing the intermediate values used in the simplification from Eq. (13). Please provide the values of d_bm, n_corr, and the simulated (∂S_bm_x/∂x)_max so that the calibration can be reproduced and independently checked.
Circularity Check
No significant circularity: the bead-model calibration is an external modeling assumption, not a fit to the reported outputs, and the key quantitative result is checked against an independent molecular benchmark.
full rationale
The derivation chain is self-contained rather than circular. The instrument response is calibrated on independently characterized 110 nm polystyrene beads, and the filament analysis uses an explicit 'bead model' (Section 3.2) in which a cylindrical filament is represented as a line of point-like Rayleigh scatterers with the cylinder-to-sphere volume correction of Eq. 12. This is a stated physical modeling assumption, not a parameter fitted to the collagen or microtubule data. The collagen diameter (Eq. 15) and microtubule linear density (Eq. 16) are obtained by comparing measured maximum sensitivities against this calibrated bead-model response; the microtubule result is then compared with an independent molecular prediction (12 protofilaments x 13.7 MDa/um ~ 164 MDa/um, matching the measured 169 MDa/um). The additivity approximation of Eq. 10 is validated on multi-bead samples and collagen angle scans, and the reported mass-resolution and SBR values are derived from noise statistics rather than from the target quantities. The sphere-based polarizability assumption may carry a systematic bias for real cylinders, but that is a correctness risk, not a circular reduction, because the model is not defined in terms of the measured diameters or linear densities. Self-citations (e.g., Lissek et al. 2018, Pralle et al. 1999) appear only as background and are not load-bearing for the quantitative claims.
Assumptions & free parameters
free parameters (3)
- Microtubule mass density rho_mt =
not stated
- Bead-model spacing along filament =
50 nm
- Diameter conversion prefactor A =
58.6 nm
assumptions (5)
- domain assumption Weak scattering: E_scat << E_beam so that the QPD signal is linear in the scattered field, with cross terms between scatterers neglected.
- ad hoc to paper A cylindrical filament section can be modeled by a sphere with volume correction 3h/(4r), with no shape-dependent polarizability correction.
- domain assumption Maximum QPD sensitivity scales linearly with object volume for objects below about 240 nm, independent of shape.
- domain assumption Reference values for refractive index of collagen (1.411 to 1.418) and microtubules (1.587, dry protein) are accurate under the experimental buffer conditions.
- standard math The incident laser beam is Gaussian and paraxial, and QPD signals are computed from the condenser back focal plane pattern.
Cite this review
Pith. "Pith review of Back-Focal-Plane Imaging and Linear Density Measurements Of Sub-Diffraction Sized Biological Filaments and Particles." pith.science (2026). https://pith.science/paper/VXRKA5H3
@misc{pith2026250608186,
  author       = {Pith},
  title        = {Pith review of: Back-Focal-Plane Imaging and Linear Density Measurements Of Sub-Diffraction Sized Biological Filaments and Particles},
  year         = {2026},
  howpublished = {\url{https://pith.science/paper/VXRKA5H3}},
  note         = {Machine review of arXiv:2506.08186}
}
read the original abstract
Optical tweezers equipped with position detection allow for application of piconewton-scale forces and high-temporal-resolution measurements of nanometer-scale motion. While typically used for trapping microscopic objects, the optical tweezer detection pathway can also be used for a microscopy technique sensitive to nanometer-sized structures. Optical tweezers most commonly use back-focal-plane detection to determine the position of the trapped object. This technique involves analyzing the interference pattern between scattered and unscattered light. Despite the reliance on interference, we show that an image of an extended object can be understood as a sum of the images of individual point-like particles that make up the object. This allows for optical tweezers with back-focal-plane detection to be used as an imaging tool capable of determining the mass distribution of scanned structures. Furthermore, the sample-orientation-dependent detector response allows for a unique method of background subtraction. We demonstrate the quantitative imaging capabilities of optical tweezer microscopy by determining the size distributions multiple nearby particles and measuring the changing diameter of collagen fibrils. The background subtraction technique is demonstrated by imaging surface-bound microtubules with a strong background from protein aggregate co-adsorption. Optical tweezer microscopy allows for quantitative imaging of objects far from the coverslip surface. This makes it an excellent tool for studying the link between the structure and mechanics of microscopic systems.
Figures


Figures from the paper (4 more)



Reference graph
Works this paper leans on
-
[1]
write newline
" write newline "" before.all 'output.state := FUNCTION n.dashify 't := "" t empty not t #1 #1 substring "-" = t #1 #2 substring "--" = not "--" * t #2 global.max substring 't := t #1 #1 substring "-" = "-" * t #2 global.max substring 't := while if t #1 #1 substring * t #2 global.max substring 't := if while FUNCTION word.in bbl.in ":" * " " * FUNCTION f...
-
[2]
Akhmanova, A. and Kapitein, L. C. (2022). Mechanisms of microtubule organization in differentiated animal cells. Nature Reviews Molecular Cell Biology , 23(8):541--558
work page 2022
-
[3]
Alberts, B., Johnson, A., Lewis, J., Raff, M., Roberts, K., and Walter, P. (2002). Molecular Biology of the Cell. 4th Edition . New York: Garland Science
work page 2002
-
[4]
B., Reichelt, S., Cattermole, D
Amos, W. B., Reichelt, S., Cattermole, D. M., and Laufer, J. (2003). Re-evaluation of differential phase contrast (dpc) in a scanning laser microscope using a split detector as an alternative to differential interference contrast (dic) optics. Journal of Microscopy , 210(2):166--175
work page 2003
-
[5]
Andrecka, J., Ortega Arroyo, J., Lewis, K., Cross, R. A., and Kukura, P. (2016). Label-free imaging of microtubules with sub-nm precision using interferometric scattering microscopy. Biophys J , 110(1):214--217
work page 2016
-
[6]
Ashkin, A. (1970). Acceleration and trapping of particles by radiation pressure. Phys. Rev. Lett. , 24:156--159
work page 1970
-
[7]
Ashkin, A., Dziedzic, J. M., Bjorkholm, J. E., and Chu, S. (1986). Observation of a single-beam gradient force optical trap for dielectric particles. Opt. Lett. , 11(5):288--290
work page 1986
-
[8]
Bail, A. K. and Chand, P. (2017). Dielectric Properties of Materials , chapter 1, pages 1--18. John Wiley & Sons, Ltd
work page 2017
Show all 69 references
-
[9]
Baselt, D., Revel, J., and Baldeschwieler, J. (1993). Subfibrillar structure of type i collagen observed by atomic force microscopy. Biophysical Journal , 65(6):2644--2655
1993
-
[10]
Bonnans, C., Chou, J., and Werb, Z. (2014). Remodelling the extracellular matrix in development and disease. Nature Reviews Molecular Cell Biology , 15(12):786--801
2014
-
[11]
Bugiel, M., Mitra, A., Girardo, S., Diez, S., and Schäffer, E. (2018). Measuring microtubule supertwist and defects by three-dimensional-force-clamp tracking of single kinesin-1 motors. Nano Letters , 18(2):1290--1295. PMID: 29380607
2018
-
[12]
and Brouhard, G
Chaaban, S. and Brouhard, G. J. (2017). A microtubule bestiary: structural diversity in tubulin polymers. Molecular Biology of the Cell , 28:2924 -- 2931
2017
-
[13]
and Sadoc, J.-F
Charvolin, J. and Sadoc, J.-F. (2019). Type-i collagen fibrils: From growth morphology to local order. The European Physical Journal E , 42(4):49
2019
-
[14]
Chr \'e tien, D., Metoz, F., Verde, F., Karsenti, E., and Wade, R. H. (1992). Lattice defects in microtubules: protofilament numbers vary within individual microtubules. J Cell Biol , 117(5):1031--1040
1992
-
[15]
Felgner, H., Frank, R., and Schliwa, M. (1996). Flexural rigidity of microtubules measured with the use of optical tweezers. J Cell Sci , 109 ( Pt 2):509--516
1996
-
[16]
Fletcher, D. A. and Mullins, R. D. (2010). Cell mechanics and the cytoskeleton. Nature , 463(7280):485--492
2010
-
[17]
Gautieri, A., Vesentini, S., Redaelli, A., and Buehler, M. J. (2011). Hierarchical structure and nanomechanics of collagen microfibrils from the atomistic scale up. Nano Letters , 11(2):757--766. PMID: 21207932
2011
-
[18]
and Schmidt, C
Gittes, F. and Schmidt, C. F. (1998). Interference model for back-focal-plane displacement detection in optical tweezers. Opt. Lett. , 23(1):7--9
1998
-
[19]
D., MacKintosh, F
Gittes, F., Schnurr, B., Olmsted, P. D., MacKintosh, F. C., and Schmidt, C. F. (1997). Microscopic viscoelasticity: Shear moduli of soft materials determined from thermal fluctuations. Phys. Rev. Lett. , 79:3286--3289
1997
-
[20]
Hamilton, D. K. and Sheppard, C. J. R. (1984). Differential phase contrast in scanning optical microscopy. Journal of Microscopy , 133(1):27--39
1984
-
[21]
and Asakura, T
Harada, Y. and Asakura, T. (1996). Radiation forces on a dielectric sphere in the rayleigh scattering regime. Optics Communications , 124(5):529--541
1996
-
[22]
Heussinger, C., Sch\"uller, F., and Frey, E. (2010). Statics and dynamics of the wormlike bundle model. Phys. Rev. E , 81:021904
2010
-
[23]
Hodge, A. J. and Schmitt, F. O. (1960). The charge profile of the tropocollagen macromolecule and the packing arrangement in native-type collagen fibrils<sup>*</sup>. Proceedings of the National Academy of Sciences , 46(2):186--197
1960
-
[24]
F., Chapman, J
Holmes, D. F., Chapman, J. A., Prockop, D. J., and Kadler, K. E. (1992). Growing tips of type i collagen fibrils formed in vitro are near-paraboloidal in shape, implying a reciprocal relationship between accretion and diameter. Proceedings of the National Academy of Sciences ,...
1992
-
[25]
F., Lu, Y., Starborg, T., and Kadler, K
Holmes, D. F., Lu, Y., Starborg, T., and Kadler, K. E. (2018). Chapter three - collagen fibril assembly and function. In Litscher, E. S. and Wassarman, P. M., editors, Extracellular Matrix and Egg Coats , volume 130 of Current Topics in Developmental Biology , pages 107--142. ...
2018
-
[26]
and Hyman, A
Howard, J. and Hyman, A. A. (2003). Dynamics and mechanics of the microtubule plus end. Nature , 422(6933):753--758
2003
-
[27]
M., Luki \' c , B., Jeney, S., Raizen, M
Huang, R., Chavez, I., Taute, K. M., Luki \' c , B., Jeney, S., Raizen, M. G., and Florin, E.-L. (2011). Direct observation of the full transition from ballistic to diffusive brownian motion in a liquid. Nature Physics , 7(7):576--580
2011
-
[28]
Hunyadi, V., Chrétien, D., Flyvbjerg, H., and Jánosi, I. M. (2007). Why is the microtubule lattice helical? Biology of the Cell , 99(2):117--128
2007
-
[29]
and Grubmüller, H
Igaev, M. and Grubmüller, H. (2022). Bending-torsional elasticity and energetics of the plus-end microtubule tip. Proceedings of the National Academy of Sciences , 119(12):e2115516119
2022
-
[30]
M., and Volpe, G
Jones, P., Marago, O. M., and Volpe, G. (2015). Optical Tweezers: Principles & Applications . Cambridge University Press
2015
-
[31]
E., Holmes, D
Kadler, K. E., Holmes, D. F., Trotter, J. A., and Chapman, J. A. (1996). Collagen fibril formation. Biochemical Journal , 316(1):1--11
1996
-
[32]
D., Heitkamp, N
Larson, J. D., Heitkamp, N. A., Murray, L. E., Popchock, A. R., Biggins, S., and Asbury, C. L. (2024). Kinetochores grip microtubules with directionally asymmetric strength. Journal of Cell Biology , 224(1):e202405176
2024
-
[33]
Leonard, D. W. and Meek, K. M. (1997). Refractive indices of the collagen fibrils and extrafibrillar material of the corneal stroma. Biophys J , 72(3):1382--1387
1997
-
[34]
and Aparicio, C
Li, Y. and Aparicio, C. (2013). Discerning the subfibrillar structure of mineralized collagen fibrils: a model for the ultrastructure of bone. PloS one , 8(9):e76782
2013
-
[35]
Lindfors, K., Kalkbrenner, T., Stoller, P., and Sandoghdar, V. (2004). Detection and spectroscopy of gold nanoparticles using supercontinuum white light confocal microscopy. Phys. Rev. Lett. , 93:037401
2004
-
[36]
N., Bartsch, T
Lissek, E. N., Bartsch, T. F., and Florin, E.-L. (2018). Resolving filament level mechanics in collagen networks using activity microscopy. bioRxiv
2018
-
[37]
and Zweck, J
Lubk, A. and Zweck, J. (2015). Differential phase contrast: An integral perspective. Phys. Rev. A , 91:023805
2015
-
[38]
MacAskill, A. F. and Kittler, J. T. (2010). Control of mitochondrial transport and localization in neurons. Trends in Cell Biology , 20(2):102--112
2010
-
[39]
Mahamdeh, M., Simmert, S., Luchniak, A., Sch\'' a ffer, E., and Howard, J. (2018). Label-free high-speed wide-field imaging of single microtubules using interference reflection microscopy. Journal of Microscopy , 272(1):60--66
2018
-
[40]
M., Mandelkow, E., and Milligan, R
Mandelkow, E. M., Mandelkow, E., and Milligan, R. A. (1991). Microtubule dynamics and microtubule caps: a time-resolved cryo-electron microscopy study. Journal of Cell Biology , 114(5):977--991
1991
-
[41]
M., Omer, S., Baranowski, K., and Lee, W.-L
Markus, S. M., Omer, S., Baranowski, K., and Lee, W.-L. (2015). Improved plasmids for fluorescent protein tagging of microtubules in saccharomyces cerevisiae. Traffic , 16(7):773--786
2015
-
[42]
G., Ganesan, K., van Zanten, J
Mason, T. G., Ganesan, K., van Zanten, J. H., Wirtz, D., and Kuo, S. C. (1997). Particle tracking microrheology of complex fluids. Phys. Rev. Lett. , 79:3282--3285
1997
-
[43]
u nster, S., Jawerth, L. M., Vader, D. A., Weitz, D. A., Sheppard, A. P., Mecke, K., Fabry, B., and Schr \
Mickel, W., M \"u nster, S., Jawerth, L. M., Vader, D. A., Weitz, D. A., Sheppard, A. P., Mecke, K., Fabry, B., and Schr \"o der-Turk, G. E. (2008). Robust pore size analysis of filamentous networks from three-dimensional confocal microscopy. Biophysical Journal , 95(12):6072--6080
2008
-
[44]
T., Salmon, E
O'Brien, E. T., Salmon, E. D., Walker, R. A., and Erickson, H. P. (1990). Effects of magnesium on the dynamic instability of individual microtubules. Biochemistry , 29(28):6648--6656
1990
-
[45]
and Florin, E.-L
Pampaloni, F. and Florin, E.-L. (2008). Microtubule architecture: inspiration for novel carbon nanotube-based biomimetic materials. Trends in Biotechnology , 26(6):302--310
2008
-
[46]
Paschotta, R. (2008). Field Guide to Lasers . Field Guides. SPIE Press
2008
-
[47]
B., Burton, P
Pierson, G. B., Burton, P. R., and Himes, R. H. (1978). Alterations in number of protofilaments in microtubules assembled in vitro. The Journal of Cell Biology , 76:223 -- 228
1978
-
[48]
Piez, K. A. and Miller, A. (1974). The structure of collagen fibrils. Journal of supramolecular structure , 2(2-4):121--137
1974
-
[49]
Pralle, A., Prummer, M., Florin, E.-L., Stelzer, E., and Hörber, J. (1999). Three-dimensional high-resolution particle tracking for optical tweezers by forward scattered light. Microscopy Research and Technique , 44(5):378--386
1999
-
[50]
Ramaiya, A., Roy, B., Bugiel, M., and Schäffer, E. (2017). Kinesin rotates unidirectionally and generates torque while walking on microtubules. Proceedings of the National Academy of Sciences , 114(41):10894--10899
2017
-
[51]
K., Jensen, O
Revell, C. K., Jensen, O. E., Shearer, T., Lu, Y., Holmes, D. F., and Kadler, K. E. (2021). Collagen fibril assembly: New approaches to unanswered questions. Matrix Biol Plus , 12:100079
2021
-
[52]
Robertson-Anderson, R. M. (2018). Optical tweezers microrheology: From the basics to advanced techniques and applications. ACS Macro Letters , 7(8):968--975
2018
-
[53]
Rohrbach, A., Florin, E.-L., and Stelzer, E. H. (2001). Photonic Force Microscopy: simulation of principles and applications . In Andersson-Engels, S. and Kaschke, M. F., editors, Photon Migration, Optical Coherence Tomography, and Microscopy , volume 4431, pages 75 -- 86. Int...
2001
-
[54]
and Stelzer, Florin, E.-L
Rohrbach, A. and Stelzer, Florin, E.-L. (2002). Three-dimensional position detection of optically trapped dielectric particles. Journal of Applied Physics , 91:5474 -- 5488
2002
-
[55]
L., Terzi, A., Sannino, A., and Madaghiele, M
Salvatore, L., Gallo, N., Natali, M. L., Terzi, A., Sannino, A., and Madaghiele, M. (2021). Mimicking the hierarchical organization of natural collagen: Toward the development of ideal scaffolding material for tissue regeneration. Front Bioeng Biotechnol , 9:644595
2021
-
[56]
Stylianou, A. (2022). Assessing collagen D-Band periodicity with atomic force microscopy. Materials (Basel) , 15(4)
2022
-
[57]
K., Jachowski, T
Sudhakar, S., Abdosamadi, M. K., Jachowski, T. J., Bugiel, M., Jannasch, A., and Schäffer, E. (2021). Germanium nanospheres for ultraresolution picotensiometry of kinesin motors. Science , 371(6530):eabd9944
2021
-
[58]
Sultanova, N., Kasarova, S., and Nikolov, I. (2009). Dispersion properties of optical polymers. Acta Physica Polonica A , 116(4):585--587
2009
-
[59]
F., Schnapp, B
Svoboda, K., Schmidt, C. F., Schnapp, B. J., and Block, S. M. (1993). Direct observation of kinesin stepping by optical trapping interferometry. Nature , 365(6448):721--727
1993
-
[60]
Taylor, R. W. and Sandoghdar, V. (2019). Interferometric scattering microscopy: Seeing single nanoparticles and molecules via rayleigh scattering. Nano Letters , 19(8):4827--4835. PMID: 31314539
2019
-
[61]
D., Skandalis, S
Theocharis, A. D., Skandalis, S. S., Gialeli, C., and Karamanos, N. K. (2016). Extracellular matrix structure. Advanced Drug Delivery Reviews , 97:4--27. Extracellular Matrix (ECM) and ECM-like materials: Therapeutic Tools and Targets in Cancer Treatment
2016
-
[62]
Tischer, C., Altmann, S., Fisinger, S., Hörber, J. K. H., Stelzer, E. H. K., and Florin, E.-L. (2001). Three-dimensional thermal noise imaging . Applied Physics Letters , 79(23):3878--3880
2001
-
[63]
Tischer, C., Pralle, A., and Florin, E.-L. (2004). Determination and correction of position detection nonlinearity in single particle tracking and three-dimensional scanning probe microscopy. Microscopy and Microanalysis , 10(4):425--434
2004
-
[64]
Vogel, M. (2012). Principles of lasers, 5th edn., by o. svelto. Contemporary Physics - CONTEMP PHYS , 53:1--1
2012
-
[65]
Waterman, P. (1965). Matrix formulation of electromagnetic scattering. Proceedings of the IEEE , 53(8):805--812
1965
-
[66]
Welte, M. A. (2004). Bidirectional transport along microtubules. Current Biology , 14(13):R525--R537
2004
-
[67]
G., Collier, M
Young, G., Hundt, N., Cole, D., Fineberg, A., Andrecka, J., Tyler, A., Olerinyova, A., Ansari, A., Marklund, E. G., Collier, M. P., Chandler, S. A., Tkachenko, O., Allen, J., Crispin, M., Billington, N., Takagi, Y., Sellers, J. R., Eichmann, C., Selenko, P., Frey, L., Riek, R....
2018
-
[68]
and Kukura, P
Young, G. and Kukura, P. (2019). Interferometric scattering microscopy. Annual Review of Physical Chemistry , 70(Volume 70, 2019):301--322
2019
-
[69]
S., Lee, N
Zhao, T., Weinhold, P. S., Lee, N. Y., and Dahners, L. E. (2011). Some observations on the subfibrillar structure of collagen fibrils as noted during treatment with nkisk and cathepsin g with mechanical agitation. Journal of Electron Microscopy , 60(2):177--182
2011
Reviewed August 7, 2026 · model on record in the stance chip above.
Discussion (0). Sign in to comment.