REVIEW 4 major objections 5 minor 54 references
Meter-scale Observations of Equatorial Plasma Turbulence
T0 review · 4 major / 5 minor · reviewed 2026-08-07 · deepseek-v4-flash
Pith's one-line read The paper claims the ISS multi-needle Langmuir probe resolves equatorial plasma turbulence down to 2-5 meters, where a subset of spectra show a meter-scale power bump—evidence of instability-driven turbulence on the edges of equatorial…
desk verdict Solid new dataset with a credible 400 m breakpoint result; the meter-scale bump claim is interesting but needs better statistics. read the letter →
The pith
A machine-rendered reading of the paper's core claim, the machinery that carries it, and where it could break.
The reading
What carries the argument
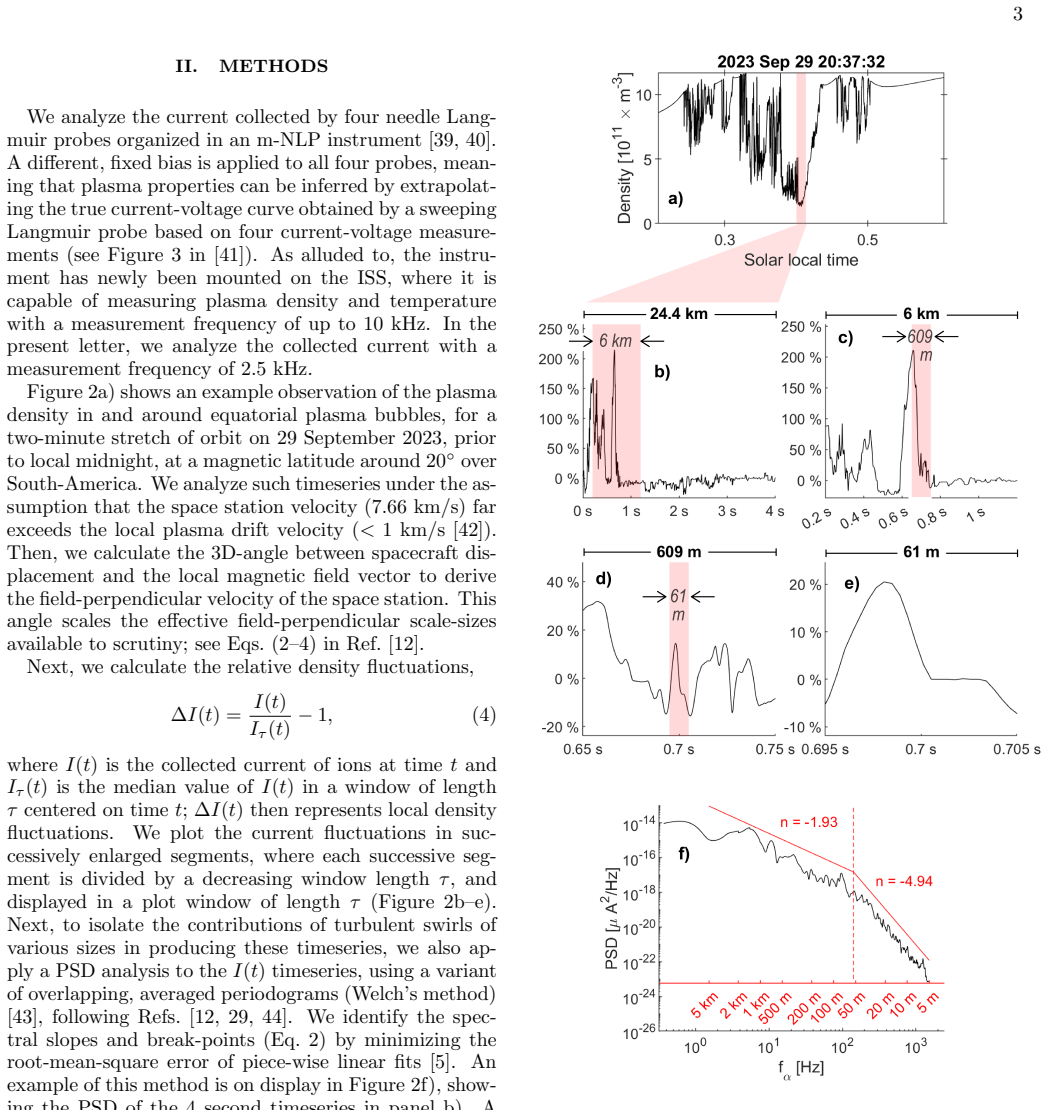
The central instrument is the multi-needle Langmuir probe (m-NLP), four fixed-bias cylindrical copper needles that sample electron current at up to 10 kHz; this paper uses 2.5 kHz data. Density fluctuation spectra are computed from the current timeseries via overlapping, averaged periodograms, and spectral slopes and breakpoints are found by minimizing the root-mean-square error of piecewise linear fits. Time is converted to spatial scale by assuming the ISS velocity (7.66 km/s) dominates plasma drift and by scaling with the angle between spacecraft displacement and the local magnetic field. The key identifying feature is a localized 'bump' of elevated power in the power spectral density at a narrow band of wavenumbers, here around 5 m, interpreted as an energy injection or instability trigger rather than a cascade.
What would settle it
Take a density timeseries recorded during a bubble crossing and recompute its power spectrum after transforming time to space using a range of assumed effective velocities bracketing the true plasma drift; if the 5 m bump remains pinned at the same spatial scale across that range, the frozen-in conversion is robust, whereas if it moves or smears out, the bump is a Doppler artifact. A second decisive test would be simultaneous radar or another spacecraft measurement of 3-10 m irregularities along the same field line while the ISS passes a bubble edge.
Extended reading notes
Core claim
On the paper's own terms, the central discovery is that meter-scale structure in equatorial plasma bubbles is real, observable, and organized: the ISS m-NLP resolves density fluctuations that conserve detail down to 2-5 meters, and a subset of spectra exhibit a bump in irregularity power at about 5 meters that cannot be explained by a turbulent cascade alone. The authors state that these observations are the first of instability-driven meter-scale turbulence on the edges of equatorial plasma bubbles. More broadly, the distribution of spectral breakpoints, with a prominent peak near 400 m and a small secondary population near 18 m, indicates that the gradient-drift instability routinely injects kilometer-scale swirls that cascade and then dissipate, with the meter-scale bumps appearing as a distinct, largely post-midnight phenomenon.
Load-bearing premise
The load-bearing premise is that the ISS's speed (7.66 km/s) so dominates the plasma drift (under 1 km/s) that time can be read as space; if that frozen-in approximation fails, every quoted scale size, including the 5 m bump, shifts or disappears.
Editorial extensions
If this is right
- The ISS m-NLP dataset can resolve equatorial plasma density structure down to its 2-5 m Nyquist scale, a regime rarely sampled in situ.
- The clear breakpoint distribution near 400 m supports the gradient-drift instability as the routine source of kilometer-scale structuring on bubble walls.
- The roughly 3% of spectra with meter-scale bumps indicate a distinct, intermittent, predominantly post-midnight population of small-scale energy injections.
- The high-quality spectra are directly relevant to Fresnel-scale irregularities that cause GPS amplitude scintillations.
- Conjunction studies with ground-based GPS receivers can tie specific small-scale spectral features to observed scintillation events.
Reading between the lines
- Inference: If the 5 m bump survives a stricter frozen-in-flow test, it implies a genuine secondary instability at meter scales on bubble edges, not merely the tail of a cascade.
- Inference: The same dataset could be used to search for conjugate signatures in total electron content or radar backscatter, testing whether the meter-scale bumps are field-aligned structures.
- Inference: The post-midnight clustering of small-scale breakpoints suggests a local-time dependence in the instability environment, possibly related to vertical drift reversals, that a longer climatology could map.
- Inference: Comparing the m-NLP spectra with scintillation observations would test whether the observed meter-scale bumps correspond to the Fresnel-scale structures thought to drive amplitude scintillations.
Editorial analysis
A structured set of objections, weighed in public.
Referee Report
Summary. The paper presents initial results from a multi-Needle Langmuir Probe (m-NLP) mounted on the International Space Station, measuring electron/ion current at 2.5 kHz during traversals of equatorial plasma bubbles. The authors show case-study density time series with fractal, self-similar structuring, power spectral densities with breakpoints, and a statistical analysis of about 20,000 spectra acquired over six days. They report a prominent breakpoint near 400 m, consistent with prior gradient-drift instability studies, and a ~3% subset of spectra with breakpoints below 40 m, including a localized 'bump' near 5 m that they interpret as instability-driven meter-scale turbulence. The paper concludes that these are unprecedented observations of meter-scale energy injection on the edges of equatorial plasma bubbles.
Significance. If the meter-scale bump is real, the ISS m-NLP dataset would indeed be a rare, high-resolution in-situ resource for studying equatorial plasma turbulence at scales relevant to GPS scintillation and for testing models of small-scale irregularity generation. The case studies and the well-defined 400 m breakpoint distribution are useful and consistent with the existing literature, and the paper explicitly treats the six-day survey as non-climatological, which is appropriate. However, the central novel claim of 'unprecedented observations of instability-driven meter-scale turbulence' currently rests on a small, threshold-selected subset with no null-hypothesis testing, no error bars on the key power spectrum, and no quantitative exclusion of instrumental or spacecraft-potential contamination. The finding is intriguing but not yet established; the paper's value would be substantially increased by adding the missing statistical and instrumental checks.
major comments (4)
- [Section III, Figure 5d and Section IV] The central claim of meter-scale instability-driven turbulence rests on a ~3% subset of ~20,000 spectra selected by requiring a breakpoint below 40 m. No null-hypothesis test, false-discovery control, or Monte Carlo surrogate analysis is provided to show that a bump of this amplitude and width near 5 m cannot arise by chance when fitting a piecewise power-law model to red-noise spectra. With 20,000 independent trials, even a small per-spectrum false-positive rate would produce hundreds of spurious small-scale breakpoints. Please report the number of detected bumps, compare their occurrence against a noise-only null model, and state the resulting false-discovery rate.
- [Section II, Methods] The conversion from temporal frequency to spatial scale relies entirely on the assumption that the ISS velocity (7.66 km/s) far exceeds the local plasma drift (<1 km/s) and on the computed angle between the spacecraft displacement and the local magnetic field. This is a Taylor-hypothesis assumption, and its failure would change all quoted scale sizes, including the 5 m bumps. The paper does not report drift velocity estimates, angle uncertainties, or a sensitivity analysis. Please quantify the uncertainty in the field-perpendicular velocity and show that the assumed mapping is valid for the events presented.
- [Section III, Figure 5b and Figure 5d] Because the m-NLP infers density from collected current under fixed bias, spacecraft potential variations can contaminate the current signal. Figure 5b shows spacecraft potential, but the paper does not quantify the coherence or correlation between the potential and the current fluctuations in the frequency band of the 5 m bump. Please provide a spectral coherence analysis, or otherwise show that potential-driven artifacts cannot produce the observed bump.
- [Section III, Figure 5d] The power spectral density in Figure 5d is shown without error bars or confidence intervals, and the fitted breakpoints and spectral indices are reported without uncertainties. This makes it impossible to distinguish the 'bump' from a noise excursion, especially near the Nyquist limit. Please add confidence intervals to the PSD and report fit uncertainties, together with a model comparison (e.g., single power law versus power law plus bump) to demonstrate that the bump is statistically significant.
minor comments (5)
- [Abstract and Section II] The abstract states a Nyquist scale of 2-5 m, but Section II states a sampling frequency of 2.5 kHz without deriving the corresponding spatial Nyquist scale; please clarify the conversion and the role of the field-perpendicular velocity.
- [Equation 4] Equation (4) is introduced as the 'collected current of ions', while the Introduction and instrument description refer to electron current collected by the Langmuir probes; please make the terminology consistent.
- [Section III, Figure 4 caption] The caption of Figure 4 states 'Histograms of steepening density spectra' but does not define 'steepening' in the caption; please define it (e.g., spectral index difference greater than 0.9 in the concave direction, as stated in the text) for the reader's convenience.
- [Section V, Conclusion] The phrase 'exhibit a tantatively characteristic tendency' contains a typo ('tantatively' should be 'tentatively'); please correct it.
- [Throughout] The spelling of 'break-point' versus 'breakpoint' is inconsistent; please choose one form and apply it uniformly.
Circularity Check
No circularity: the meter-scale bump and 400 m breakpoint are fitted observational outputs, and the authors' self-citations are methodological definitions rather than load-bearing derivations.
full rationale
No circular step is present. The paper is an observational analysis: spectral slopes and breakpoints are estimated from measured m-NLP currents by least-squares piecewise-linear fits (Sec. II: 'We identify the spectral slopes and break-points (Eq. 2) by minimizing the root-mean-square error of piece-wise linear fits [5]'), and the reported 400 m peak and ~5 m bump are features of the fitted distribution (Fig. 4b, Fig. 5d), not quantities derived from the fitting assumptions. The frequency-to-scale conversion invokes the Taylor hypothesis (Sec. II: 'the space station velocity (7.66 km/s) far exceeds the local plasma drift velocity (< 1 km/s)'), and the m-NLP density inference is an instrument calibration; neither is an output of the paper's derivation. The self-citations to Refs. [12] and [45] supply operational selection criteria ('we have collected some 20,000 spectra that we deem as stemming from equatorial plasma turbulence, following the criteria in Ref. [12]'; 'following Ref. [45] in defining "spectral steepening" as having a difference in spectral indices greater than 0.9 in the concave direction'), but these are published methodological definitions, not unverified theorems whose conclusions include the meter-scale bump. The bump is visually identified in the selected subset rather than entailed by the criteria. The 400 m breakpoint is checked against an external literature summary (Table I), providing independent grounding. The paper itself flags limitations in Secs. IV and V: the subset is small and 'difficult to interpret,' 'we cannot rule out the possibility of kinetic instabilities,' and the results are 'not to be considered general-statistical or climatological.' These are statistical and interpretive caveats, not circularity. No equation is equivalent to its input by construction, and no claim reduces to a self-citation chain.
Assumptions & free parameters
free parameters (5)
- Spectral index n1 =
variable, typically near -5/3
- Spectral index n2 =
variable, steeper than n1
- Breakpoint scale k0 =
variable, peaks at ~400 m and ~18 m
- Steepening threshold =
0.9
- Median filter window tau =
not specified numerically
assumptions (4)
- domain assumption Taylor hypothesis: spacecraft velocity is much greater than plasma drift, so temporal frequencies map directly to spatial scales.
- domain assumption The collected current is proportional to plasma density at the sampling rate.
- ad hoc to paper The power spectrum is well described by a piecewise power law with a single breakpoint (Eq. 2).
- ad hoc to paper The criteria for identifying equatorial plasma turbulence spectra follow Ref [12].
Cite this review
Pith. "Pith review of Meter-scale Observations of Equatorial Plasma Turbulence." pith.science (2026). https://pith.science/paper/BG2LDDCL
@misc{pith2026250608665,
  author       = {Pith},
  title        = {Pith review of: Meter-scale Observations of Equatorial Plasma Turbulence},
  year         = {2026},
  howpublished = {\url{https://pith.science/paper/BG2LDDCL}},
  note         = {Machine review of arXiv:2506.08665}
}
read the original abstract
The multi-Needle Langmuir Probe collects an electron current through four fixed-bias cylindrical copper needles. This allows for an extremely high sampling frequency, with plasma properties being inferred through polynomial fitting in the current-voltage plane. We present initial results from such a multi-needle probe mounted on the International Space Station, orbiting Earth at an altitude of around 400 km. That altitude, and its orbital inclination (~50 degrees), place the ISS as a suitable platform for observing equatorial plasma bubbles. In case studies of such turbulent structuring of the F-region plasma, we observe density timeseries that conserve considerable detail at virtually every level of magnification down to its Nyquist scale of 2-5 meters. We present power spectral density estimates of the turbulent structuring found inside equatorial plasma bubbles, and we discuss apparent break-points at scale-sizes between 1 m and 300 m, which we interpret in the light of turbulent dissipation as kilometer-scale swirls produced by the gradient-drift instability dissipate in the plasma.
Figures


Figures from the paper (2 more)


Reference graph
Works this paper leans on
-
[1]
R. T. Tsunoda, High-latitude F region irregularities: A review and synthesis, Reviews of Geophysics 26, 719 (1988)
work page 1988
-
[2]
J. D. Huba, A. B. Hassam, I. B. Schwartz, and M. J. Ke- skinen, Ionospheric turbulence: Interchange instabilities and chaotic fluid behavior, Geophysical Research Letters 12, 65 (1985)
work page 1985
-
[3]
A. N. Kolmogorov, LOCAL STRUCTURE OF TURBU- LENCE IN AN INCOMPRESSIBLE VISCOUS FLUID AT VERY HIGH REYNOLDS NUMBERS, Soviet Physics Uspekhi 10, 734 (1968)
work page 1968
-
[4]
P. K. Chaturvedi and S. L. Ossakow, Nonlinear stabiliza- tion of the current convective instability in the diffuse aurora, Geophysical Research Letters 6, 957 (1979)
work page 1979
-
[5]
M. F. Ivarsen, J.-P. St-Maurice, Y. Jin, J. Park, L. M. Buschman, and L. B. Clausen, To what degree does the high-energy aurora destroy F-region irregularities?, Fron- tiers in Astronomy and Space Sciences 11, 10.3389/fs- pas.2024.1309136 (2024)
arXiv 2024
-
[6]
R. F. Woodman and C. L. Hoz, Radar observations of F region equatorial irregularities, Journal of Geophysical Research (1896-1977) 81, 5447 (1976)
work page 1976
-
[7]
R. A. Heelis, Electrodynamics in the low and middle latitude ionosphere: A tutorial, Journal of Atmospheric and Solar-Terrestrial Physics Upper Atmosphere Tutori- als from the 2001 Joint CEDAR SCOSTEP Meeting, 66, 825 (2004)
work page 2004
-
[8]
H. Kil, The Morphology of Equatorial Plasma Bubbles - a review, Journal of Astronomy and Space Sciences 32, 13 (2015)
work page 2015
Show all 54 references
-
[9]
Kil and R
H. Kil and R. A. Heelis, Equatorial density irregularity structures at intermediate scales and their temporal evo- lution, Journal of Geophysical Research: Space Physics 103, 3969 (1998)
1998
-
[10]
D. L. Hysell and E. Kudeki, Collisional shear in- stability in the equatorial F region ionosphere, Jour- nal of Geophysical Research: Space Physics 109, 10.1029/2004JA010636 (2004)
2004 doi
-
[11]
Tulasi Ram, K
S. Tulasi Ram, K. K. Ajith, T. Yokoyama, M. Yamamoto, K. Hozumi, K. Shiokawa, Y. Otsuka, and G. Li, Dilatory and Downward Development of 3-m Scale Irregularities in the Funnel-Like Region of a Rapidly Rising Equato- rial Plasma Bubble, Geophysical Research Letters 47, e2020GL0...
2020
-
[12]
M. F. Ivarsen, J.-P. St-Maurice, J. Park, J. Klenzing, Y. Jin, and W. Lee, Plasma Structure Decay Rates in the Equatorial Ionosphere Are Strongly Coupled by Turbu- lence, Geophysical Research Letters 51, e2024GL109441 (2024)
2024
-
[13]
M. C. Kelley, Chapter 4 - Equatorial Plasma Instabili- ties, in The Earth’s Ionosphere, edited by M. C. Kelley (Academic Press, 1989) pp. 113–185
1989
-
[14]
P. L. Dyson, J. P. McClure, and W. B. Hanson, In situ measurements of the spectral characteristics of F region ionospheric irregularities, Journal of Geophysical Research 79, 1497 (1974)
1974
-
[15]
500 m ∼300 km 1979 Near 24 LT
1979
-
[16]
M. C. Kelley and J. P. McClure, Equatorial spread-F: A review of recent experimental results, Journal of Atmo- spheric and Terrestrial Physics Equatorial Aeronomy - I, 43, 427 (1981)
1981
-
[17]
M. C. Kelley, R. Pfaff, K. D. Baker, J. C. Ulwick, R. Liv- ingston, C. Rino, and R. Tsunoda, Simultaneous rocket probe and radar measurements of equatorial spread F— Transitional and short wavelength results, Journal of Geophysical Research: Space Physics 87, 1575 (1982)
1982
-
[18]
S. Basu, S. Basu, J. P. McClure, W. B. Hanson, and H. E. Whitney, High resolution topside in situ data of electron densities and VHF/GHz scintillations in the equatorial region, Journal of Geophysical Research: Space Physics 88, 403 (1983)
1983
-
[19]
Kolmogorov -5/3
60 m - 260 m ∼400 km 1983 21:40 LT [21, 22] <100 m 600 km 1999 - 2000 20 LT -22 LT [23, 24] 100 m - 10 km <800 km 2011 - 2014 Pre-24 LT TABLE I. A summary of spectral breaks found in five studies of equatorial plasma bubbles. when the PSD is more accurately described by a com-...
1983
-
[20]
80 m - 100 m ∼500 km 1990 21 LT
1990
-
[21]
C. L. Rino, R. T. Tsunoda, J. Petriceks, R. C. Liv- ingston, M. C. Kelley, and K. D. Baker, Simultaneous rocket-borne beacon and in situ measurements of equato- rial spread F—Intermediate wavelength results, Journal of Geophysical Research: Space Physics 86, 2411 (1981)
1981
-
[22]
Le, C.-S
G. Le, C.-S. Huang, R. F. Pfaff, S.-Y. Su, H.-C. Yeh, R. A. Heelis, F. J. Rich, and M. Hairston, Plasma density enhancements associated with equa- torial spread F: ROCSAT-1 and DMSP observations, Journal of Geophysical Research: Space Physics 108, 10.1029/2002JA009592 (2003)
2003 doi
-
[23]
LaBelle, M
J. LaBelle, M. C. Kelley, and C. E. Seyler, An analysis of the role of drift waves in equatorial spread F, Journal of Geophysical Research: Space Physics 91, 5513 (1986)
1986
-
[24]
D. L. Hysell, C. E. Seyler, and M. C. Kelley, Steepened structures in equatorial spread F: 2. Theory, Journal of Geophysical Research: Space Physics 99, 8841 (1994)
1994
-
[25]
S.-Y. Su, H. C. Yeh, and R. A. Heelis, ROCSAT 1 iono- spheric plasma and electrodynamics instrument observa- tions of equatorial spread F: An early transitional scale result, Journal of Geophysical Research: Space Physics 106, 29153 (2001)
2001
-
[26]
LaBelle and M
J. LaBelle and M. C. Kelley, The generation of kilome- ter scale irregularities in equatorial spread F, Journal of Geophysical Research: Space Physics 91, 5504 (1986)
1986
-
[27]
C. L. Rino, C. S. Carrano, and P. Roddy, Wavelet-based analysis and power law classification of C/NOFS high- resolution electron density data, Radio Science 49, 680 (2014)
2014
-
[28]
C. L. Rino, C. S. Carrano, K. M. Groves, and P. A. Roddy, A characterization of intermediate-scale spread F structure from four years of high-resolution C/NOFS satellite data, Radio Science 51, 779 (2016)
2016
-
[29]
S. T. Zalesak, S. L. Ossakow, and P. K. Chaturvedi, Non- linear equatorial spread F: The effect of neutral winds and background Pedersen conductivity, Journal of Geo- physical Research: Space Physics 87, 151 (1982). 7
1982
-
[30]
M., Ledvina B
Kintner P. M., Ledvina B. M., and de Paula E. R., GPS and ionospheric scintillations, Space Weather 5, 10.1029/2006SW000260 (2007)
2007 doi
-
[31]
Kivanc and R. A. Heelis, Spatial distribution of iono- spheric plasma and field structures in the high-latitude F region, Journal of Geophysical Research 103, 6955 (1998)
1998
-
[32]
M. J. Keskinen and J. D. Huba, Nonlinear evolution of high-latitude ionospheric interchange instabilities with scale-size-dependent magnetospheric coupling, Journal of Geophysical Research: Space Physics 95, 15157 (1990)
1990
-
[33]
M. F. Ivarsen, Y. Jin, A. Spicher, and L. B. N. Clausen, Direct Evidence for the Dissipation of Small-Scale Iono- spheric Plasma Structures by a Conductive E Region, Journal of Geophysical Research: Space Physics 124, 2935 (2019)
2019
-
[34]
K. C. Yeh and C.-H. Liu, Radio wave scintillations in the ionosphere, IEEE Proceedings 70, 324 (1982)
1982
-
[35]
Meziane, A
K. Meziane, A. M. Hamza, and P. T. Jayachandran, Tur- bulence Signatures in High-Latitude Ionospheric Scintil- lation, Journal of Geophysical Research: Space Physics 128, e2022JA030934 (2023)
2023
-
[36]
Basu and S
S. Basu and S. Basu, Equatorial scintillations: Ad- vances since ISEA-6, Journal of atmospheric and terres- trial physics 47, 753 (1985)
1985
-
[37]
R. T. Tsunoda, Control of the seasonal and longitudinal occurrence of equatorial scintillations by the longitudinal gradient in integrated E region Pedersen conductivity, Journal of Geophysical Research: Space Physics 90, 447 (1985)
1985
-
[38]
Pfaff, P
R. Pfaff, P. Uribe, R. Fourre, J. Kujawski, N. May- nard, M. Acu˜ na, D. Rowland, H. Freudenreich, K. Bro- mund, S. Martin, C. Liebrecht, R. Kramer, F. Hun- saker, R. Holzworth, M. McCarthy, W. Farrell, J. Klen- zing, G. Le, A. Jacobson, J. Houser, C. Steigies, and J.-J. Berth...
2021
-
[39]
J. Moen, K. Oksavik, L. Alfonsi, Y. Daabakk, V. Ro- mano, and L. Spogli, Space weather challenges of the po- lar cap ionosphere, Journal of Space Weather and Space Climate 3, A02 (2013)
2013
-
[40]
St-Maurice and A
J.-P. St-Maurice and A. M. Hamza, Small scale irreg- ularities at high latitudes, in Characterising the Iono- sphere, Ed. G. Wyman; Technical Report RTO-TR-IST- 051, Chapter 1, p. 70. (Neuilly-sur-Seine, France: RTO, 2009)
2009
-
[41]
St-Maurice and L
J.-P. St-Maurice and L. Goodwin, Revisiting the Behav- ior of the E-Region Electron Temperature During Strong Electric Field Events at High Latitudes, Journal of Geo- physical Research: Space Physics 126, 2020JA028288 (2021)
2021
-
[42]
R. F. Woodman, East-west ionospheric drifts at the mag- netic equator., undefined (1972)
1972
-
[43]
Hoang, L
H. Hoang, L. B. N. Clausen, K. Røed, T. A. Bekkeng, E. Trondsen, B. Lybekk, H. Strøm, D. M. Bang-Hauge, A. Pedersen, A. Spicher, and J. I. Moen, The Multi- Needle Langmuir Probe System on Board NorSat-1, Space Science Reviews 214, 75 (2018)
2018
-
[44]
G. Liu, S. Marholm, A. J. Eklund, L. Clausen, and R. Marchand, M-NLP Inference Models Using Simula- tion and Regression Techniques, Journal of Geophysical Research: Space Physics 128, e2022JA030835 (2023)
2023
-
[45]
M. F. Ivarsen, H. Hoang, L. Yang, L. B. N. Clausen, A. Spicher, Y. Jin, E. Trondsen, J. I. Moen, K. Røed, and B. Lybekk, Multineedle Langmuir Probe Operation and Acute Probe Current Susceptibility to Spacecraft Po- tential, IEEE Transactions on Plasma Science 47, 3816 (2019)
2019
-
[46]
Oppenheim, Evidence and effects of a wave-driven nonlinear current in the equatorial electrojet, Annales Geophysicae 15, 899 (1997)
M. Oppenheim, Evidence and effects of a wave-driven nonlinear current in the equatorial electrojet, Annales Geophysicae 15, 899 (1997)
1997
-
[47]
Tr¨ obs and G
M. Tr¨ obs and G. Heinzel, Improved spectrum estimation from digitized time series on a logarithmic frequency axis, Measurement 39, 120 (2006)
2006
-
[48]
M. F. Ivarsen, Y. Jin, A. Spicher, W. Miloch, and L. B. N. Clausen, The Lifetimes of Plasma Structures at High Lat- itudes, Journal of Geophysical Research: Space Physics 126, e2020JA028117 (2021)
2021
-
[49]
M. F. Ivarsen, J.-P. St-Maurice, Y. Jin, J. Park, W. Miloch, A. Spicher, Y.-S. Kwak, and L. B. N. Clausen, Steepening Plasma Density Spectra in the Iono- sphere: The Crucial Role Played by a Strong E-Region, Journal of Geophysical Research: Space Physics 126, e2021JA029401 (2021)
2021
-
[50]
K. Song, K. Meziane, A. M. Hamza, and P. T. Jayachan- dran, Investigating of the Fresnel scale from ionospheric scintillation spectra (in press), Journal of Geophysical Research: Space Physics (2025)
2025
-
[51]
Yokoyama, A review on the numerical simulation of equatorial plasma bubbles toward scintillation evaluation and forecasting, Progress in Earth and Planetary Science 4, 37 (2017)
T. Yokoyama, A review on the numerical simulation of equatorial plasma bubbles toward scintillation evaluation and forecasting, Progress in Earth and Planetary Science 4, 37 (2017)
2017
-
[52]
Xiong, J.-S
C. Xiong, J.-S. Xu, C. Stolle, J. van den Ijssel, F. Yin, G. N. Kervalishvili, and F. Zangerl, On the Occur- rence of GPS Signal Amplitude Degradation for Re- ceivers on Board LEO Satellites, Space Weather 18, e2019SW002398 (2020)
2020
-
[53]
A. M. Hamza, K. Song, K. Meziane, and J. P. Thayyil, Two-Component Phase Scintillation Spectra in the Auro- ral Region: Observations and Model, Preprint (Preprints, 2023)
2023
-
[2023]
6 ACKNOWLEDGEMENTS This work was supported in part by the European Space Agency’s Living Planet grant no 1000012348
In future, conjunction studies between the ISS and ground-based GPS receivers will allow for systematic in- vestigations into how the various small-scale spectral fea- tures compare to radio scintillations. 6 ACKNOWLEDGEMENTS This work was supported in part by the European Spa...
2016
Reviewed August 7, 2026 · model on record in the stance chip above.
Discussion (0). Sign in to comment.