REVIEW 3 major objections 6 minor 33 references
IMAGIC-500: IMputation benchmark on A Generative Imaginary Country (500k samples)
T0 review · 3 major / 6 minor · reviewed 2026-08-07 · deepseek-v4-flash
Pith's one-line read A public 500k-row synthetic benchmark tests 14 imputation methods under controlled missingness.
desk verdict Useful large-scale imputation benchmark, but the missingness mechanism generation is unspecified and the runtime table has an obvious error, so the headline comparisons need verification. read the letter →
The pith
A machine-rendered reading of the paper's core claim, the machinery that carries it, and where it could break.
The reading
What carries the argument
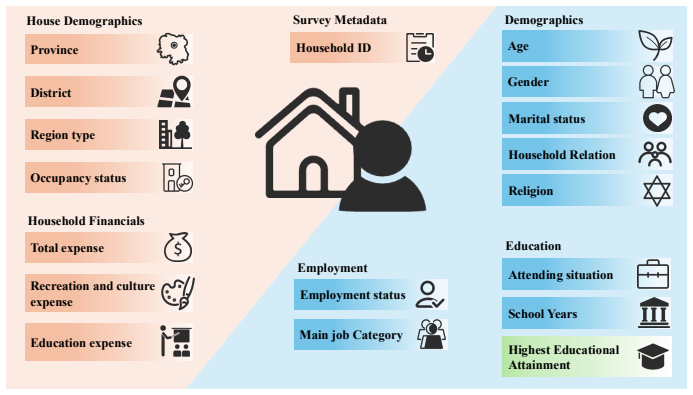
The central object is the IMAGIC-500 dataset itself: a 500k-row subset of the World Bank's synthetic census, reorganized to preserve the nested individual-to-household and district-to-province structure. The benchmark protocol carries the argument by imposing controlled masks under MCAR, MAR, and MNAR at 10% to 50% missingness, then scoring methods on RMSE for continuous variables, F1 for categorical variables, runtime, and downstream ROC-AUC degradation on a random-forest classifier.
What would settle it
Install the released benchmark code and inspect the mask-generation routine: for each MAR-masked feature, check whether, within strata of the observed variable that supposedly drives missingness, the probability of being missing is constant; if it varies, the masks are not actually MAR. For MNAR, check whether the missingness probability depends on the true value of the missing variable itself. Any such failure would invalidate the mechanism-specific conclusions.
Extended reading notes
Core claim
The paper claims that IMAGIC-500 is a first-of-its-kind large-scale synthetic benchmark for missing data imputation in structured socioeconomic surveys, with 500k individuals nested in roughly 100k households and about 19 mixed-type features. Across the controlled missingness scenarios, the benchmark reveals that MissForest is the strongest and most stable method at low missingness rates, deep learning models such as ReMasker and DiffPuter become competitive or superior as missingness rises, and MNAR causes the largest degradation in downstream ROC-AUC. The paper also finds that the self-attention module in DSAN provides little benefit over its no-attention variant DSN, suggesting a higher overfitting risk.
Load-bearing premise
The benchmark's mechanism comparison assumes that the MAR and MNAR masks were constructed so that missingness truly depends on the intended observed or unobserved values, but the paper never describes the mask-generation procedure.
Editorial extensions
If this is right
- Researchers gain a public, large-scale dataset with realistic hierarchical structure for testing imputation algorithms without privacy restrictions.
- Method comparisons on this benchmark suggest that simple iterative methods like MissForest remain strong baselines, especially when missingness is low.
- Deep generative models show their value mainly at high missingness rates, where they can outdo traditional methods on both continuous and categorical imputation.
- The correlation between raw imputation metrics and downstream ROC-AUC degradation supports evaluating imputation quality by its effect on real prediction tasks.
- The benchmark's finding that MNAR is hardest, across almost all methods, underscores the need for methods that explicitly model non-ignorable missingness.
Reading between the lines
- Because the paper never describes how the MAR and MNAR masks were generated, the rank ordering across mechanisms should be treated as provisional until the mask-generation code is inspected or the mechanisms are independently re-created.
- The dataset could be extended to block-structured or monotone missingness patterns, which are common in real surveys, to broaden the conclusions beyond the three classical mechanisms.
- The minimal performance gap between DSAN and DSN suggests that simpler architectures may suffice for tabular imputation, but this is a single-dataset observation and needs replication on other benchmarks.
- A natural stress test is to evaluate whether the relative method ranking persists when the downstream task changes from classification of educational attainment to regression or multi-label prediction.
Editorial analysis
A structured set of objections, weighed in public.
Referee Report
Summary. The paper introduces IMAGIC-500, a 500k-row synthetic socioeconomic benchmark dataset derived from the World Bank's Synthetic Data for an Imaginary Country (SDIC). The dataset is constructed by joining household and individual tables, sampling 500k individuals, and selecting 19 mixed-type features with an explicit hierarchical structure (individual-household-district-province). The authors evaluate 14 imputation methods across three missingness mechanisms (MCAR, MAR, MNAR) and five missingness ratios (10%–50%), reporting RMSE for continuous features, F1 score for categorical features, runtime, and downstream ROC-AUC degradation for a classification task. The central claims are that IMAGIC-500 fills a gap in public large-scale imputation benchmarks and that the evaluation reveals meaningful differences across mechanisms and methods, with MNAR being the hardest mechanism and MissForest being strong at low missingness while deep methods dominate at high missingness.
Significance. If the benchmark is methodologically sound and reproducible, it would be a valuable public resource for the imputation community: it provides a large-scale, hierarchically structured, mixed-type dataset with controlled missingness across three mechanisms and five ratios, a broad comparison of 14 methods, and both imputation-accuracy and downstream-task evaluations. The construction from SDIC is transparent, and the release of code and data is a clear strength. However, the central methodological gap—the unspecified MAR/MNAR mask-generation procedure—directly affects the validity of the mechanism comparisons and the headline finding that MNAR is hardest. The paper's value therefore depends on whether the authors can supply the missing procedural details; the current text does not support the claimed conclusions on its own.
major comments (3)
- [Appendix B.4] The mask-generation algorithm for MAR and MNAR is never specified. Section 4.2 only states that missing values are generated under 'controlled missing patterns', and Appendix B.3 recites the textbook definitions of MCAR, MAR, and MNAR, including Eq. (1). The paper does not describe how the MAR condition is implemented (which observed features drive missingness, what propensity model or link function is used, how the conditioning is calibrated to achieve the target missing ratio) nor how the MNAR condition is implemented (which unobserved values drive missingness, and how the dependence is modeled). No random seeds are given for the five samples. Because the mechanism comparisons in Figures 2–4 and Tables 4–17, as well as the conclusion that MNAR is hardest, all rely on the masks actually satisfying the definitions in Eq. (1), this is a load-bearing reproducibility gap. The manuscript should specify the full generation procedure, or state clearly that the code repository is the definitive specification and provide a stable reference to it.
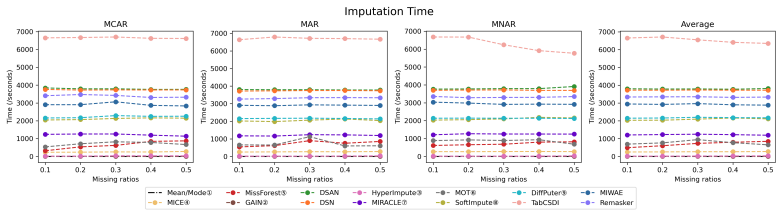
- [Section 5.1, Table 18] The runtime table lists exactly identical values for GAIN and TabCSDI across all conditions (7.9 seconds at 10% MCAR and 7.5 seconds for every subsequent entry for both methods). Two different implementations—a GAN-based method and a diffusion-based method, from different repositories—cannot plausibly produce identical runtimes to one decimal place across all missingness mechanisms and ratios. This suggests a data-recording or reporting error. Since computational efficiency is one of the paper's stated evaluation dimensions, the authors must verify the timing procedure and correct Table 18, and revisit the statement in Section 5.1 that deep learning methods are approximately an order of magnitude slower than statistical and traditional methods, which is already difficult to reconcile with the reported 7–8 second runtimes for GAIN and TabCSDI.
- [Appendix B.4] The actual hyperparameters used for the 14 methods are not reported in the paper. Appendix B.4 says that 'the complete list of hyperparameters for all methods is available in the GitHub repository', but the manuscript itself does not state learning rates, number of epochs, batch sizes, network architectures, or convergence criteria. For a benchmark paper whose main output is a ranking of methods and an ablation of the attention layer (DSAN vs. DSN), the hyperparameter configuration is load-bearing: rankings can change with hyperparameter choices. The authors should include the full configuration in the appendix or, failing that, provide a versioned configuration file with a commit hash in the paper so that the reported results are reproducible from the manuscript alone.
minor comments (6)
- [Section 3.2] The number of households in IMAGIC-500 is stated inconsistently: the Introduction says 500k individuals among 136,476 households, while the Abstract and Section 3.2 say approximately 100k households. Please align these numbers.
- [Table 1] Table 1 reports 6 numerical and 12 categorical features for IMAGIC-500, but the text and Table 2 describe 19 features with 13 categorical variables. Please correct the table or clarify which feature is excluded.
- [Section 4.3] The F1 score aggregation is not specified (micro, macro, or weighted). Given that the paper explicitly notes class imbalance in categorical variables, the choice of aggregation substantially affects the reported F1 values and should be stated.
- [Figure 4] The paper uses 'degradation' with negative values in Table 16 and the phrase 'lower degradation' in the text, which is ambiguous. Please clarify that less negative values (smaller absolute decreases) indicate better downstream performance.
- [Appendix B.4] The heading 'Hyperparamters' is misspelled; it should read 'Hyperparameters'. Also, since the DiffPuter official repository is noted as removed, please provide a stable mirror or a specific commit in the authors' benchmark repository.
- [Table 1] The table layout for the columns 'Train', 'Test', 'Validation', 'Downstream Task', and 'Hierarchical Structure' is difficult to parse because the rows mix checkmarks, dashes, and numeric values without clear separation. Please restructure the table to make each column's meaning explicit.
Circularity Check
No significant circularity: the paper is an empirical benchmark with measurements rather than derived predictions.
full rationale
IMAGIC-500 presents no derivation chain whose output is equivalent to its input by construction. The dataset is constructed by merging and subsampling the externally generated World Bank SDIC synthetic census, and the benchmark evaluates 14 third-party imputation methods under fixed missing-data masks. The headline claims (MCAR easier than MAR/MNAR, MissForest strong at low missingness, deep methods stronger at high missingness, MNAR causing the largest downstream degradation) are empirical measurements over held-out test splits, not predictions obtained from fitted parameters that were subsequently renamed as findings. The only self-developed component, DSN, is an ablation of DSAN obtained by removing the attention layer; comparing DSN with DSAN is a standard ablation, and the paper explicitly treats any performance gap as evidence about the attention mechanism rather than as independent validation of a proposed method. The paper's self-citations to external benchmark projects (DiffPuter, ReMasker, HyperImpute, etc.) are references to publicly available implementations used as baselines, and none is load-bearing in the sense of supplying an unverified uniqueness theorem or ansatz. The one substantive weakness is that Section 4.2 and Appendix B.3 do not specify the exact MAR/MNAR mask-generation algorithm, conditioning variables, link functions, or seeds, which is a reproducibility and generalizability risk, not a circularity risk: the paper does not define the mechanisms in terms of the later conclusions. Because the central claims are measurements on a fixed public dataset and externally implemented baselines, no circular step can be exhibited, and the appropriate finding is no significant circularity.
Assumptions & free parameters
assumptions (3)
- domain assumption SDIC's synthetic population statistically mirrors real household surveys.
- domain assumption The generated masks implement the textbook MCAR/MAR/MNAR mechanisms.
- domain assumption Uniform random sampling of 500k rows preserves the diversity of the full 10M-row dataset.
Cite this review
Pith. "Pith review of IMAGIC-500: IMputation benchmark on A Generative Imaginary Country (500k samples)." pith.science (2026). https://pith.science/paper/KWSUHZ36
@misc{pith2026250608844,
  author       = {Pith},
  title        = {Pith review of: IMAGIC-500: IMputation benchmark on A Generative Imaginary Country (500k samples)},
  year         = {2026},
  howpublished = {\url{https://pith.science/paper/KWSUHZ36}},
  note         = {Machine review of arXiv:2506.08844}
}
read the original abstract
Missing data imputation in tabular datasets remains a pivotal challenge in data science and machine learning, particularly within socioeconomic research. However, real-world socioeconomic datasets are typically subject to strict data protection protocols, which often prohibit public sharing, even for synthetic derivatives. This severely limits the reproducibility and accessibility of benchmark studies in such settings. Further, there are very few publicly available synthetic datasets. Thus, there is limited availability of benchmarks for systematic evaluation of imputation methods on socioeconomic datasets, whether real or synthetic. In this study, we utilize the World Bank's publicly available synthetic dataset, Synthetic Data for an Imaginary Country, which closely mimics a real World Bank household survey while being fully public, enabling broad access for methodological research. With this as a starting point, we derived the IMAGIC-500 dataset: we select a subset of 500k individuals across approximately 100k households with 19 socioeconomic features, designed to reflect the hierarchical structure of real-world household surveys. This paper introduces a comprehensive missing data imputation benchmark on IMAGIC-500 under various missing mechanisms (MCAR, MAR, MNAR) and missingness ratios (10\%, 20\%, 30\%, 40\%, 50\%). Our evaluation considers the imputation accuracy for continuous and categorical variables, computational efficiency, and impact on downstream predictive tasks, such as estimating educational attainment at the individual level. The results highlight the strengths and weaknesses of statistical, traditional machine learning, and deep learning imputation techniques, including recent diffusion-based methods. The IMAGIC-500 dataset and benchmark aim to facilitate the development of robust imputation algorithms and foster reproducible social science research.
Figures


Figures from the paper (4 more)



Reference graph
Works this paper leans on
-
[1]
Esther-Lydia Silva-Ramírez, Rafael Pino-Mejías, and Manuel López-Coello. Single imputation with multilayer perceptron and multiple imputation combining multilayer perceptron and k-nearest neighbours for monotone patterns.Applied Soft Computing, 29:65–74, 2015
work page 2015
-
[2]
John Wiley & Sons, 2004
Donald B Rubin.Multiple imputation for nonresponse in surveys, volume 81. John Wiley & Sons, 2004
2004
-
[3]
Mingxuan Liu, Siqi Li, Han Yuan, Marcus Eng Hock Ong, Yilin Ning, Feng Xie, Seyed Ehsan Saffari, Yuqing Shang, Victor V olovici, Bibhas Chakraborty, et al. Handling missing values in healthcare data: A systematic review of deep learning-based imputation techniques.Artificial intelligence in medicine, 142: 102587, 2023. 9
work page 2023
-
[4]
Nearest neighbor imputation for survey data.Journal of official statistics, 16 (2):113, 2000
Jiahua Chen and Jun Shao. Nearest neighbor imputation for survey data.Journal of official statistics, 16 (2):113, 2000
work page 2000
-
[5]
Diffputer: Empowering diffusion models for missing data imputation
Hengrui Zhang, Liancheng Fang, Qitian Wu, and Philip S Yu. Diffputer: Empowering diffusion models for missing data imputation. InThe Thirteenth International Conference on Learning Representations, 2025
work page 2025
-
[6]
Remasker: Imputing tabular data with masked autoencoding
Tianyu Du, Luca Melis, and Ting Wang. Remasker: Imputing tabular data with masked autoencoding. In The Twelfth International Conference on Learning Representations, 2024. URL https://openreview. net/forum?id=KI9NqjLVDT
work page 2024
-
[7]
Xiaoye Miao, Yangyang Wu, Lu Chen, Yunjun Gao, and Jianwei Yin. An experimental survey of missing data imputation algorithms.IEEE Transactions on Knowledge and Data Engineering, 35(7):6630–6650,
-
[8]
Diffusion models for missing value imputation in tabular data
Shuhan Zheng and Nontawat Charoenphakdee. Diffusion models for missing value imputation in tabular data. InNeurIPS 2022 First Table Representation Workshop, 2022. URL https://openreview.net/ forum?id=4q9kFrXC2Ae
work page 2022
Show all 33 references
-
[9]
Deep learning versus conventional methods for missing data imputation: A review and comparative study.Expert Systems with Applications, 227:120201, 2023
Yige Sun, Jing Li, Yifan Xu, Tingting Zhang, and Xiaofeng Wang. Deep learning versus conventional methods for missing data imputation: A review and comparative study.Expert Systems with Applications, 227:120201, 2023
2023
-
[10]
Hyperimpute: Generalized iterative imputation with automatic model selection
Daniel Jarrett, Bogdan C Cebere, Tennison Liu, Alicia Curth, and Mihaela van der Schaar. Hyperimpute: Generalized iterative imputation with automatic model selection. InInternational Conference on Machine Learning, pages 9916–9937. PMLR, 2022
2022
-
[11]
Matrix completion and low-rank svd via fast alternating least squares.The Journal of Machine Learning Research, 16(1):3367–3402, 2015
Trevor Hastie, Rahul Mazumder, Jason D Lee, and Reza Zadeh. Matrix completion and low-rank svd via fast alternating least squares.The Journal of Machine Learning Research, 16(1):3367–3402, 2015
2015
-
[12]
Synthetic data for an imaginary country, full population, 2023, 2023
World Bank. Synthetic data for an imaginary country, full population, 2023, 2023. URL https:// microdata.worldbank.org/index.php/catalog/study/WLD_2023_SYNTH-CEN-EN_v01_M
2023
-
[13]
Gain: Missing data imputation using generative adversarial nets
Jinsung Yoon, James Jordon, and Mihaela Schaar. Gain: Missing data imputation using generative adversarial nets. InInternational conference on machine learning, pages 5689–5698. PMLR, 2018
2018
-
[14]
Deep learning with missing data.arXiv preprint arXiv:2504.15388, 2025
Tianyi Ma, Tengyao Wang, and Richard J Samworth. Deep learning with missing data.arXiv preprint arXiv:2504.15388, 2025
2025 arXiv
-
[15]
mice: Multivariate imputation by chained equations in r
Stef Van Buuren and Karin Groothuis-Oudshoorn. mice: Multivariate imputation by chained equations in r. Journal of statistical software, 45:1–67, 2011
2011
-
[16]
Missforest—non-parametric missing value imputation for mixed-type data.Bioinformatics, 28(1):112–118, 2012
Daniel J Stekhoven and Peter Bühlmann. Missforest—non-parametric missing value imputation for mixed-type data.Bioinformatics, 28(1):112–118, 2012
2012
-
[17]
Miracle: Causally-aware imputation via learning missing data mechanisms.Advances in Neural Information Processing Systems, 34:23806– 23817, 2021
Trent Kyono, Yao Zhang, Alexis Bellot, and Mihaela van der Schaar. Miracle: Causally-aware imputation via learning missing data mechanisms.Advances in Neural Information Processing Systems, 34:23806– 23817, 2021
2021
-
[18]
Missing data imputation using optimal transport
Boris Muzellec, Julie Josse, Claire Boyer, and Marco Cuturi. Missing data imputation using optimal transport. InInternational Conference on Machine Learning, pages 7130–7140. PMLR, 2020
2020
-
[19]
Transformed distribution matching for missing value imputation
He Zhao, Ke Sun, Amir Dezfouli, and Edwin V Bonilla. Transformed distribution matching for missing value imputation. InInternational Conference on Machine Learning, pages 42159–42186. PMLR, 2023
2023
-
[20]
Miwae: Deep generative modelling and imputation of incomplete data sets
Pierre-Alexandre Mattei and Jes Frellsen. Miwae: Deep generative modelling and imputation of incomplete data sets. InInternational conference on machine learning, pages 4413–4423. PMLR, 2019
2019
-
[21]
A self-attention-based imputation technique for enhancing tabular data quality.Data, 8(6):102, 2023
Do-Hoon Lee and Han-joon Kim. A self-attention-based imputation technique for enhancing tabular data quality.Data, 8(6):102, 2023
2023
-
[22]
Simple imputation rules for prediction with missing data: Theoretical guarantees vs
Dimitris Bertsimas, Arthur Delarue, and Jean Pauphilet. Simple imputation rules for prediction with missing data: Theoretical guarantees vs. empirical performance.Transactions on Machine Learning Research, 2024
2024
-
[23]
Attention is all you need.Advances in neural information processing systems, 30, 2017
Ashish Vaswani, Noam Shazeer, Niki Parmar, Jakob Uszkoreit, Llion Jones, Aidan N Gomez, Łukasz Kaiser, and Illia Polosukhin. Attention is all you need.Advances in neural information processing systems, 30, 2017
2017
-
[24]
Solatorio and Olivier Dupriez
Aivin V . Solatorio and Olivier Dupriez. Realtabformer: Generating realistic relational and tabular data using transformers, 2023. URLhttps://arxiv.org/abs/2302.02041. 10
2023 arXiv
-
[25]
Attention mechanisms in deep learning: Towards explainable artificial intelligence
Nour El Houda Dehimi and Zakaria Tolba. Attention mechanisms in deep learning: Towards explainable artificial intelligence. In2024 6th International Conference on Pattern Analysis and Intelligent Systems (PAIS), pages 1–7. IEEE, 2024
2024
-
[26]
Numerical data imputation: Choose knn over deep learning
Florian Lalande and Kenji Doya. Numerical data imputation: Choose knn over deep learning. In International Conference on Similarity Search and Applications, pages 3–10. Springer, 2022
2022
-
[27]
A comparison of imputation methods using machine learning models
Heajung Suh and Jongwoo Song. A comparison of imputation methods using machine learning models. CSAM (Communications for Statistical Applications and Methods), 30(3):331–341, 2023
2023
-
[28]
Generating and imputing tabular data via diffusion and flow-based gradient-boosted trees
Alexia Jolicoeur-Martineau, Kilian Fatras, and Tal Kachman. Generating and imputing tabular data via diffusion and flow-based gradient-boosted trees. InInternational Conference on Artificial Intelligence and Statistics, pages 1288–1296. PMLR, 2024
2024
-
[29]
Pytorch: An imperative style, high-performance deep learning library.arXiv preprint arXiv:1912.01703, 2019
A Paszke. Pytorch: An imperative style, high-performance deep learning library.arXiv preprint arXiv:1912.01703, 2019
1912 arXiv
-
[30]
John Wiley & Sons, 2019
Roderick JA Little and Donald B Rubin.Statistical analysis with missing data, volume 793. John Wiley & Sons, 2019
2019
-
[31]
fake" survey questions created to collect the data. Features prefixed with
Donald B Rubin. Inference and missing data.Biometrika, 63(3):581–592, 1976. A Synthetic Dataset A.1 Ethical Considerations and Limitations Ethical Considerations:IMAGIC-500 is entirely derived from the World Bank’s SDIC synthetic dataset and contains no real individual data. T...
1976
-
[33]
Guidelines: • The answer NA means that the paper does not involve crowdsourcing nor research with human subjects
Institutional review board (IRB) approvals or equivalent for research with human subjects Question: Does the paper describe potential risks incurred by study participants, whether such risks were disclosed to the subjects, and whether Institutional Review Board (IRB) approvals...
2025
-
[2023]
doi: 10.1109/TKDE.2022.3186498
2022
Reviewed August 7, 2026 · model on record in the stance chip above.
Discussion (0). Sign in to comment.