REVIEW 4 major objections 8 minor 24 references
MetaInfoSci: An Integrated Web Tool for Scholarly Data Analysis
T0 review · 4 major / 8 minor · reviewed 2026-08-07 · deepseek-v4-flash
Pith's one-line read MetaInfoSci claims to be the first web tool that combines bibliometric, network, and AI-summary analysis in one place.
desk verdict A genuine-looking web tool paper whose central 'nothing else does this' claim is contradicted by its own description of pyBibX; send to review only with a demand for a fair comparison. read the letter →
The pith
A machine-rendered reading of the paper's core claim, the machinery that carries it, and where it could break.
The reading
What carries the argument
The platform's architecture is a modular analysis pipeline: four named modules—BibTrail for bibliometrics, SciTrace for scientometrics, ColabriX for collaboration and network analysis, and ThemantiX for thematic analysis—operate on merged, deduplicated bibliographic data. The load-bearing design element is the integration layer: a common data-mapping step that accepts files from databases like Scopus and Web of Science, plus a chart-control panel that lets users change plot type, colors, scale, and labels and then generate an AI textual summary of each visualization. That coupling of data integration, user-controlled visualization, and AI explanation is what the paper claims no existing tool provides.
What would settle it
Run a feature-matrix check on the current releases of pyBibX, Biblioshiny, VOSviewer, CitNetExplorer, and SciMAT to see whether any already lets a non-programmer upload Scopus and Web of Science files, build a collaboration network, customize a chart, and receive an AI summary without leaving the tool; if such a workflow exists, the paper's central gap claim is falsified.
Extended reading notes
Core claim
The paper's central claim is that MetaInfoSci is a web-based platform that, for the first time, integrates bibliometric analysis, scientometric analysis, collaboration-network analysis, thematic analysis, customizable visualizations, cross-database data merging, and AI-generated summaries into a single user interface. It presents this integration as filling a gap left by tools such as Biblioshiny, VOSviewer, pyBibX, CiteSpace, and others, which each cover only part of the workflow. The authors demonstrate the platform on 890 Scopus records from BML Munjal University and describe the pipeline: upload, field mapping, cleaning, module-wise analysis, customizable plotting, and AI summary generation.
Load-bearing premise
The whole motivation rests on the comparison table in Section 2, which surveys ten tools and asserts none combines AI summaries with network analysis; that assertion is not backed by a systematic, checked evaluation of every tool's current features.
Editorial extensions
If this is right
- Researchers can upload files from Scopus or Web of Science, merge and deduplicate them automatically, and run bibliometric, collaboration-network, and thematic analyses in a single session without writing code.
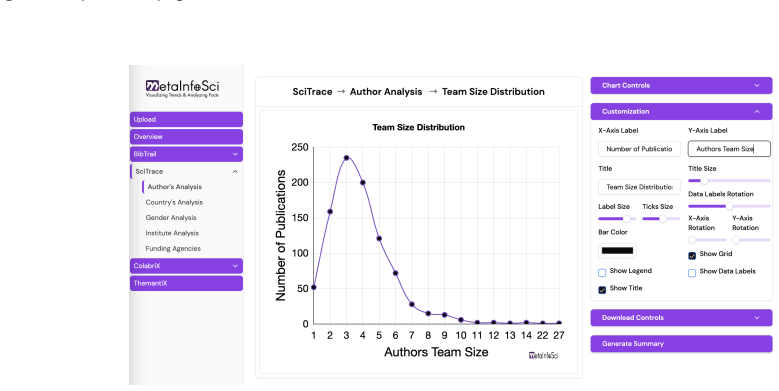
- Every result plot can be restyled through a control panel—chart type, colors, labels, scale, orientation, year window, and legend—and exported as PNG, JPEG, or CSV.
- Journal quartile analysis is performed by matching ISSNs against a Scimago master file, and author gender is estimated by AI models from names and country information.
- Collaboration networks support degree, betweenness, closeness, and eigenvector centrality, giant-component extraction, and community detection by Girvan-Newman or modularity-based methods.
- Each visualization comes with an AI-generated textual summary, so users can interpret trends without deep expertise in bibliometrics.
Reading between the lines
- An implication the authors leave implicit: if the upload-map-analyze-summarize pipeline proves reliable, it could be adapted to other structured corpora—patent filings, clinical trial records, or preprint repositories—where the same need for merging, network views, and plain-language summaries arises.
- A natural extension not developed in the paper is conversational querying of the underlying dataset, letting users ask follow-up questions in natural language rather than only receiving static AI summaries of each chart.
- The single-university demonstration of 890 records leaves scalability as an open question; a test on a multi-million-record corpus would show whether the integrated pipeline and network algorithms hold up outside the demo setting.
Editorial analysis
A structured set of objections, weighed in public.
Referee Report
Summary. The paper presents MetaInfoSci, a web-based platform that aims to unify bibliometric, scientometric, and network analyses with customizable visualizations, cross-database data merging, tailored queries, and AI-generated summaries of results. The authors motivate the tool by claiming that no existing single platform combines these capabilities, and they support this claim with a comparison of ten tools in Table 1. The methodology section restates standard centrality measures (degree, betweenness, closeness, eigenvector) and describes four analytic modules (BibTrail, SciTrace, ColabriX, ThemantiX). A demonstration on 890 Scopus records from one university is provided as an illustration. The paper also enumerates potential user groups and benefits.
Significance. If the novelty and completeness claims were established, MetaInfoSci would address a genuine practical gap: researchers currently switch among VOSviewer, Biblioshiny, CiteSpace, and similar tools, often without AI-assisted interpretation. The paper has real strengths: it reports a concrete, accessible web tool with a public URL; it gives a clear end-to-end workflow (upload, map, merge, analyze, visualize, summarize); the centrality definitions in Section 3 are textbook-correct; and the demonstration dataset is concrete and reproducible. The central falsifiable claim ('currently no single platform that integrates the full range of features from both domains', Abstract and Section 2) is checkable, which is a virtue. However, as submitted, that claim is not established: Table 1 is selective and internally inconsistent, no systematic feature matrix is provided, and the demonstration section is not a validation of correctness or usefulness. The contribution could still stand as a no-code integration layer, but only if the claims are narrowed and the evidence is strengthened.
major comments (4)
- [Section 2 / Table 1] The central novelty claim is internally contradicted by the manuscript's own description of pyBibX. The Abstract and Section 2 assert that existing bibliometric software lacks 'AI summary of results' and that no single platform combines bibliometric and network analysis. Yet Section 2.1 credits pyBibX with 'topic modeling and text summarization made possible by BERT and ChatGPT', the ability to 'study entire networks such as those for citations and collaboration', and custom queries — exactly the differentiators claimed for MetaInfoSci. Table 1 nonetheless categorizes pyBibX under 'Bibliometric analysis only' and lists only 'Machine learning integration' as a feature. This is a load-bearing inconsistency: it directly undermines the stated gap that motivates the paper. The authors must either correct Table 1 to reflect pyBibX's documented capabilities and revise the gap claim, or substantiate the claim with a systematic feature-matrix survey of a defined tool set with explicit inclusion criteria.
- [Section 2 / Table 1] The comparative survey is not systematic enough to support the universal claim that 'the tools that currently exist ... usually don't link together and rely on AI'. Ten tools are selected without stated inclusion or exclusion criteria, and the table does not contain a structured feature matrix (e.g., columns for AI summarization, network analysis, cross-database merging, GUI availability, and customization). Several widely used tools in the bibliometric ecosystem (e.g., Bibliometrix itself, Litmaps, Connected Papers, OpenAlex-based interfaces, and newer AI-assisted tools) are absent. Because the novelty claim is the paper's central motivation and contribution, the comparison must be made complete and transparent, or the claim must be restricted to what the evidence supports (for instance, a narrower claim about free web-based GUIs).
- [Section 5] The 'Results Demonstration' is not a validation. It reports a single dataset of 890 Scopus records from one institution and shows screenshots of outputs, but there is no evaluation of whether the bibliometric indicators, centrality values, or AI-generated summaries are correct. To support the abstract's promise of 'automated, AI-driven summaries of analytical results', the paper should at minimum specify the AI model and prompting strategy behind the summaries (Section 4.4 gives no such detail) and provide evidence of summary accuracy or usefulness. A comparison of the computed centrality and bibliometric outputs against a reference implementation (e.g., Bibliometrix or NetworkX applied to the same data) would also strengthen confidence in the tool's correctness.
- [Sections 3 and 4] The manuscript gives insufficient technical detail to assess reproducibility or feasibility. The data-merging and deduplication rules are described only as 'automatically merges, deduplicates, and maps fields'; the gender analysis (Section 3.2) is attributed to unspecified 'AI-based prediction models'; and the AI-summary feature (Section 4.4) is described only as an 'AI-generated explanatory summary'. Without details on the algorithms, the underlying AI services or models, and the system architecture, the evidence for the tool's behavior is entirely self-reported through screenshots. Adding a section on implementation architecture and the specific algorithms/models used would be necessary for a tool paper.
minor comments (8)
- [Figure captions (Figures 7, 8, 9, 10)] Figures 7, 8, 9, and 10 all carry the caption 'Upload file page', which is clearly incorrect for Figures 8, 9, and 10; each figure should have a descriptive caption that matches its content.
- [Equation (3)] Equation (3) is typeset as 1∑ over d(v,t); the division should be written as C_C(v) = 1 / Σ_t d(v,t) for readability.
- [Table 4] Table 4 contains misspellings: 'Girven-Newman' should be 'Girvan-Newman' and 'Liden' should be 'Leiden' (or the intended algorithm should be named explicitly).
- [Table 1] The section header 'Citations Analysis + Bibliometric Networks' should be 'Citation Analysis + Bibliometric Networks' for grammatical consistency.
- [Section 2.1] The prose in Section 2.1 is informal and inconsistent with journal style ('you can't merge your databases with AI-derived information using it', 'you have to do the work manually', 'it doesn't allow for many custom queries'); this should be rewritten in a neutral, technical register.
- [Table 6] Table 6 uses unclear notation: 'BG-W' and 'BG-T' are not defined, 'Color pallette' is a typo for 'palette', and 'Count Slider 1 to max In bar body, display top count' is grammatically incomplete.
- [Section 3.2] The gender-analysis subsection reports prediction of 'the likely gender' of authors via AI models without discussing accuracy, bias, or ethical limitations; given the societal sensitivity of gender inference, at least a caveat and a reference to the underlying model would be expected.
- [Conflict of interest statement] The conflict-of-interest statement reads 'The author declares no conflict of interest' while the manuscript has three authors; this should be pluralized or corrected.
Circularity Check
No circular derivation: the paper is a tool description whose only load-bearing claims are market-gap assertions, not results derived from their own inputs.
full rationale
MetaInfoSci is a software/tool presentation, not a derivation paper. Equations (1)-(4) are textbook definitions of degree, betweenness, closeness, and eigenvector centrality, and they are not used to predict anything from fitted parameters. The central novelty claim — 'there is currently no single platform that offers comprehensive features from both domains in one place' (Abstract and Section 2) — is supported by Table 1, a comparative survey, and by a citation to the authors' prior work for the limitation on merging databases (Khurana et al., 2022). That is an evidentiary claim about the software landscape, not a conclusion that is equivalent to its own premise by construction. Even if Table 1 is internally inconsistent — pyBibX is categorized under 'Bibliometric analysis only' while the text credits it with citation/collaboration networks, custom queries, and AI summaries — that is a correctness or completeness problem, not circular reasoning. The self-citations in the introduction (Sharma and Khurana, 2021; Khurana and Sharma, 2024) provide background context and are not invoked as a uniqueness theorem or as the proof of the tool's capabilities. The 890-record demonstration is illustrative rather than a fitted prediction. No step in the paper reduces to its own input, so the circularity score is 0.
Assumptions & free parameters
assumptions (5)
- standard math Standard definitions of degree, betweenness, closeness, and eigenvector centrality
- domain assumption Scimago journal quartile data reliably maps journals to quartiles via ISSN
- domain assumption AI-based gender prediction from author names and country information is accurate enough for gender analysis
- domain assumption LDA topic modeling and co-word analysis on titles and abstracts reveal meaningful thematic structure
- domain assumption The web platform itself remains operational and implements the described features as of the publication
Cite this review
Pith. "Pith review of MetaInfoSci: An Integrated Web Tool for Scholarly Data Analysis." pith.science (2026). https://pith.science/paper/PD5KR4O7
@misc{pith2026250609056,
  author       = {Pith},
  title        = {Pith review of: MetaInfoSci: An Integrated Web Tool for Scholarly Data Analysis},
  year         = {2026},
  howpublished = {\url{https://pith.science/paper/PD5KR4O7}},
  note         = {Machine review of arXiv:2506.09056}
}
read the original abstract
The exponential increase in academic publications has made it increasingly difficult for researchers to remain up to date and systematically synthesize knowledge scattered across vast and fragmented research domains. Literature reviews, particularly those supported by bibliometric methods, have become essential in organizing prior findings and guiding future research directions. While numerous tools exist for bibliometric analysis and network science, there is currently no single platform that integrates the full range of features from both domains. Researchers are often required to navigate multiple software environments, many of which lack customizable visualizations, cross-database integration, and AI-assisted result summarization. Addressing these limitations, this study introduces MetaInfoSci at www.metainfosci.com, a comprehensive, web-based platform designed to unify bibliometric, scientometric, and network analytical capabilities. The platform supports tailored query design, merges data from diverse sources, enables rich and adaptable visual outputs, and provides automated, AI-driven summaries of analytical results. This integrated approach aims to enhance the accessibility, efficiency, and depth of scientific literature analysis for scholars across disciplines.
Figures


Figures from the paper (16 more)




Reference graph
Works this paper leans on
-
[1]
write newline
" write newline "" before.all 'output.state := FUNCTION n.dashify 't := "" t empty not t #1 #1 substring "-" = t #1 #2 substring "--" = not "--" * t #2 global.max substring 't := t #1 #1 substring "-" = "-" * t #2 global.max substring 't := while if t #1 #1 substring * t #2 global.max substring 't := if while FUNCTION word.in bbl.in ":" * " " * FUNCTION f...
-
[2]
author Altay, E. , author Balım, A.G. , year 2023 . title Vosviewer application within the scope of bibliometric analysis: Literature review on the use of virtual laboratories in education . journal Education Mind volume 3 , pages 9
work page 2023
-
[3]
author Aria, M. , author Cuccurullo, C. , year 2017 . title bibliometrix: An r-tool for comprehensive science mapping analysis . journal Journal of informetrics volume 11 , pages 959--975
work page 2017
-
[4]
author B \"o rner, K. , year 2011 . title Science of science studies: Sci2 tool . journal Communications of the ACM volume 54 , pages 60--69
work page 2011
-
[5]
author Briner, R.B. , author Denyer, D. , year 2012 . title Systematic review and evidence synthesis as a practice and scholarship tool
work page 2012
-
[6]
author Chen, C. , year 2004 . title Searching for intellectual turning points: progressive knowledge domain visualization . journal Proceedings of the National Academy of Sciences volume 101 , pages 5303--5310
work page 2004
-
[7]
author Chen, C. , et al., year 2016 . title CiteSpace: a practical guide for mapping scientific literature . publisher Nova Science Publishers Hauppauge, NY, USA
work page 2016
-
[8]
, author L \'o pez-Herrera, A.G
author Cobo, M.J. , author L \'o pez-Herrera, A.G. , author Herrera-Viedma, E. , author Herrera, F. , year 2012 . title Scimat: A new science mapping analysis software tool . journal Journal of the American Society for information Science and Technology volume 63 , pages 1609--1630
work page 2012
Show all 24 references
-
[9]
, author Waaijer, C.J
author Guler, A.T. , author Waaijer, C.J. , author Palmblad, M. , year 2016 . title Scientific workflows for bibliometrics . journal Scientometrics volume 107 , pages 385--398
2016
-
[10]
, year 2010
author Harzing, A.W. , year 2010 . title The publish or perish book . publisher Tarma Software Research Pty Limited Melbourne
2010
-
[11]
, author Ganesan, G
author Khurana, P. , author Ganesan, G. , author Kumar, G. , author Sharma, K. , year 2022 . title A comparative analysis of unified informetrics with scopus and web of science . journal Journal of Scientometric Research volume 11 , pages 146--154
2022
-
[12]
, author Sharma, K
author Khurana, P. , author Sharma, K. , year 2024 . title Growth and impact of blockchain scientific collaboration network: A bibliometric analysis . journal Multimedia Tools and Applications volume 83 , pages 44979--44999
2024
-
[13]
, author Herrera-Viedma, E
author Moral-Muñoz, J.A. , author Herrera-Viedma, E. , author Santisteban-Espejo, A. , author Cobo, M.J. , year 2020 . title Software tools for conducting bibliometric analysis in science: An up-to-date review . journal El Profesional de la Información volume 29
2020
-
[14]
, author Basilio, M.P
author Pereira, V. , author Basilio, M.P. , author Santos, C.H.T. , year 2023 . title pybibx—a python library for bibliometric and scientometric analysis powered with artificial intelligence tools . journal arXiv preprint arXiv:2304.14516
2023 arXiv
-
[15]
, author Basilio, M.P
author Pereira, V. , author Basilio, M.P. , author Santos, C.H.T. , year 2025 . title Pybibx--a python library for bibliometric and scientometric analysis powered with artificial intelligence tools . journal Data Technologies and Applications
2025
-
[16]
, author Danell, R
author Persson, O. , author Danell, R. , author Schneider, J.W. , year 2009 . title How to use bibexcel for various types of bibliometric analysis . journal Celebrating scholarly communication studies: A Festschrift for Olle Persson at his 60th Birthday volume 5 , pages 9--24
2009
-
[17]
, author Barab \'a si, A.L
author P \'o sfai, M. , author Barab \'a si, A.L. , year 2016 . title Network science . volume volume 3 . publisher Citeseer
2016
-
[18]
, year 2012
author Rousseau, D.M. , year 2012 . title The Oxford handbook of evidence-based management . publisher Oxford University Press
2012
-
[19]
, author Ram \' rez-Gonz \'a lez, G
author Ruiz-Rosero, J. , author Ram \' rez-Gonz \'a lez, G. , author Viveros-Delgado, J. , year 2019 . title Software survey: Scientopy, a scientometric tool for topics trend analysis in scientific publications . journal Scientometrics volume 121 , pages 1165--1188
2019
-
[20]
, author Khurana, P
author Sharma, K. , author Khurana, P. , year 2021 . title Growth and dynamics of econophysics: a bibliometric and network analysis . journal Scientometrics volume 126 , pages 4417--4436
2021
-
[21]
, author Waltman, L
author Van Eck, N. , author Waltman, L. , year 2009 . title Software survey: Vosviewer, a computer program for bibliometric mapping . journal scientometrics volume 84 , pages 523--538
2009
-
[22]
, author Waltman, L
author Van Eck, N.J. , author Waltman, L. , year 2014 . title Citnetexplorer: A new software tool for analyzing and visualizing citation networks . journal Journal of informetrics volume 8 , pages 802--823
2014
-
[23]
, author Waltman, L
author Van Eck, N.J. , author Waltman, L. , year 2017 . title Citation-based clustering of publications using citnetexplorer and vosviewer . journal Scientometrics volume 111 , pages 1053--1070
2017
-
[24]
, author Gao, J
author Yang, F. , author Gao, J. , author Kan, X. , year 2024 . title Biblioshiny-r application on bioinformatics education research (2004--2023) . journal Curriculum and Teaching Methodology volume 7 , pages 192--199
2024
Reviewed August 7, 2026 · model on record in the stance chip above.
Discussion (0). Sign in to comment.