REVIEW 4 major objections 5 minor 23 references
A Probabilistic Framework for Imputing Genetic Distances in Spatiotemporal Pathogen Models
T0 review · 4 major / 5 minor · reviewed 2026-08-07 · deepseek-v4-flash
Pith's one-line read The paper claims that genetic divergence between an unsequenced pathogen case and a sequenced reference can be imputed as a calibrated interval from collection date, location, and host taxonomy alone.
desk verdict A useful proof-of-concept for imputing genetic divergence from metadata, but the validation never touches the actual unsequenced-case target and the missingness assumption is unexamined. read the letter →
The pith
A machine-rendered reading of the paper's core claim, the machinery that carries it, and where it could break.
The reading
What carries the argument
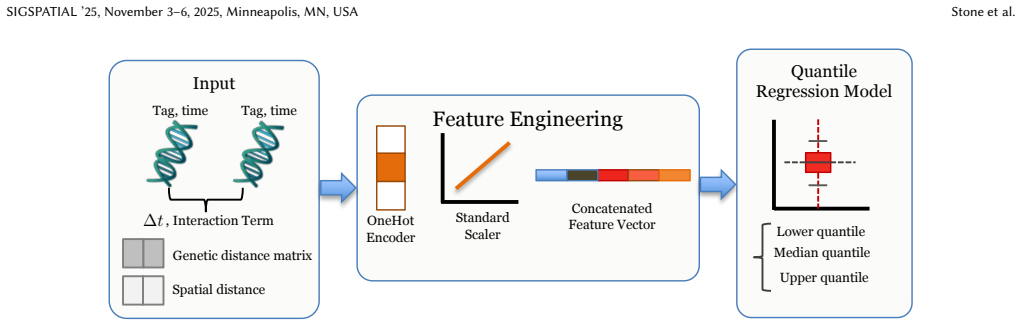
The load-bearing object is a set of three gradient-boosted quantile regression models, one each for the 5th, 50th, and 95th conditional quantiles of K80 divergence, fitted by minimizing pinball loss. Quantile regression matters here because evolutionary divergence is skewed and heteroscedastic: predicting intervals instead of a mean lets the model express that uncertainty grows with temporal and geographic separation. The target distance is the Kimura two-parameter (K80) model, which converts proportions of transition and transversion differences into an evolutionary distance corrected for multiple substitutions. The feature construction encodes temporal lag $\Delta t_{ij}$, great-circle distance $d^{\mathrm{geo}}_{ij}$, their product as a spatiotemporal coupling term, same-family and same-state indicators, and sample year, all standardized and one-hot encoded for tree-based learning.
What would settle it
Artificially hold out sequences for a random sample of already-sequenced cases, impute their divergence from metadata alone, and compare the imputed 90 percent intervals with the true K80 distances; if coverage drops well below 90 percent or errors exceed the reported range, the extrapolation from sequenced to unsequenced pairs is not transportable. A complementary field check is to impute distances for unsequenced detections before their sequences are later generated and compare predictions against the eventual observed distances.
Extended reading notes
Core claim
On its own terms, the paper claims that for every ordered pair $(i,j)$ consisting of an unsequenced case $i$ and a sequenced reference $j$, the conditional quantile function $Q_\tau(d_{ij}\mid x_{ij})$ at $\tau=0.05, 0.5, 0.95$ can be estimated by gradient-boosted quantile regression over a feature vector of temporal lag, great-circle geographic distance, their interaction, same avian family, same state, and sample year. The training targets are K80 evolutionary distances computed from aligned sequences for the $S\times S$ pairs, and inference extrapolates to $A\times S$ pairs where no sequence exists. The paper reports that this produces 90 percent intervals whose real-world coverage is 94.95 percent, 92.63 percent, and 90.07 percent in the LOW, MID, and HIGH divergence strata, with median absolute error below 0.001 in the low and middle strata and larger errors in the high-divergence stratum where spatiotemporal metadata carry less signal.
Load-bearing premise
The whole imputation rests on the assumption that unsequenced cases follow the same relationship between metadata and genetic divergence as the sequenced cases used for training, even though sequencing is known to favor certain hosts, severe outcomes, and known reservoirs.
Editorial extensions
If this is right
- Unsequenced detections can be attached to sequenced reference cases with an interval-valued genetic edge weight, so graph- and diffusion-based epidemic models no longer need to drop unsequenced nodes.
- Because the intervals are calibrated near their nominal 90 percent level in the low and middle divergence ranges, downstream probabilistic edge construction can use interval width as a confidence signal.
- The method works without sequence alignment, phylogenetic placement, or inferred transmission chains, so it applies in decentralized wildlife surveillance settings where those resources are unavailable.
- The framework is pathogen-agnostic in principle: any dataset with pairwise metadata and observed divergence on a subset of pairs can be cast in the same form, after choosing an appropriate substitution model and time scale.
- In high-divergence settings involving inter-lineage or cross-host comparisons, point predictions degrade but interval widths expand, flagging where metadata alone cannot resolve genetic relatedness.
Reading between the lines
- Implicit in the paper but not directly validated: extrapolation from sequenced to unsequenced pairs assumes the conditional distribution of divergence given metadata is the same in both groups, whereas the paper itself notes that surveillance skews toward highly pathogenic cases, known reservoirs, and particular host species; testing on cases that were sequenced only later would quantify this gap.
- A natural extension is to include lineage or subclade identifiers and environmental covariates, which the paper names as future work; this could narrow the wide HIGH-divergence intervals that currently limit usefulness for inter-lineage comparisons.
- The evaluation metric that matters most for downstream use may be not pairwise interval coverage but whether imputed edges improve forecasting or cluster recovery in the graph model; a graph-level ablation would provide a stronger end-to-end test.
- Because the model outputs a conditional quantile function at three levels, one could sample divergence draws rather than use the midpoint, propagating uncertainty through diffusion simulations in a way that point-imputation methods cannot.
Editorial analysis
A structured set of objections, weighed in public.
Referee Report
Summary. The paper proposes a probabilistic (quantile regression) framework, QRI, for imputing pairwise K80 genetic distances between unsequenced pathogen cases and sequenced reference cases using only spatiotemporal and host metadata. The model is trained on all ordered pairs among sequenced cases (S×S), where K80 distances are observed, and then applied at inference to pairs involving unsequenced cases (A×S). Features include temporal lag, great-circle distance, a spatiotemporal interaction term, host family indicators, and sample year; separate LightGBM models are fit for the 0.05, 0.5, and 0.95 quantiles. The method is evaluated on a curated HPAI A/H5 wild-bird dataset of 2,143 sequenced cases yielding 1,048,575 pairs, with stratified cross-validation, ablation studies, SHAP analysis, and a small case study. The central claim is that the model produces well-calibrated, biologically plausible divergence intervals that can be used to integrate unsequenced detections into downstream spatial-genetic models such as the authors' BLUE graph framework.
Significance. If the central claim were fully supported, this would be a useful contribution: it addresses a real gap in genomic surveillance by providing uncertainty-aware distance estimates for cases without sequences, is computationally scalable, and avoids strong geometric or phylogenetic assumptions. The code is released, the problem is clearly formulated, and the calibration results on observed S×S pairs (coverage near 90% across divergence strata) are a genuine strength. However, the significance of the paper as it stands is limited by the fact that the actual application target—A×S pairs with unsequenced cases—is never validated, and the acknowledged non-ignorable sequencing bias in Section 2.1 directly threatens the transportability of the learned conditional quantiles. The contribution is therefore conditional on a missingness assumption that the paper does not test.
major comments (4)
- [§4.1, §5.1, §6.1] The paper trains on S×S pairs and applies the model to A×S pairs (Section 4.1), but all reported validation results (Table 2, Figure 2, Figure 3) are on held-out S×S pairs. No experiment checks predictions against true distances for unsequenced cases. Because Section 2.1 explicitly states that surveillance prioritizes highly pathogenic cases, known reservoirs, and specific host species, the missingness of sequences is systematic rather than ignorable. The authors should either (i) perform a case-withholding simulation in which entire cases are treated as unsequenced and their distances to all other cases are predicted and compared to observed distances, or (ii) provide a formal missingness-model argument for why the conditional quantile function transfers from S×S to A×S. As written, the central claim that the method 'enables biologically plausible imputation' for unsequenced detections is not directly supported by the evidence presented.
- [§5.2, §5.1] The evaluation is pair-based, not case-disjoint: 1,048,575 pairs are derived from only 2,143 cases, and Section 5.2 describes 'Stratified 5-fold cross-validation' without explicitly grouping by case. Section 5.1 says the held-out set is 'disjoint in space and time' but does not state that no case appears in both training and test, which is the necessary condition to prevent overlap leakage. If the same case appears in both training and test pairs, the model has already seen features and, more importantly, the case's divergence profile in training, which will inflate the reported MAE, R², and coverage numbers relative to the deployment scenario, where the unsequenced case is genuinely unseen. The authors must document whether folds are case-disjoint, and if not, rerun the experiments with case-disjoint folds.
- [§6.1, Table 2] The reported overall R² of 0.19 and within-stratum R² values of 0.03–0.07 indicate that the spatiotemporal and host features explain only a small fraction of the variance in K80 divergence. The authors acknowledge this and argue that interval calibration is the relevant metric, but the paper also repeatedly describes the model as producing 'biologically plausible divergence estimates' and uses the median prediction as a proxy distance for downstream edge construction (Section 5.4). Given the low explained variance, the point predictions are only weakly informative; this does not invalidate the interval-calibration claims, but it requires a more careful statement of what the method can and cannot support, and ideally a comparison against a simple baseline (e.g., a model using temporal lag alone) to demonstrate the added value of the full feature set.
- [§5.4, §7] The downstream integration into the BLUE model (Section 5.4) is described only at a conceptual level, with no experiment demonstrating that the imputed distances improve forecasting, clustering, or any downstream task. The paper states that 'the midpoint or lower bound of the predicted interval can be used as a proxy distance,' but no quantitative result shows whether such a proxy is better than alternatives (e.g., ignoring genetic distance or using geographic distance only). Given that the motivation for the framework is to enable downstream integration, the absence of any downstream evaluation weakens the practical significance of the contribution.
minor comments (5)
- [§3.3] The sentence 'These yielded 1,048,575 valid sequence same year pairs' should read 'same-year pairs' for grammatical clarity.
- [§6.4] The sentence 'Categorical metadata, such as taxonomic family, contributed lesson their own' contains a typo; it should be 'contributed less on their own'.
- [§1, Abstract] The abstract states the method infers distances 'within defined transmission chains,' but the paper explicitly avoids transmission-chain inference and does not use chain information; the wording should be adjusted to avoid overstating the method.
- [§3.3] The paper relies on the Avian-US dataset introduced in reference [7], but the dataset construction is only briefly described here. Since record linkage errors directly affect the training labels, providing more details on the linkage pipeline and the validation of matched pairs (beyond the >95% precision statement) would improve reproducibility.
- [§6.6] The case study says 'we examined 30 A/H5 case pairs' and Figure 4 shows spatial links, but the description does not clarify whether these pairs are from the held-out set or the training set, which affects the interpretation of the examples.
Circularity Check
No equation-level circularity: the quantile regression is trained and evaluated on observed S×S K80 distances, while the unvalidated A×S imputation target is an extrapolation concern, not a fitted input.
full rationale
The claimed derivation chain is not circular at the equation level. The target d_ij is K80 divergence computed from aligned sequences, the features are metadata, and Q_tau(d|x) is estimated by minimizing pinball loss (Eq. 2) on observed S×S pairs and evaluated on held-out S×S pairs (Eq. 6, Table 2). No parameter is fitted to A×S targets and then renamed a prediction, and no feature is defined in terms of the K80 target. The main vulnerability is external validity: Section 4.1 trains only on S×S and applies the model to A×S, while Section 5.1 validates only on held-out S×S. Section 2.1 concedes that surveillance 'tends to prioritize highly pathogenic cases, known reservoirs, or specific host species,' so the missingness that generates A is non-ignorable. This is a transportability gap, not a reduction-by-construction. Self-citations exist: the Avian-US dataset and BLUE model come from the authors' own prior work [7], and simulation-bias motivation cites [21] with overlapping authorship. However, the paper reports its own record-linkage precision evaluation (>95% on a held-out manually reviewed subset), and the quantile regression itself is independently trainable from the described data; these citations are not used to force the central result. The acknowledged absence of ground truth for unsequenced pairs (Section 1: 'there is no ground-truth divergence available for unsequenced case pairs, which rules out direct supervision and complicates model evaluation') is an honest limitation rather than a hidden circular step. Overall, no circular step is present; the score reflects minor self-citations and the unvalidated A×S target, not derivation equivalence.
Assumptions & free parameters
free parameters (3)
- LightGBM hyperparameters (learning rate, tree depth, number of estimators) =
chosen by grid search with 5-fold cross-validation
- Stratum boundaries for LOW/MID/HIGH divergence classes =
0.003246 and 0.006632 K80 distance
- Record linkage match threshold =
not specified, tuned for high precision, held-out precision >95%
assumptions (4)
- domain assumption K80 is an appropriate evolutionary distance model for within-clade H5 avian influenza comparisons.
- domain assumption Temporal lag, geographic distance, host family, and year contain enough signal to predict genetic divergence.
- domain assumption Unsequenced cases are missing at random conditional on the observed metadata features.
- domain assumption The record linkage correctly matches sequences to case records.
Cite this review
Pith. "Pith review of A Probabilistic Framework for Imputing Genetic Distances in Spatiotemporal Pathogen Models." pith.science (2026). https://pith.science/paper/3KIERFYK
@misc{pith2026250609076,
  author       = {Pith},
  title        = {Pith review of: A Probabilistic Framework for Imputing Genetic Distances in Spatiotemporal Pathogen Models},
  year         = {2026},
  howpublished = {\url{https://pith.science/paper/3KIERFYK}},
  note         = {Machine review of arXiv:2506.09076}
}
read the original abstract
Pathogen genome data offers valuable structure for spatial models, but its utility is limited by incomplete sequencing coverage. We propose a probabilistic framework for inferring genetic distances between unsequenced cases and known sequences within defined transmission chains, using time-aware evolutionary distance modeling. The method estimates pairwise divergence from collection dates and observed genetic distances, enabling biologically plausible imputation grounded in observed divergence patterns, without requiring sequence alignment or known transmission chains. Applied to highly pathogenic avian influenza A/H5 cases in wild birds in the United States, this approach supports scalable, uncertainty-aware augmentation of genomic datasets and enhances the integration of evolutionary information into spatiotemporal modeling workflows.
Figures


Figures from the paper (1 more)

Reference graph
Works this paper leans on
-
[1]
Berger and Alexandros Stamatakis
Simon A. Berger and Alexandros Stamatakis. 2011. Aligning short reads to refer- ence alignments and trees.Bioinformatics27, 15 (06 2011), 2068–2075. doi:10.1093/ bioinformatics/btr320 arXiv:https://academic.oup.com/bioinformatics/article- pdf/27/15/2068/48865092/bioinformatics_27_15_2068.pdf
work page 2011
-
[2]
Jian-Feng Cai, Emmanuel J Candès, and Zuowei Shen. 2010. A singular value thresholding algorithm for matrix completion. InSIAM Journal on Optimization, Vol. 20. SIAM, 1956–1982
work page 2010
-
[3]
Diego Darriba, Michael Weiß, and Alexandros Stamatakis. 2016. Prediction of missing sequences and branch lengths in phylogenomic data.Bioinformatics32, 9 (2016), 1331–1337
work page 2016
-
[4]
Sayantan Das, Lukas Forer, H¯useyin Sünbüloğlu, et al. 2016. Next-generation genotype imputation service and methods.Nature Genetics48, 10 (2016), 1284– 1287. SIGSPATIAL ’25, November 3–6, 2025, Minneapolis, MN, USA Stone et al
work page 2016
-
[5]
de Vienne, Gabriela Aguileta, and Sébastien Ollier
Damien M. de Vienne, Gabriela Aguileta, and Sébastien Ollier. 2011. Euclidean Nature of Phylogenetic Distance Matrices.Systematic Biology60, 6 (07 2011), 826–
work page 2011
-
[6]
Tom Druet, IM Macleod, and BJ Hayes. 2014. Toward genomic prediction from whole-genome sequence data: impact of sequencing design on genotype imputa- tion and accuracy of predictions.Heredity112, 1 (2014), 39–47
work page 2014
- [7]
-
[8]
Bryan T Grenfell, Oliver G Pybus, Julia R Gog, James LN Wood, Janet M Daly, John A Mumford, and Edward C Holmes. 2004. Unifying the epidemiological and evolutionary dynamics of pathogens.Science303, 5656 (2004), 327–332
work page 2004
Show all 23 references
-
[9]
Aditya Grover, Geoffrey Zweig, and Stefano Ermon. 2019. Graphite: Iterative generative modeling of graphs. InProceedings of the 36th International Conference on Machine Learning. 2434–2444
2019
-
[10]
Motoo Kimura. 1980. A simple method for estimating evolutionary rates of base substitutions through comparative studies of nucleotide sequences.Journal of Molecular Evolution16, 2 (1980), 111–120
1980
-
[11]
Philippe Lemey, Andrew Rambaut, Alexei J Drummond, and Marc A Suchard
-
[12]
2009.The phylo- genetic handbook: a practical approach to phylogenetic analysis and hypothesis testing
Philippe Lemey, Marco Salemi, and Anne-Mieke Vandamme. 2009.The phylo- genetic handbook: a practical approach to phylogenetic analysis and hypothesis testing. Cambridge University Press
2009
-
[13]
Zehui Li, Yuhao Ni, William AV Beardall, Guoxuan Xia, Akashaditya Das, Guy- Bart Stan, and Yiren Zhao. 2024. Discdiff: Latent diffusion model for dna sequence generation.arXiv preprint arXiv:2402.06079(2024)
2024 arXiv
-
[14]
Jonathan Marchini, Bryan Howie, Simon Myers, Gil McVean, and Peter Don- nelly. 2007. A new multipoint method for genome-wide association studies by imputation of genotypes.Nature Genetics39, 7 (2007), 906–913
2007
-
[15]
Elchanan Mossel. 2005. Phase transitions in phylogeny.Transactions on Informa- tion Theory51, 5 (2005), 1609–1623
2005
-
[16]
Evgeni V Sokurenko, Richard Gomulkiewicz, and Daniel E Dykhuizen. 2006. Source–sink dynamics of virulence evolution.Nature Reviews Microbiology4, 7 (2006), 548–555
2006
-
[17]
Michelle Wille and Ian G. Barr. 2022. Resurgence of avian influenza virus.Science376, 6592 (2022), 459–460. doi:10.1126/science.abo1232 arXiv:https://www.science.org/doi/pdf/10.1126/science.abo1232
2022 doi
-
[18]
Ruopeng Xie, Kimberly M Edwards, Michelle Wille, Xiaoman Wei, Sook-San Wong, Mark Zanin, Rabeh El-Shesheny, Mariette Ducatez, Leo LM Poon, Ghazi Kayali, et al. 2023. The episodic resurgence of highly pathogenic avian influenza H5 virus.Nature622, 7984 (2023), 810–817
2023
-
[19]
Burak Yelmen and Flora Jay. 2023. An overview of deep generative models in functional and evolutionary genomics.Annual Review of Biomedical Data Science 6, 1 (2023), 173–189
2023
-
[20]
Jiaxuan You, Xiaobai Ma, Yi Ding, Mykel J Kochenderfer, and Jure Leskovec. 2020. Handling missing data with graph representation learning.Advances in Neural Information Processing Systems33 (2020), 19075–19087
2020
-
[21]
Raina MacIntyre
Andreas Züfle, Flora Salim, Taylor Anderson, Matthew Scotch, Li Xiong, Kacper Sokol, Hao Xue, Ruochen Kong, David Heslop, Hye-Young Paik, and C. Raina MacIntyre. 2024. Leveraging Simulation Data to Understand Bias in Predictive Models of Infectious Disease Spread.ACM Transacti...
2024 doi
-
[832]
doi:10.1093/sysbio/syr066 arXiv:https://academic.oup.com/sysbio/article- pdf/60/6/826/24559644/syr066.pdf
-
[2009]
Bayesian phylogeography finds its roots.PLoS computational biology5, 9 (2009), e1000520
2009
Reviewed August 7, 2026 · model on record in the stance chip above.
Discussion (0). Sign in to comment.