REVIEW 3 major objections 5 minor 31 references
Hierarchical Error Assessment of CAD Models for Aircraft Manufacturing-and-Measurement
T0 review · 3 major / 5 minor · reviewed 2026-08-07 · deepseek-v4-flash
Pith's one-line read The paper proposes HEA-MM, a pipeline that grades a manufactured aircraft part from one structured-light scan by measuring global, patch-level, and hole-level errors against the reference CAD model.
desk verdict The part-level error metric measures the wrong thing—distance from fitted primitive to CAD rather than from measured points—so the paper's main novelty doesn't yet support its accuracy claim. read the letter →
The pith
A machine-rendered reading of the paper's core claim, the machinery that carries it, and where it could break.
The reading
What carries the argument
The load-bearing mechanism is the three-level error decomposition of the registered point cloud, with the part level carried by an optimization-based primitive-refinement energy $E = \omega_f E_f + \omega_s E_s + \omega_c E_c$ whose fidelity, simplicity, and completeness terms drive splitting and merging operations over four primitive types (plane, sphere, cone, cylinder), and whose exploration stops when no operation lowers the energy. The feature level is carried by a two-stage circular-hole detector: curvature-weighted tensor voting identifies edge points, and a hypothesize-and-clusterize multi-circle fitting scheme, built on multi-class cascaded T-linkage with iterative outlier rejection, estimates radii and centroids. The global level is carried by the RMSE distance from the whole scanned cloud to the CAD surface after coarse-to-fine registration.
What would settle it
Scan a test aircraft part that includes both drilled circular holes and a freeform B-spline blade surface, run HEA-MM end to end, and compare the part-level patch boundaries and the fitted circle radii with a coordinate-measuring-machine measurement of the same part; if the freeform region is over- or under-segmented or the circle radii deviate beyond scanner noise, the hierarchical-error claim is falsified.
Extended reading notes
Core claim
The central claim is that a single structured-light scan of a manufactured aircraft part, registered against its reference CAD model, can be turned into a complete manufacturing-error report by evaluating three nested levels: the global root-mean-square deviation of the whole cloud; per-patch errors on primitives recovered by a new optimization-based refinement that splits and merges candidate planes, spheres, cones, and cylinders; and per-hole errors on circular features detected by curvature-weighted tensor voting plus a hypothesize-and-clusterize multi-circle fitter. The paper reports millimetre-scale errors on real aircraft parts and states that the registration error is roughly an order of magnitude smaller than the three-level errors, so the measured deviations are attributed to manufacturing rather than alignment. The authors claim this is the first hierarchical error-assessment framework embedded in a manufacturing-and-measurement platform, and they record in Section IV-D that the part-level stage assumes the four primitive types and can fail on freeform B-spline/NURBS surfaces.
Load-bearing premise
The part-level analysis assumes every region of the scanned part can be represented by one of four simple geometric shapes (plane, sphere, cylinder, or cone) and that a region's shape type does not change while being split or merged; the paper says in Section IV-D that freeform B-spline/NURBS surfaces may therefore fail to segment.
Editorial extensions
If this is right
- A single scan of a workpiece yields pass/fail decisions plus error values in millimetres at three levels: whole part, each geometric patch, and every detected circular hole.
- Because the reported registration error is roughly an order of magnitude smaller than the three-level errors, the deviations calculated after alignment can be read as manufacturing error rather than scan-alignment noise.
- Part-level patch errors turn a whole-part rejection into a region-specific diagnosis, telling the factory which patch of the workpiece drifted from design.
- Feature-level radius and centroid deviations give a quantitative check on hole size and placement, which are the dimensions that matter for assembly fit.
Reading between the lines
- As an editorial extension, the same hierarchy could be fed back to the milling step: repeated part-level errors on the same patch could trigger a tool-wear or fixture correction, closing a loop the paper does not describe.
- A direct test against coordinate-measuring-machine values on the same physical parts would confirm whether the scan-derived hole radii and centroid deviations are accurate in absolute millimetres; the paper reports errors relative to the CAD model.
- Replacing the fixed four-primitive assumption with a re-fitting rule for freeform surfaces would extend the framework to sculpted parts such as blades, which the paper's Section IV-D acknowledges as the current failure mode.
- The hypothesize-and-clusterize multi-circle stage could be reused for other assembly-critical features such as slots and countersinks, which the authors list as future work.
Editorial analysis
A structured set of objections, weighed in public.
Referee Report
Summary. The paper proposes HEA-MM, a hierarchical pipeline for assessing manufacturing errors of aircraft parts by comparing structured-light scans with reference CAD models. After coarse-to-fine registration (FGR plus ICP), the framework reports errors at three levels: global RMSE, part-level distances computed from refined geometric primitives (plane, sphere, cylinder, cone), and feature-level errors for circular holes detected by tensor-voting edge extraction and multi-circle fitting. The method is evaluated on three aircraft CAD models and on synthetic circle data, with comparisons against RANSAC, PointNet++, HPNet, KF, T-linkage, and MSH. The authors claim this is the first hierarchical error assessment framework within a manufacturing-and-measurement platform and that it enables accurate automated error assessment.
Significance. If the central claims are supported, the framework would be a useful industrial tool for automated multi-level inspection, integrating global, part, and feature error analysis on real scanned parts. The paper has genuine strengths: the error measures are defined against an external CAD reference rather than quantities fitted from the data, so there is no circularity; the experiments use real scanned data from a deployed platform; the multi-circle fitting is evaluated quantitatively on synthetic data with misclassification error and on real data with false-negative/false-positive counts; and runtime is reported. However, the evaluation is thin: only three real models are used, no repeated trials or error bars are given, the part-level metric is defined from fitted primitives rather than measured points, and the primitive segmentation is evaluated only visually. These gaps currently prevent the paper from supporting the claim that HEA-MM enables accurate error assessment at the part level.
major comments (3)
- [Section III-D, Eq. (6)] The part-level error is defined as the average and maximum distance from each fitted primitive to the reference CAD model, not from the measured points to the CAD model. Since the primitive is a best-fit plane, sphere, cylinder, or cone, any within-patch deviation that does not displace the best-fit primitive—such as a warp, a dent, or a saddle-shaped region—is invisible to E_part_avg and E_part_max. Even with a perfect segmentation, a warped planar patch can have a best-fit plane close to the CAD plane while the underlying scanned points deviate substantially. The global RMSE captures such residuals, but the part-level report, which is the level where the paper's main algorithmic contribution lies, does not. The paper provides no per-patch comparison of primitive-based distances against direct point-to-CAD distances, and no ground-truth part-level errors. This is a load-bearing issue for the central claim that HEA-MM 'enables accurate error assessment'; the part-level metric must be supplemented with, or replaced by, direct point-to-CAD residual statistics per patch.
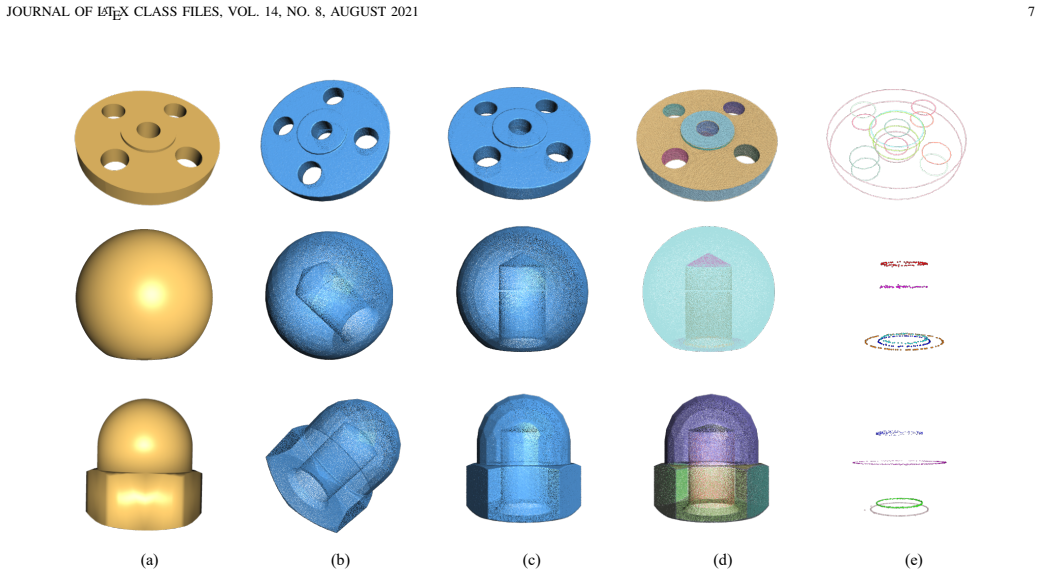
- [Section IV, Tables I and V] The experimental evaluation is too thin to support the generality claimed in the title and abstract. Only three real aircraft models are reported, with no repeated scans, no error bars, and no uncertainty quantification; the values in Table I (main text) and Table V (supplementary) differ for the same model labels (1), (2), (3), without any explanation of whether these are different scans, different models, or corrected numbers. Additionally, the primitive segmentation results in Figures 4 and 8 are evaluated only visually, and the supplementary material explicitly states that 'there is no ground truth of the detection results.' To substantiate the central claims, the authors should provide quantitative primitive-segmentation evaluation on data with known ground truth, report variance across repeated measurements, and clarify the relationship between Tables I and V. The feature-level circle detection is compared with baselines only in terms of false negatives and false positives; the radius and centroid errors in Tables I and V are reported only for the proposed method, without comparison to alternative circle-fitting methods on the same real scans.
- [Section IV-D] The authors candidly state that the method 'might fail to get satisfied segmentation results due to the B-spline/NURBS surfaces, or other more complex shapes.' This is an honest limitation, but the abstract and conclusion claim applicability to 'aircraft CAD models' without this qualification. Since aircraft parts commonly contain freeform surfaces, the four-primitive assumption materially restricts the scope of the central claim. The paper should either narrow its claims to models composed of planes, spheres, cylinders, and cones, or demonstrate how the framework handles models with freeform surfaces. This is not an internal inconsistency, but it is a generality restriction that should be reflected in the title and contributions.
minor comments (5)
- [Section III-E, Eq. (10)] In Eq. (10), the last definition is labeled 'Ecomp radius avg' but should be 'Ecomp centroid avg'; the current labeling duplicates the radius-average symbol and makes the equation confusing.
- [Section III-E, Eq. (7)] The tensor-voting weight is defined using a vector q_j = ||v_i - v_j||, so q_j is a scalar; writing ||q_j|| in the exponential is redundant. More importantly, the denominator ||v_j v_j^T|| in Eq. (7) is not standard notation—the usual stick-tensor form is v_j v_j^T / ||v_j||^2—so the formula should be clarified or corrected.
- [Supplementary material, Table IV] The caption says 'false negative and false negative cases'; it should read 'false negatives and false positives.' The sentence 'fn and fp denote the number of errors and misses' is also imprecise and should be rephrased.
- [Section IV-C] The parameters (energy weights, inlier threshold, tensor-voting sigma, edge threshold, and iteration limits) are fixed empirically with no sensitivity analysis. Since several of these parameters interact, a brief sensitivity study—for example, varying each parameter by a factor of two while reporting the resulting errors—would substantially strengthen the reproducibility claims.
- [Section IV-A, Figure 4] The claim that learning-based methods produce poor results on edge regions is supported only by visual inspection of a single rivet example; a quantitative comparison, even on a small set of labeled patches, would be more persuasive.
Circularity Check
No significant circularity: all error levels are measured against the external CAD model; self-citations are auxiliary only.
full rationale
The error metrics are defined with respect to the external CAD model, not fitted to the reported error values. Global-level error (Eq. 1) is point-to-CAD RMSE. Part-level error (Eq. 6) is the distance from fitted primitives to the CAD model. Feature-level error (Eq. 10) compares fitted circle radii and centroids with CAD ground truth. The primitive and circle fitting procedures operate on the scan geometry, not on the error tables, so no derived quantity is forced to equal an input by construction. The paper cites same-author works [22], [23], [31] for denoising and evaluation metrics, but these are auxiliary pipeline components and do not carry the central hierarchical-error-assessment claim. Section IV-D openly acknowledges the four-primitive limitation for B-spline/NURBS surfaces; this is a generality limitation, not a circularity. The part-level metric's insensitivity to non-primitive warps is a validity concern that would require ground-truth comparison, but it is not a case where the derived quantity equals an input by construction. Overall, the derivation chain is self-contained and externally anchored by the CAD reference model, with only minor non-load-bearing self-citations.
Assumptions & free parameters
free parameters (6)
- Energy weights (ωf, ωs, ωc) =
0.6, 0.25, 0.15
- Inlier distance threshold ϵ =
0.1
- Parameter variation threshold η =
0.03
- Maximum iteration count It =
150
- Tensor-voting Gaussian width σ =
0.5
- Edge point threshold Wi =
≥ 1.05
assumptions (4)
- domain assumption Aircraft CAD models consist only of planes, spheres, cylinders, and cones.
- domain assumption The geometric type of a primitive does not change after splitting or merging.
- domain assumption The point-to-CAD distance is a valid measure of manufacturing error.
- domain assumption The residual matrix of point-to-hypothesis distances captures circle membership.
Cite this review
Pith. "Pith review of Hierarchical Error Assessment of CAD Models for Aircraft Manufacturing-and-Measurement." pith.science (2026). https://pith.science/paper/4BCSJ5X5
@misc{pith2026250610594,
  author       = {Pith},
  title        = {Pith review of: Hierarchical Error Assessment of CAD Models for Aircraft Manufacturing-and-Measurement},
  year         = {2026},
  howpublished = {\url{https://pith.science/paper/4BCSJ5X5}},
  note         = {Machine review of arXiv:2506.10594}
}
read the original abstract
The most essential feature of aviation equipment is high quality, including high performance, high stability and high reliability. In this paper, we propose a novel hierarchical error assessment framework for aircraft CAD models within a manufacturing-and-measurement platform, termed HEA-MM. HEA-MM employs structured light scanners to obtain comprehensive 3D measurements of manufactured workpieces. The measured point cloud is registered with the reference CAD model, followed by an error analysis conducted at three hierarchical levels: global, part, and feature. At the global level, the error analysis evaluates the overall deviation of the scanned point cloud from the reference CAD model. At the part level, error analysis is performed on these patches underlying the point clouds. We propose a novel optimization-based primitive refinement method to obtain a set of meaningful patches of point clouds. Two basic operations, splitting and merging, are introduced to refine the coarse primitives. At the feature level, error analysis is performed on circular holes, which are commonly found in CAD models. To facilitate it, a two-stage algorithm is introduced for the detection of circular holes. First, edge points are identified using a tensor-voting algorithm. Then, multiple circles are fitted through a hypothesize-and-clusterize framework, ensuring accurate detection and analysis of the circular features. Experimental results on various aircraft CAD models demonstrate the effectiveness of our proposed method.
Figures


Figures from the paper (8 more)



Reference graph
Works this paper leans on
-
[1]
A critical look at the coordinate measuring tech- nique,
P. J. Swornowski, “A critical look at the coordinate measuring tech- nique,” Mechatronics, vol. 23, no. 1, pp. 80–93, 2013
work page 2013
-
[2]
N. Decker, Y . Wang, and Q. Huang, “Efficiently registering scan point clouds of 3d printed parts for shape accuracy assessment and modeling,” Journal of Manufacturing Systems , vol. 56, pp. 587–597, 2020
work page 2020
-
[3]
C. H. P. Nguyen and Y . Choi, “Comparison of point cloud data and 3d cad data for on-site dimensional inspection of industrial plant piping systems,” Automation in Construction , vol. 91, pp. 44–52, 2018
work page 2018
-
[4]
Plade: A plane- based descriptor for point cloud registration with small overlap,
S. Chen, L. Nan, R. Xia, J. Zhao, and P. Wonka, “Plade: A plane- based descriptor for point cloud registration with small overlap,” IEEE Transactions on Geoscience and Remote Sensing , vol. 58, no. 4, pp. 2530–2540, 2019
work page 2019
-
[5]
Q.-Y . Zhou, J. Park, and V . Koltun, “Fast global registration,” in Computer Vision–ECCV 2016: 14th European Conference, Part II 14 , 2016, pp. 766–782
work page 2016
-
[6]
Hybrid geometry sets for global registration of cross-source geometric data,
M. Li, S. Peng, and L. Nan, “Hybrid geometry sets for global registration of cross-source geometric data,” International Journal of Applied Earth Observation and Geoinformation , vol. 128, p. 103733, 2024
work page 2024
-
[7]
Deepvcp: An end-to-end deep neural network for point cloud registration,
W. Lu, G. Wan, Y . Zhou, X. Fu, P. Yuan, and S. Song, “Deepvcp: An end-to-end deep neural network for point cloud registration,” in IEEE/CVF international conference on computer vision , 2019, pp. 12– 21
work page 2019
-
[8]
Pcrnet: Point cloud registration network using pointnet encoding,
V . Sarode, X. Li, H. Goforth, Y . Aoki, R. A. Srivatsan, S. Lucey, and H. Choset, “Pcrnet: Point cloud registration network using pointnet encoding,” arXiv preprint arXiv:1908.07906 , 2019
arXiv 1908
Show all 31 references
-
[9]
Deep feature interac- tion network for point cloud registration, with applications to optical measurement of blade profiles,
M. Yin, Y . Zhu, G. Yin, G. Fu, and L. Xie, “Deep feature interac- tion network for point cloud registration, with applications to optical measurement of blade profiles,” IEEE Transactions on Industrial Infor- matics, 2022
2022
-
[10]
Imlovenet: Misaligned image-supported registration network for low-overlap point cloud pairs,
H. Chen, Z. Wei, Y . Xu, M. Wei, and J. Wang, “Imlovenet: Misaligned image-supported registration network for low-overlap point cloud pairs,” in ACM SIGGRAPH 2022 conference proceedings , 2022, pp. 1–9
2022
-
[11]
Random sample consensus: a paradigm for model fitting with applications to image analysis and automated cartography,
M. A. Fischler and R. C. Bolles, “Random sample consensus: a paradigm for model fitting with applications to image analysis and automated cartography,” Communications of the ACM, vol. 24, no. 6, pp. 381–395, 1981
1981
-
[12]
Efficient ransac for point-cloud shape detection,
R. Schnabel, R. Wahl, and R. Klein, “Efficient ransac for point-cloud shape detection,” in Computer graphics forum, vol. 26, no. 2, 2007, pp. 214–226
2007
-
[13]
Segmentation of point clouds using smoothness constraint,
T. Rabbani, F. Van Den Heuvel, and G. V osselmann, “Segmentation of point clouds using smoothness constraint,” International archives of photogrammetry, remote sensing and spatial information sciences , vol. 36, no. 5, pp. 248–253, 2006
2006
-
[14]
Finding good configurations of planar primitives in unorganized point clouds,
M. Yu and F. Lafarge, “Finding good configurations of planar primitives in unorganized point clouds,” in IEEE/CVF Conference on Computer Vision and Pattern Recognition (CVPR) , 2022, pp. 6367–6376
2022
-
[15]
Pointnet++: Deep hierarchical feature learning on point sets in a metric space,
C. R. Qi, L. Yi, H. Su, and L. J. Guibas, “Pointnet++: Deep hierarchical feature learning on point sets in a metric space,” Advances in neural information processing systems , vol. 30, 2017
2017
-
[16]
Surface and edge detection for primitive fitting of point clouds,
Y . Li, S. Liu, X. Yang, J. Guo, J. Guo, and Y . Guo, “Surface and edge detection for primitive fitting of point clouds,” in ACM SIGGRAPH 2023 Conference Proceedings, 2023, pp. 1–10
2023
-
[17]
An unequal deep learning approach for 3-d point cloud segmentation,
J. Wang, C. Xu, L. Dai, J. Zhang, and R. Zhong, “An unequal deep learning approach for 3-d point cloud segmentation,” IEEE Transactions on Industrial Informatics , vol. 17, no. 12, pp. 7913–7922, 2020
2020
-
[18]
Multiple model fitting as a set coverage prob- lem,
L. Magri and A. Fusiello, “Multiple model fitting as a set coverage prob- lem,” in IEEE conference on computer vision and pattern recognition , 2016, pp. 3318–3326
2016
-
[19]
Searching for representative modes on hypergraphs for robust geometric model fitting,
H. Wang, G. Xiao, Y . Yan, and D. Suter, “Searching for representative modes on hypergraphs for robust geometric model fitting,” IEEE trans- actions on pattern analysis and machine intelligence , vol. 41, no. 3, pp. 697–711, 2018
2018
-
[20]
Robust statistical ap- proaches for circle fitting in laser scanning three-dimensional point cloud data,
A. Nurunnabi, Y . Sadahiro, and D. F. Laefer, “Robust statistical ap- proaches for circle fitting in laser scanning three-dimensional point cloud data,” Pattern Recognition, vol. 81, pp. 417–431, 2018
2018
-
[21]
Shape detection from raw lidar data with subspace modeling,
J. Wang and K. Xu, “Shape detection from raw lidar data with subspace modeling,” IEEE transactions on visualization and computer graphics , vol. 23, no. 9, pp. 2137–2150, 2016
2016
-
[22]
Repcd-net: Feature-aware recurrent point cloud denoising network,
H. Chen, Z. Wei, X. Li, Y . Xu, M. Wei, and J. Wang, “Repcd-net: Feature-aware recurrent point cloud denoising network,” International Journal of Computer Vision , vol. 130, no. 3, pp. 615–629, 2022
2022
-
[23]
Multi-patch collabora- tive point cloud denoising via low-rank recovery with graph constraint,
H. Chen, M. Wei, Y . Sun, X. Xie, and J. Wang, “Multi-patch collabora- tive point cloud denoising via low-rank recovery with graph constraint,” IEEE transactions on visualization and computer graphics , vol. 26, no. 11, pp. 3255–3270, 2019
2019
-
[24]
Method for registration of 3-d shapes,
P. J. Besl and N. D. McKay, “Method for registration of 3-d shapes,” in Sensor fusion IV: control paradigms and data structures , vol. 1611, 1992, pp. 586–606
1992
-
[25]
Multi-scale tensor voting for feature extraction from unstructured point clouds,
M. K. Park, S. J. Lee, and K. H. Lee, “Multi-scale tensor voting for feature extraction from unstructured point clouds,” Graphical Models , vol. 74, no. 4, pp. 197–208, 2012
2012
-
[26]
Fitting multiple heterogeneous models by multi-class cascaded t-linkage,
L. Magri and A. Fusiello, “Fitting multiple heterogeneous models by multi-class cascaded t-linkage,” in IEEE/CVF Conference on Computer Vision and Pattern Recognition , 2019, pp. 7460–7468
2019
-
[27]
Mean shift: A robust approach toward feature space analysis,
D. Comaniciu and P. Meer, “Mean shift: A robust approach toward feature space analysis,” IEEE Transactions on pattern analysis and machine intelligence, vol. 24, no. 5, pp. 603–619, 2002
2002
-
[28]
Hpnet: Deep primitive segmentation using hybrid representations,
S. Yan, Z. Yang, C. Ma, H. Huang, E. V ouga, and Q. Huang, “Hpnet: Deep primitive segmentation using hybrid representations,” in IEEE/CVF International Conference on Computer Vision , 2021, pp. 2753–2762. JOURNAL OF LATEX CLASS FILES, VOL. 14, NO. 8, AUGUST 2021 9
2021
-
[29]
Abc: A big cad model dataset for geometric deep learning,
S. Koch, A. Matveev, Z. Jiang, F. Williams, A. Artemov, E. Burnaev, M. Alexa, D. Zorin, and D. Panozzo, “Abc: A big cad model dataset for geometric deep learning,” in IEEE/CVF conference on computer vision and pattern recognition , 2019, pp. 9601–9611
2019
-
[30]
Robust fitting of multiple structures: The statistical learning approach,
T.-J. Chin, H. Wang, and D. Suter, “Robust fitting of multiple structures: The statistical learning approach,” in IEEE International Conference on Computer Vision, 2009, pp. 413–420
2009
-
[31]
Aircraft seam feature extrac- tion from 3d raw point cloud via hierarchical multi-structure fitting,
J. Dai, M. Wei, Q. Xie, and J. Wang, “Aircraft seam feature extrac- tion from 3d raw point cloud via hierarchical multi-structure fitting,” Computer-Aided Design, vol. 130, p. 102945, 2021. This supplementary material presents additional experi- ments with (i) results of primi...
2021
Reviewed August 7, 2026 · model on record in the stance chip above.
Discussion (0). Continue with ORCID to comment.