REVIEW 4 major objections 5 minor 2 cited by
The ALMA Survey of Gas Evolution of PROtoplanetary Disks (AGE-PRO): IV. Dust and Gas Disk Properties in the Upper Scorpius Star-forming Region
T0 review · 4 major / 5 minor · reviewed 2026-08-07 · deepseek-v4-flash
Pith's one-line read CO gas abundance stays nearly constant through the Class II stage of disk evolution, while dust masses drop by an order of magnitude in 5–10 Myr old disks.
desk verdict Valuable new Upper Sco ALMA data, but the abstract's claims of stable CO abundance and comparable disk sizes outrun what the paper's own statistics and image-plane radii support. read the letter →
The pith
A machine-rendered reading of the paper's core claim, the machinery that carries it, and where it could break.
The reading
What carries the argument
The load-bearing mechanism is the C18O (2–1) versus N2H+ (3–2) flux–flux correlation. N2H+ forms where CO is absent and is destroyed by CO, so a fixed relation between these fluxes across regions of different age implies a fixed CO abundance in the warm molecular layer. The paper measures this correlation using a censored Kendall's τ test and compares the best-fit linear regression with the Lupus sample from Deng et al. (2025b). For disk sizes, the curve-of-growth (COG) method provides the R68 and R90 radii from the image plane, which are then compared with the deconvolved radii from visibility fitting.
What would settle it
If visibility fitting of the Band 6 continuum (as in Vioque et al. 2025) yields true dust radii that are substantially smaller than the image-plane R68 values, the radial-drift-halted interpretation fails. Alternatively, a thermochemical model of these specific disks that reproduces the observed C18O and N2H+ fluxes with a strongly varying CO abundance would falsify the constant-CO claim.
Extended reading notes
Core claim
The central claim is that the CO gas abundance does not evolve significantly between roughly 1–3 Myr and 5–10 Myr in Class II disks. Because N2H+ is destroyed by reactions with gaseous CO, the ratio of C18O to N2H+ emission constrains the CO abundance, and the C18O–N2H+ flux correlation in Upper Sco falls on the same line as in Lupus. The paper therefore concludes that the lower dust masses and lower CO fluxes in the older region reflect genuine depletion of the disk material, not a chemical masking of gas. This is paired with the finding that dust disk radii in the image plane are comparable to or larger than in Lupus, which the authors interpret as evidence that dust trapping halts the expected inward drift of grains.
Load-bearing premise
The conclusion that dust radii in Upper Sco are comparable to or larger than in Lupus, and hence that dust is trapped, assumes that the image-plane R68 radii are not systematically inflated by the beam for the many unresolved or marginally resolved disks.
Editorial extensions
If this is right
- Gas disk masses inferred from CO in 5–10 Myr old disks are not systematically biased by varying CO depletion, so the observed gas deficit is real.
- The combination of declining dust mass and non-shrinking dust radius points to dust traps that hold millimeter grains at large radii, preserving pebble reservoirs for late planet formation.
- The increased scatter in the CO-versus-continuum correlations in Upper Sco compared with Lupus suggests either an age spread within the region or disk-to-disk variations in CO abundance or gas-to-dust ratio.
- Higher-resolution imaging should directly test the dust-trap scenario; confirmation would establish dust trapping as a primary mechanism of disk evolution in older regions.
Reading between the lines
- If CO abundance is truly constant across the Class II phase, C18O-based gas mass estimates at intermediate ages could be calibrated against N2H+ without invoking evolution of CO depletion, a generalization the paper itself does not fully claim beyond its two regions.
- The paper's dust-radius conclusion rests on image-plane R68 values that are beam-dominated for seven of ten disks, so the companion visibility-fitting analysis is the natural decisive test of the radial-drift-halted interpretation.
- A testable extension is to apply the same C18O–N2H+ analysis to a region of intermediate age, to see whether the correlation line shifts gradually or abruptly and thereby distinguish smooth CO abundance evolution from a step change.
Signed reviews
Editorial analysis
A structured set of objections, weighed in public.
Referee Report
Summary. This paper presents ALMA Band 6 and 7 observations of ten Class II disks in Upper Scorpius from the AGE-PRO large program. The authors measure dust continuum fluxes and spectral indices, dust masses under standard optically thin assumptions, image-plane COG radii for gas and dust, and CO isotopologue and N2H+ line fluxes. The main empirical results are that Upper Sco dust masses are roughly an order of magnitude lower than in Lupus/Ophiuchus, gas and dust radii appear comparable to or larger than Lupus, and the C18O–N2H+ flux correlation looks similar to the younger Lupus sample. The paper interprets these findings as evidence for dust evolution, radial drift halting or dust trapping, and a nearly constant CO abundance across the Class II phase. Much of the detailed modeling and deconvolved size work is deferred to companion AGE-PRO papers.
Significance. If the conclusions hold, this is a valuable contribution: it extends a standardized, multi-tracer ALMA survey to an intermediate-age region, provides homogeneous flux and size measurements for a sparse but important sample, and places empirical constraints on gas and dust evolution between ~1–3 Myr and ~5–10 Myr. The paper's strength is its careful presentation of the observational material, the explicit comparison with the Lupus AGE-PRO sample, and the candid statement of resolution limitations in Appendix D. The most novel claim, constant CO abundance over the Class II stage, is interesting but is not fully established by the in-paper analysis; the supporting statistical and modeling steps need to be made reproducible and quantitative before the claim can be regarded as load-bearing.
major comments (4)
- [§4.3, Table 4, Figure 11 caption] The N2H+ detection set is internally inconsistent. The text in §4.3 states that N2H+(3–2) is detected in four disks (USco 1, 7, 9, 10) with SNR > 5σ and that the rest are nondetections, but Table 4 lists USco 8 at 27.3 ± 4 mJy km s−1, which is about 6.8σ, and USco 6 at 7.8 ± 3 mJy km s−1, about 2.6σ. The Figure 11 caption, in contrast, says that only USco 3, 4, and 5 are nondetections. This ambiguity makes the censored Kendall-τ analysis impossible to reproduce and directly affects the claimed C18O–N2H+ correlation, since including or excluding USco 8 and USco 6 changes the censoring pattern and the correlation strength. The authors should state explicitly which sources are detections, which are upper limits, and which are excluded, and rerun the correlation with that census.
- [§5.4, Figure 11, bottom-right panel] The claim that the Upper Sco and Lupus C18O–N2H+ correlations are indistinguishable rests on a visual comparison of two regression lines, not on a formal test. No slope or intercept uncertainties are quoted for the Upper Sco fit, no joint censored regression is presented, and no test of whether the two data sets are drawn from the same relation is performed. With p ≈ 4% for the Upper Sco correlation and a small number of detections, the evidence is weak; a bootstrap or likelihood-ratio comparison between the Lupus and Upper Sco relations is needed before the word "indistinguishable" is used.
- [§5.3, §5.4, Summary point 5] The interpretive step from an unchanged C18O–N2H+ flux–flux trend to a constant CO abundance is not demonstrated. As the paper itself notes in §5.3, a positive C18O–N2H+ correlation is the expected signature of a spread in gas mass at fixed XCO, and correlated changes in gas surface density, disk size, excitation, or dust temperature could mask an age-dependent CO abundance. No thermochemical fit that marginalizes over these nuisance parameters is reported in this paper; the correlation is therefore consistent with, but does not establish, constant CO abundance. Summary point 5 and the abstract should either be weakened or explicitly cite the companion modeling paper (L. Trapman et al. 2025b) as the source of the quantitative inference.
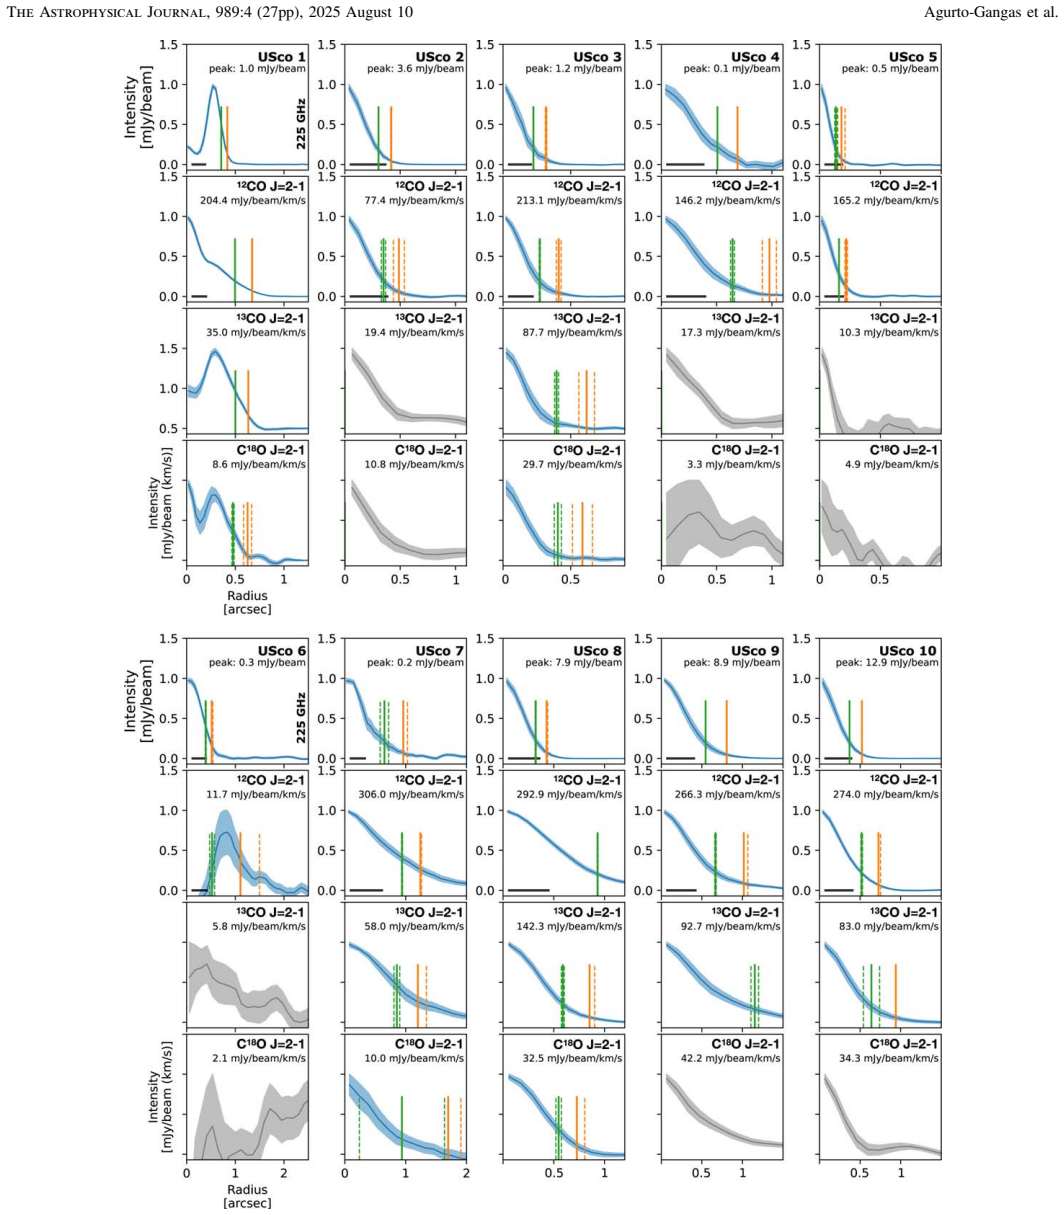
- [§5.1, Figure 10, Table 5, Appendix D] The size comparison that supports the dust-trapping interpretation is based on image-plane COG radii that Appendix D admits are overestimated for all but USco 1. Figure 10 places all Upper Sco disks outside the drift-dominated region using these beam-limited R68 and R90 values, and Summary point 3 repeats the claim that dust disk sizes are comparable to or larger than Lupus. For the seven or eight unresolved or marginally resolved disks, the image-plane radii are dominated by beam smearing, so the empirical conclusion does not follow from this paper's own measurements. The main text should either plot the deconvolved/visibility radii from M. Vioque et al. (2025) and L. Trapman et al. (2025a) in Figure 10, or add an explicit caveat in the abstract and summary that the size comparison is only secure for USco 1 and otherwise relies on companion visibility fitting.
minor comments (5)
- [Table 6] The dust masses are listed without uncertainties or error bars; given that the dust mass formula in Eq. (1) depends on the assumed Tdust and κν, at minimum the adopted fixed values and an estimate of the systematic uncertainty should be stated in the table notes or text.
- [Appendix E] The text "3σ < flux < σ" appears to be a typo; it should read "3σ < flux < 5σ".
- [§5.3] The sentence "As seen in the bottom-right panel of Figure 7" refers to the flux–flux comparison, which is actually shown in Figure 11; the figure number appears to be a typo.
- [Abstract and Summary] The abstract's statement that disk radii are comparable to those in Lupus should be qualified as image-plane, beam-affected measurements, consistent with the acknowledgment in Appendix D that these values are overestimated for most sources.
- [Figure 11 caption] The caption's statement that only USco 3, 4, and 5 are N2H+ nondetections conflicts with the text in §4.3; the caption and the text should be made consistent after the detection census is clarified.
Circularity Check
No significant circularity: the paper's conclusions rest on new ALMA measurements and external modeling, not on inputs redefined as predictions.
full rationale
The derivation chain is not circular. Fluxes, radii, masses, and spectral indices are measured from the new ALMA data using the COG method; no parameter is fitted to a subset of these data and then reported as a prediction of a closely related quantity. The central 'constant CO abundance' claim (Summary point 5) is an empirical statement that the C18O-N2H+ flux correlation in Upper Sco matches the Lupus correlation, with the sign/direction interpretation taken from prior thermochemical modeling (Trapman et al. 2022). That modeling is parameter-free with respect to the present data and does not use the Upper Sco fluxes as inputs, so citing it is independent support rather than circular self-citation. The Lupus comparison uses measured fluxes from the companion AGE-PRO paper (Deng et al. 2025b), again an external data benchmark. The weakest point identified by the reader, that image-plane R68 radii are beam-overestimated for unresolved disks, is explicitly acknowledged in Appendix D ('the radii measured in the image plane are strongly affected by the beam smearing, and hence are overestimated'); this is a measurement-limitation and correctness caveat, not a circular step. The skeptical concerns about detection counting and the absence of a formal slope comparison are statistical robustness issues, not circularity. No equation in the paper is equivalent to its input, and no self-citation is used to forbid alternatives.
Assumptions & free parameters
free parameters (3)
- Average dust temperature Tdust =
20 K
- Dust opacity kappa_nu =
2.3 (nu/230 GHz) cm2/g
- Absolute flux uncertainty =
10%
assumptions (5)
- domain assumption Dust continuum emission at 1.3 mm is optically thin.
- domain assumption C18O (2-1) and N2H+ (3-2) fluxes trace the CO abundance and gas mass as described by Trapman et al. (2022).
- domain assumption COG method gives unbiased total fluxes and radii for faint, partially resolved sources.
- domain assumption Stellar evolutionary tracks (Baraffe et al. 2015, Feiden 2016) and the Bayesian method (Pascucci et al. 2016) give reliable ages and masses.
- domain assumption The 10-disk sample is representative of the Upper Sco full disk population around M3-M4.5 to K6 stars.
Cite this review
Pith. "Pith review of The ALMA Survey of Gas Evolution of PROtoplanetary Disks (AGE-PRO): IV. Dust and Gas Disk Properties in the Upper Scorpius Star-forming Region." pith.science (2026). https://pith.science/paper/ZDAA76BX
@misc{pith2026250610735,
  author       = {Pith},
  title        = {Pith review of: The ALMA Survey of Gas Evolution of PROtoplanetary Disks (AGE-PRO): IV. Dust and Gas Disk Properties in the Upper Scorpius Star-forming Region},
  year         = {2026},
  howpublished = {\url{https://pith.science/paper/ZDAA76BX}},
  note         = {Machine review of arXiv:2506.10735}
}
abstract
The Atacama Large Millimeter/submillimeter Array (ALMA) large program AGE-PRO explores protoplanetary disk evolution by studying gas and dust across various ages. This work focuses on ten evolved disks in Upper Scorpius, observed in dust continuum emission, CO and its isotopologues, and N$_2$H$^+$ with ALMA Bands 6 and 7. Disk radii, from the radial location enclosing 68% of the flux, are comparable to those in the younger Lupus region for both gas and dust tracers. However, solid masses are about an order of magnitude below those in Lupus and Ophiuchus, while the dust spectral index suggests some level of dust evolution. These empirical findings align with a combination of radial drift, dust trapping, and grain growth into larger bodies. A moderate correlation between CO and continuum fluxes suggests a link between gas and dust content, through the increased scatter compared to younger regions, possibly due to age variations, gas-to-dust ratio differences, or CO depletion. Additionally, the correlation between C$^{18}$O and N$_2$H$^+$ fluxes observed in Lupus persists in Upper Sco, indicating a relatively stable CO gas abundance over the Class II stage of disk evolution. In conclusion, the AGE-PRO survey of Upper Scorpius disks reveals intriguing trends in disk evolution. The findings point towards potential gas evolution and the presence of dust traps in these older disks. Future high-resolution observations are needed to confirm these possibilities and further refine our understanding of disk evolution and planet formation in older environments.
Figures


Figures from the paper (8 more)




Forward citations
Cited by 2 Pith papers
-
JWST/MIRI Reveals the Evolution from Molecular to Atomic Disk Winds
Across 72 protoplanetary disks, JWST shows atomic jets and molecular winds dominate at high accretion rates and give way to predominantly atomic winds as accretion declines.
-
Angular Momentum of Planet-Forming Disks: Implications for Infall Driven Misalignments
Most planet-forming disks have less angular momentum than late-infalling cloud gas is predicted to carry, so infalling streamers are a plausible cause of the observed misalignments.
Reference graph
Works this paper leans on
-
[1]
2025, ApJ, 989, 8
Anania, R., Rosotti, G., Gárate, M., et al. 2025, ApJ, 989, 8
2025
-
[2]
E., Blake, G
Anderson, D. E., Blake, G. A., Bergin, E. A., et al. 2019, ApJ, 881, 127
2019
-
[3]
M., Huang, J., Pérez, L
Andrews, S. M., Huang, J., Pérez, L. M., et al. 2018, ApJL, 869, L41
2018
-
[4]
M., Rosenfeld, K
Andrews, S. M., Rosenfeld, K. A., Kraus, A. L., & Wilner, D. J. 2013, ApJ, 771, 129
2013
-
[5]
Ansdell, M., Williams, J. P., Trapman, L., et al. 2018, ApJ, 859, 21
work page 2018
-
[6]
Ansdell, M., Williams, J. P., van der Marel, N., et al. 2016, ApJ, 828, 46
work page 2016
-
[7]
2023, A&A, 673, A139 Astropy Collaboration, Price-Whelan, A
Appelgren, J., Lambrechts, M., & van der Marel, N. 2023, A&A, 673, A139 Astropy Collaboration, Price-Whelan, A. M., Sip őcz, B. M., et al. 2018, AJ, 156, 123 Figure F5. Channel maps of the CO (J = 2–1) emission in the USco 9 (top) and 10 (bottom) disks. 26 The Astrophysical Journal, 989:4 (27pp), 2025 August 10 Agurto-Gangas et al. Astropy Collaboration, ...
work page 2023
-
[8]
2015, A&A, 577, A42
Baraffe, I., Homeier, D., Allard, F., & Chabrier, G. 2015, A&A, 577, A42
2015
Show all 83 references
-
[9]
2017, extinction v0.3.0, Zenodo, doi: 10.5281/zenodo.804967
Barbary, K. 2017, extinction v0.3.0, Zenodo, doi: 10.5281/zenodo.804967
2017 doi
-
[10]
A., Carpenter, J
Barenfeld, S. A., Carpenter, J. M., Ricci, L., & Isella, A. 2016, ApJ, 827, 142
2016
-
[11]
A., Carpenter, J
Barenfeld, S. A., Carpenter, J. M., Sargent, A. I., Isella, A., & Ricci, L. 2017, ApJ, 851, 85
2017
-
[12]
A., Carpenter, J
Barenfeld, S. A., Carpenter, J. M., Sargent, A. I., et al. 2019, ApJ, 878, 45
2019
-
[13]
A., Cleeves, L
Bergin, E. A., Cleeves, L. I., Gorti, U., et al. 2013, Natur, 493, 644
2013
-
[14]
B., Öberg, K
Bergner, J. B., Öberg, K. I., Bergin, E. A., et al. 2020, ApJ, 898, 97
2020
-
[15]
A., Clayton, G
Cardelli, J. A., Clayton, G. C., & Mathis, J. S. 1989, ApJ, 345, 245
1989
-
[16]
Andrews, S. M. 2025, ApJ, 978, 117
2025
-
[17]
M., Mamajek, E
Carpenter, J. M., Mamajek, E. E., Hillenbrand, L. A., & Meyer, M. R. 2009, ApJ, 705, 1646
2009
-
[18]
M., Ricci, L., & Isella, A
Carpenter, J. M., Ricci, L., & Isella, A. 2014, ApJ, 787, 42
2014
-
[19]
W., & Tobin, J
Chiang, H.-F., Looney, L. W., & Tobin, J. J. 2012, ApJ, 756, 168
2012
-
[20]
A., Ruíz-Rodríguez, D., Hales, A., et al
Cieza, L. A., Ruíz-Rodríguez, D., Hales, A., et al. 2019, MNRAS, 482 698
2019
-
[21]
A., Swift, J
Cieza, L. A., Swift, J. J., Mathews, G. S., & Williams, J. P. 2008, ApJL, 686, L115
2008
-
[22]
M., Skrutskie, M
Cutri, R. M., Skrutskie, M. F., van Dyk, S., et al. 2003, yCat, 2246, 0 de Geus, E. J., de Zeeuw, P. T., & Lub, J. 1989, A&A, 216, 44
2003
-
[23]
2023, ApJ, 954, 165
Deng, D., Ruaud, M., Gorti, U., & Pascucci, I. 2023, ApJ, 954, 165
2023
-
[24]
2025b, ApJ, 989, 3 DENIS Consortium 2005, yCat, 2263, 0
Deng, D., Vioque, M., Pascucci, I., et al. 2025b, ApJ, 989, 3 DENIS Consortium 2005, yCat, 2263, 0
2005
-
[25]
Evans, N. J. I., Allen, L. E., Blake, G. A., et al. 2003, PASP, 115, 965
2003
-
[26]
2023, ApJ, 945, 112
Fang, M., Pascucci, I., Edwards, S., et al. 2023, ApJ, 945, 112
2023
-
[27]
I., Bergin, E
Favre, C., Cleeves, L. I., Bergin, E. A., Qi, C., & Blake, G. A. 2013, ApJL, 776, L38
2013
-
[28]
Feiden, G. A. 2016, A&A, 593, A99 Gaia Collaboration, Brown, A. G. A., Vallenari, A., et al. 2018, A&A, 616, A1 Gaia Collaboration, Brown, A. G. A., Vallenari, A., et al. 2021, A&A, 649, A1
2016
-
[29]
2001, AJ, 121, 1030
Hartmann, L. 2001, AJ, 121, 1030
2001
-
[30]
A., Levine, S., Terrell, D., & Welch, D
Henden, A. A., Levine, S., Terrell, D., & Welch, D. L. 2015, AAS Meeting, 225, 336.16
2015
-
[31]
2020, ApJ, 895, 126
Hendler, N., Pascucci, I., Pinilla, P., et al. 2020, ApJ, 895, 126
2020
-
[32]
Hunter, J. D. 2007, CSE, 9, 90
2007
-
[33]
O., Wende-von Berg, S., Dreizler, S., et al
Husser, T. O., Wende-von Berg, S., Dreizler, S., et al. 2013, A&A, 553, A6
2013
-
[34]
D., & Nelson, P
Isobe, T., Feigelson, E. D., & Nelson, P. I. 1986, ApJ, 306, 490
1986
-
[35]
D., Zhang, K., et al
Krijt, S., Bosman, A. D., Zhang, K., et al. 2020, ApJ, 899, 134
2020
-
[36]
V., Kholopov, P
Kukarkin, B. V., Kholopov, P. N., Pskovsky, Y. P., et al. 1971, General Catalogue of Variable Stars (3rd ed.; Moscow: Sternberg State Astronomical Inst. of the Moscow State Univ. )
1971
-
[37]
T., Gárate, M., Pinilla, P., et al
Kurtovic, N. T., Gárate, M., Pinilla, P., et al. 2025, ApJ, 989, 6
2025
-
[38]
M., Lattanzi, M
Lasker, B. M., Lattanzi, M. G., McLean, B. J., et al. 2008, AJ, 136, 735
2008
-
[39]
Luhman, K. L. 2022, AJ, 163, 24
2022
-
[40]
L., & Esplin, T
Luhman, K. L., & Esplin, T. L. 2020, AJ, 160, 44
2020
-
[41]
Pecaut, M. J. 2019, VizieR On-line Data Catalog: J /AJ/156/76,
2019
-
[42]
L., & Mamajek, E
Luhman, K. L., & Mamajek, E. E. 2012, ApJ, 758, 31
2012
-
[43]
F., Ansdell, M., Rosotti, G
Manara, C. F., Ansdell, M., Rosotti, G. P., et al. 2023, in ASP Conf. Ser. 534, Protostars and Planets VII, ed. S. Inutsuka et al. (San Francisco, CA: ASP), 539
2023
-
[44]
F., Natta, A., Rosotti, G
Manara, C. F., Natta, A., Rosotti, G. P., et al. 2020, A&A, 639, A58
2020
-
[45]
S., Pinte, C., Duchêne, G., Williams, J
Mathews, G. S., Pinte, C., Duchêne, G., Williams, J. P., & Ménard, F. 2013, A&A, 558, A66
2013
-
[46]
K., Bergin, E
McClure, M. K., Bergin, E. A., Cleeves, L. I., et al. 2016, ApJ, 831, 167
2016
-
[47]
M., Pérez, L
Miley, J. M., Pérez, L. M., Agurto-Gangas, C., et al. 2025, ApJ, 989, 11
2025
-
[48]
F., Kama, M., & Bruderer, S
Miotello, A., van Dishoeck, E. F., Kama, M., & Bruderer, S. 2016, A&A, 594, A85
2016
-
[49]
2007, in Protostars and Planets V, ed
Natta, A., Testi, L., Calvet, N., et al. 2007, in Protostars and Planets V, ed. B. Reipurth, D. Jewitt, & K. Keil (Tucson, AZ: Univ. Arizona Press ), 767 Öberg, K. I., & Bergin, E. A. 2016, ApJL, 831, L19 Öberg, K. I., Guzmán, V. V., Walsh, C., et al. 2021, ApJS, 257, 1
2007
-
[50]
N., Deng, D., et al
Pascucci, I., Skinner, B. N., Deng, D., et al. 2023, ApJ, 953, 183
2023
-
[51]
J., et al
Pascucci, I., Testi, L., Herczeg, G. J., et al. 2016, ApJ, 831, 125
2016
-
[52]
J., & Mamajek, E
Pecaut, M. J., & Mamajek, E. E. 2013, ApJS, 208, 9
2013
-
[53]
J., Mamajek, E
Pecaut, M. J., Mamajek, E. E., & Bubar, E. J. 2012, ApJ, 746, 154
2012
-
[54]
I., Bergner, J
Pegues, J., Öberg, K. I., Bergner, J. B., et al. 2020, ApJ, 890, 142
2020
-
[55]
2020, A&A, 635, A105 Planck Collaboration, Abergel, A., Ade, P
Pinilla, P., Pascucci, I., & Marino, S. 2020, A&A, 635, A105 Planck Collaboration, Abergel, A., Ade, P. A. R., et al. 2014, A&A, 571, A11
2020
-
[56]
Preibisch, T., Brown, A. G. A., Bridges, T., Guenther, E., & Zinnecker, H. 2002, AJ, 124, 404
2002
-
[57]
Pringle, J. E. 1981, ARA&A, 19, 137 Ratzenböck, S., Großschedl, J. E., Alves, J., et al. 2023, A&A, 678, A71
1981
-
[58]
2019, ApJ, 885, 146
Ruaud, M., & Gorti, U. 2019, ApJ, 885, 146
2019
-
[59]
Ruaud, M., Gorti, U., & Hollenbach, D. J. 2022, ApJ, 925, 49
2022
-
[60]
A., González-Ruilova, C., Cieza, L
Ruiz-Rodriguez, D. A., González-Ruilova, C., Cieza, L. A., et al. 2025,ApJ, 989, 2
2025
-
[61]
2021, A&A, 649, A19
Sanchis, E., Testi, L., Natta, A., et al. 2021, A&A, 649, A19
2021
-
[62]
F., Barenfeld, S
Scaringi, S., Manara, C. F., Barenfeld, S. A., et al. 2016, MNRAS, 463, 2265
2016
-
[63]
M., Agurto-Gangas, C., et al
Sierra, A., Pérez, L. M., Agurto-Gangas, C., et al. 2024, AJ, 974, id.102
2024
-
[64]
F., Cutri, R
Skrutskie, M. F., Cutri, R. M., Stiening, R., et al. 2006, AJ, 131, 1163
2006
-
[65]
G., Oelkers, R
Stassun, K. G., Oelkers, R. J., Paegert, M., et al. 2019, AJ, 158, 138
2019
-
[66]
Sullivan, K., & Kraus, A. L. 2021, ApJ, 912, 137
2021
-
[67]
K., Ogihara, M., Morbidelli, A., Crida, A., & Guillot, T
Suzuki, T. K., Ogihara, M., Morbidelli, A., Crida, A., & Guillot, T. 2016, A&A, 596, A74
2016
-
[68]
P., Lodato, G., et al
Tabone, B., Rosotti, G. P., Lodato, G., et al. 2022, MNRAS, 512, L74
2022
-
[69]
P., Trapman, L., et al
Tabone, B., Rosotti, G. P., Trapman, L., et al. 2025, ApJ, 989, 7
2025
-
[70]
2019, JOSS, 4, 1632
Teague, R. 2019, JOSS, 4, 1632
2019
-
[71]
2020, richteague /keplerian_mask: Initial Release, Version 1.0, Zenodo, doi: 10.5281/zenodo.4321137
Teague, R. 2020, richteague /keplerian_mask: Initial Release, Version 1.0, Zenodo, doi: 10.5281/zenodo.4321137
2020 doi
-
[72]
2014, in Protostars and Planets VI, ed
Testi, L., Birnstiel, T., Ricci, L., et al. 2014, in Protostars and Planets VI, ed. H. Beuther et al. (Tucson, AZ: Univ. Arizona Press ), 339
2014
-
[73]
F., et al
Testi, L., Natta, A., Manara, C. F., et al. 2022, A&A, 663, A98
2022
-
[74]
The, P. S. 1964, PASP, 76, 293
1964
-
[75]
2021, MNRAS, 507, 818
Toci, C., Rosotti, G., Lodato, G., Testi, L., & Trapman, L. 2021, MNRAS, 507, 818
2021
-
[76]
R., et al
Trapman, L., Ansdell, M., Hogerheijde, M. R., et al. 2020, A&A, 638, A38
2020
-
[77]
2019, A&A, 629, A79
Bruderer, S. 2019, A&A, 629, A79
2019
-
[78]
Bergin, E. A. 2022, ApJL, 926, L2 van der Marel, N., & Mulders, G. D. 2021, AJ, 162, 28
2022
-
[79]
T., Trapman, L., et al
Vioque, M., Kurtovic, N. T., Trapman, L., et al. 2025, ApJ, 989, 9
2025
-
[80]
E., et al
Virtanen, P., Gommers, R., Oliphant, T. E., et al. 2020, NatMe, 17, 261
2020
-
[81]
M., Liu, H
Yen, H.-W., Koch, P. M., Liu, H. B., et al. 2016, ApJ, 832, 204
2016
-
[82]
M., Pascucci, I., et al
Zhang, K., Pérez, L. M., Pascucci, I., et al. 2025, ApJ, 989, 1
2025
-
[83]
R., & Bergin, E
Zhang, K., Schwarz, K. R., & Bergin, E. A. 2020, ApJL, 891, L17 27 The Astrophysical Journal, 989:4 (27pp), 2025 August 10 Agurto-Gangas et al
2020
Reviewed August 7, 2026 · model on record in the stance chip above.
Discussion (0). Continue with ORCID to comment.