REVIEW 4 major objections 5 minor 55 references
Hubble's Multi-Year Search for Exospheres in the TRAPPIST-1 System Reveals Frequent Microflares
T0 review · 4 major / 5 minor · reviewed 2026-08-07 · deepseek-v4-flash
Pith's one-line read A five-year Hubble campaign finds no TRAPPIST-1 exospheres, and identifies the noise floor as frequent microflares.
desk verdict Solid non-detection and rotation period, but the microflare statistics and the abstract's escape-rate limit need tightening before the quantitative claims stand. read the letter →
The pith
A machine-rendered reading of the paper's core claim, the machinery that carries it, and where it could break.
The reading
What carries the argument
The load-bearing tool is the TIME-TAG mode of STIS, which records each detected photon's arrival time; it lets the authors look inside the $\sim 45$-minute orbit and catch count-rate spikes that orbit-averaged photometry would smear out. They use the bright geocoronal airglow as a simultaneous reference to reject instrumental artifacts. The second mechanism is a waiting-time pairing rule taken from prior flare studies: flares of similar cadence are assumed to share an emission mechanism, so a Lyman-$\alpha$ event and a $g'$-band event of the same waiting time can be combined and fit by a one-component blackbody, yielding the flare temperature and filling factor. The third mechanism is a Lomb-Scargle periodogram applied to the multi-year, orbit-averaged Lyman-$\alpha$ fluxes, which recovers the stellar rotation period.
What would settle it
Simultaneous HST/STIS Lyman-$\alpha$ and VLT g'-band monitoring of TRAPPIST-1 would settle it: if the 300-500 percent Lyman-$\alpha$ bursts do not coincide with the few-percent g'-band brightenings predicted by an $11000$ K, $0.011\%$ filling-factor blackbody, the inferred microflare properties are wrong.
Extended reading notes
Core claim
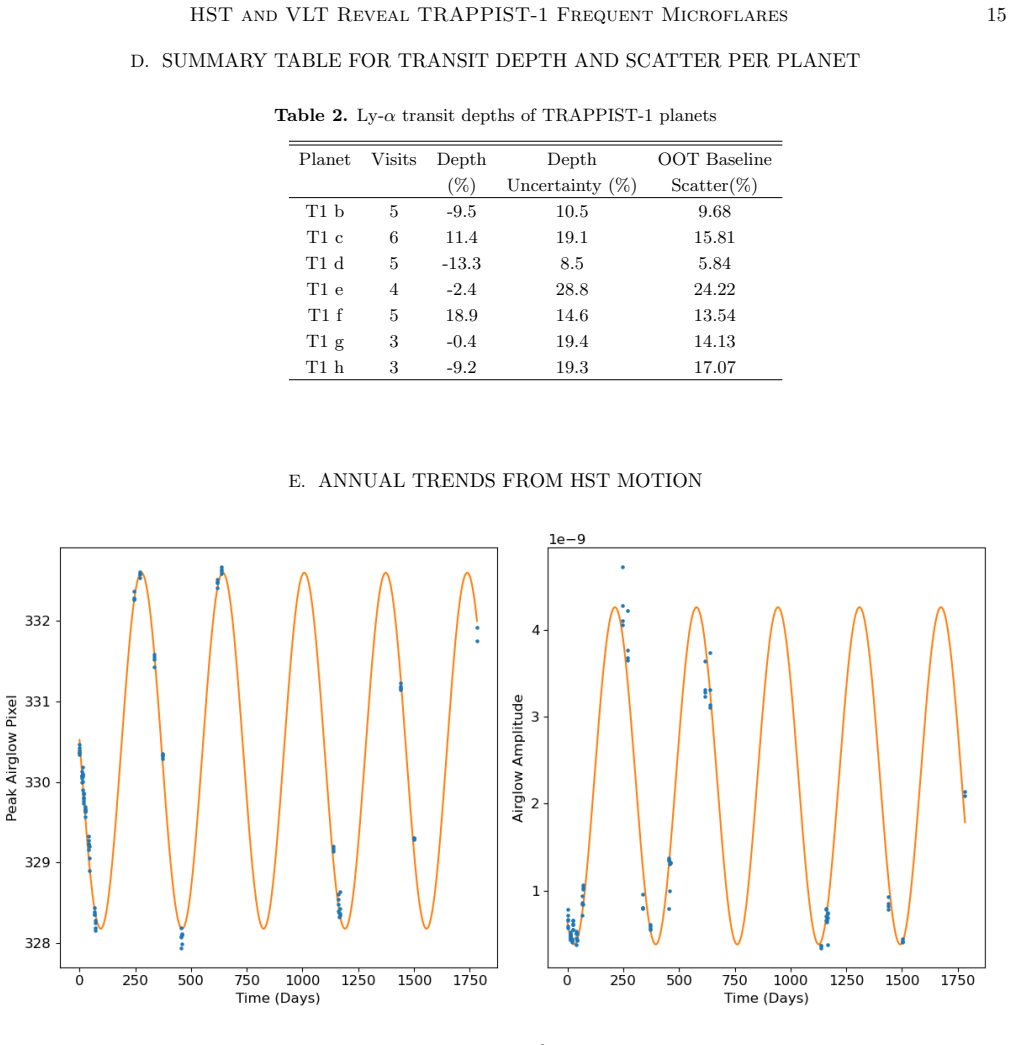
On the paper's own terms, TRAPPIST-1's Lyman-$\alpha$ line is so intrinsically variable that the star sets the measurement floor. In 104 HST/STIS orbits (24 visits) covering three to five transits per planet, none of the seven planets shows a statistically significant transit; the data exclude depths $\gtrsim 20\%$ at $5\sigma$, place $2\sigma$ upper limits near $30\%$, and give an escape-rate upper limit of about $1064\ \mathrm{EO_H}/\mathrm{Gyr}$ for planet b under the adopted XUV cross-section. The out-of-transit scatter is three to five times the photon-noise expectation, and STIS TIME-TAG data resolve it into count-rate increases of 300-500 percent on sub-hour timescales, about three per high-signal visit. VLT/FORS2 $g'$-band photometry independently shows one to two flares per hour with amplitudes up to 50 percent. Pairing a $\sim 400\%$ Lyman-$\alpha$ enhancement with a $\sim 4\%$ $g'$-band enhancement of similar waiting time, the paper solves a one-component blackbody to obtain a flare temperature of $11000^{+4200}_{-3100}$ K and a filling factor of $0.011^{+0.03}_{-0.01}\%$ of the stellar disk. A periodogram of the multi-year baseline gives $P = 3.27 \pm 0.04$ days, matching the previously reported 3.295-day rotation period.
Load-bearing premise
The flare temperature and filling factor rest on the assumption that a Lyman-alpha flare and a g-band flare with similar waiting times are the same kind of event, so their amplitudes can be combined in a single blackbody model; if the two bands see different flare populations, the 11000 K and 0.011 percent values do not follow.
Editorial extensions
If this is right
- For TRAPPIST-1, HST/STIS Lyman-alpha transit spectroscopy is now sensitivity-limited: exospheres producing transits shallower than roughly 20 percent cannot be detected, so null results do not prove the planets lack atmospheres.
- The escape-rate upper limit near $1064\ \mathrm{EO_H}/\mathrm{Gyr}$ for planet b supports the emerging picture that planet b is airless or has already lost its hydrogen reservoir.
- TRAPPIST-1 flares extend down to about $10^{29}$ erg with sub-hour cadence, a decade below the $\sim 10^{30}$-erg flares seen every $\sim 6$ hours by JWST, so microflares are a persistent part of this star's ultraviolet environment.
- The inferred flare temperature near $11000$ K and filling factor of about $0.011\%$ place the microflares inside the usual range for solar and stellar flares.
- The $3.27 \pm 0.04$ day periodicity in Lyman-alpha flux independently confirms the 3.295-day rotation period, implying that ultraviolet activity is rotationally modulated.
Reading between the lines
- If microflares are as frequent as reported, the time-averaged XUV irradiation of the TRAPPIST-1 planets may exceed the quiescent value used in the escape model, making the derived water-loss upper limits conservative in the sense that true losses could be higher.
- The same TIME-TAG analysis could be applied to archival STIS observations of other M dwarfs; the paper's method implies that the noise floor for exosphere searches is set by stellar microvariability rather than detector performance.
- A direct test of the 11000 K inference would be simultaneous far-ultraviolet and g-band monitoring; if the strong Lyman-alpha bursts do not coincide with weak g-band brightenings at the expected amplitude ratio, the waiting-time pairing assumption would need revision.
- If flare triggering is tied to the 3.27-day rotation, the microflare rate should vary with rotational phase, a prediction that could be checked by folding the TIME-TAG flare candidates on the recovered period.
Editorial analysis
A structured set of objections, weighed in public.
Referee Report
Summary. This paper presents 104 orbits of HST/STIS G140M Ly-α monitoring of TRAPPIST-1 from 2017 to 2022, with 3–6 transits per planet. Using PSF fitting, the authors derive Ly-α light curves, rule out transit depths ≳20% at 5σ, and convert the non-detections into escape-rate upper limits, reporting 1064 Earth-ocean-equivalent hydrogen per Gyr for planet b under an assumed XUV cross-section. The paper further attributes the excess baseline scatter to frequent microflares, reporting sub-hour Ly-α count-rate enhancements in STIS TIME-TAG data and 1–2 flares/hour in VLT/FORS2 g-band photometry. From paired Ly-α and optical amplitudes it derives a flare temperature of 11000 K and a filling factor of 0.011%, and it reports a 3.27 ± 0.04 day rotation period consistent with the known 3.295-day period.
Significance. If the microflare interpretation holds, this is an important result for UV exosphere searches: stellar microvariability, not photon noise, sets the practical detection limit for Ly-α transits around active M dwarfs. The underlying dataset is substantial and publicly available, and the transit non-detections and rotation-period recovery are valuable independent constraints: the rotation period is checked against the external K2 value and passes an injection–recovery test, and the 20% transit-depth limits are directly supported by the light curves. The flare temperature and filling factor, however, rest on a chain of assumptions that the manuscript does not yet quantitatively justify, so the significance of the microflare characterization is currently conditional.
major comments (4)
- [Section 3.2] The TIME-TAG flare detection criterion is never specified. The text states that candidates are epochs where the count rate 'significantly exceeded the baseline trend,' but no threshold, signal-to-noise requirement, false-alarm rate, or candidate table is provided. The only systematic check is the absence of a concurrent airglow spike and an orbit-integrated correlation coefficient <0.5 with background/airglow; that check does not address time-resolved PSF drift, wavelength-solution jumps, or detector artifacts on 5-minute timescales. As written, the Section 5 claim that the excess scatter is 'a manifestation of intrinsic stellar variability, consistent with frequent, short-duration microflares' is not distinguished from a small number of unexplained count-rate excursions. Please define the detection threshold, compute the false-alarm rate from scrambled or airglow-referenced time series, and provide a table of candidates with their significances.
- [Section 3.3] The VLT/FORS2 corroboration is weaker than stated. Flare-like structures are 'identified by eye' in the Figure 4 caption, with no automated detection, no significance threshold, and no completeness estimate. The 1–2 flares/hour rate comes from only four nights, and the reported g'-band amplitudes range from 1% to 50%, yet the temperature inversion in Section 3.4 pairs a ~4% optical event with a ~400% Ly-α event. If the optical excursions are not robustly detected, or if the 4% event is not representative, the independent-corroboration argument loses its quantitative force. Please add a reproducible detection algorithm for the optical data, report per-event amplitudes and durations, and quantify how the spread in optical amplitudes affects the pairing used in Section 3.4.
- [Section 3.4] The flare temperature and filling factor depend on the assumption that Ly-α and optical flares with similar waiting times share the same emission mechanism, citing Loyd et al. (2018). This assumption is load-bearing because it justifies pairing a ~400% Ly-α enhancement with a ~4% g'-band enhancement to solve a one-component blackbody. If the paired events belong to different flare populations, or if the 4% optical amplitude is not representative given the observed 1–50% range, then Tfl = 11000 K and Xfl = 0.011% are not supported. The manuscript should either provide a sensitivity analysis showing how Tfl and Xfl vary when the pairings and the continuum-to-Ly-α ratio (0.03+0.14–0.02) are changed, or clearly present these numbers as an illustrative estimate rather than a measured flare property. The current abstract presents them as a headline result without this caveat.
- [Section 2.5 and Abstract] The abstract quotes 1064 EO_H/Gyr for planet b as the headline upper limit, but the text shows that this value corresponds to (R_XUV/R_star)^2 = 0.20, while the fiducial adopted value of 0.10 yields 533 EO_H/Gyr. The paper itself notes that (R_XUV/R_star)^2 = 0.10 is an upper limit and that smaller cross-sections would reduce the loss rate significantly. The abstract and conclusions should therefore state the range explicitly and distinguish the assumption-dependent escape-rate estimate from the measured transit-depth upper limit. As written, quoting only the doubled value overstates the robustness of the escape-rate constraint.
minor comments (5)
- [Section 2.4] The sentence 'We investigate its origin in Section 4' appears to be a cross-reference error: the variability origin is discussed in Section 3, not Section 4.
- [Table 1] Table 1 contains apparent anomalies: several visits appear twice (e.g., odhs33, odhs31, odhsd1) with different mean-flux values for the same visit, and some entries (e.g., '1.55-11', '1.50e-10') look like typos in the flux column. Please correct the table and ensure each visit appears exactly once with one consistent flux value.
- [Section 3.3] The filter is described as 'gHIGH (spectral range: 388–548 nm)' in Section 3.3, while the abstract, Section 3.4, and Figure 4 refer to g' or g-band observations. Please unify the filter nomenclature and specify whether the photometric band is the standard g' filter or the gHIGH filter.
- [Section 3.4] The text states that the filling factor 'aligned with values reported for TRAPPIST-2 flares' — this is likely a typo for TRAPPIST-1, since no TRAPPIST-2 system is otherwise referenced and the cited works concern TRAPPIST-1.
- [Figure 4] The Figure 4 caption says 'A flare of ~50% amplitude is visible (trimmed here)' but the plotted light curve shows six orange-shaded features. Please clarify which feature is the 50% flare and whether the flare shown was trimmed to preserve the transit window.
Circularity Check
No significant circularity: main results are measured from the data and compared with external benchmarks; self-citations are not load-bearing.
full rationale
The paper's central claims are derived directly from calibrated observations and external benchmarks rather than from its own conclusions. The Ly-alpha transit upper limits are computed from the measured per-visit light curves and the quadrature-summed in-transit/out-of-transit scatter (Section 2.4, Table 2), so the limits are not restatements of an input. The rotation period is tested against the independent K2 rotation period of 3.295 days from Vida et al. (2017) and is checked with an injection-recovery test (Section 4), giving the comparison external content. The flare energies and occurrence rates come from photon-counting data: HST/STIS TIME-TAG events are identified as count-rate increases relative to a baseline (Section 3.2), and the VLT/FORS2 flares are independently measured differential photometry (Section 3.3). The microflare temperature and filling factor in Section 3.4 are obtained by combining the two measured amplitude ratios with the externally published Ly-alpha-to-continuum scaling of Loyd et al. (2018, Table 8) and Linsky et al. (2014); the equal-mechanism assumption for similar waiting times is explicitly stated as a standard approach, not hidden or derived from the target result. Self-citations such as Bourrier et al. (2017b) and Bolmont et al. (2017) are used as published parametric formulas and context, not as the proof of the new detections, and the paper itself flags the main assumption-sensitive inputs (the adopted XUV cross-section and the water-supply limitation) in Section 2.5. No equation or chain in the paper reduces to its own inputs by construction, so no circular step is identified.
Assumptions & free parameters
free parameters (3)
- (R_XUV/R_star)^2 =
0.10 (adopted), 0.20 (doubled upper limit)
- Continuum-to-Ly-alpha ratio for FUV flares =
0.03 (+0.14/-0.02)
- Airglow Voigt FWHM values =
Gaussian 2.08911, Lorentzian 1.83458
assumptions (6)
- domain assumption The energy-limited escape model with efficiency factor epsilon from Bolmont et al. (2017) describes hydrogen loss from TRAPPIST-1 planets.
- domain assumption The Linsky et al. (2014) relation between Ly-alpha and XUV luminosity applies to TRAPPIST-1.
- ad hoc to paper Flares with similar waiting times share underlying emission mechanisms (Loyd et al. 2018 framework).
- domain assumption The continuum-to-Ly-alpha ratio from Loyd et al. (2018) holds for TRAPPIST-1 microflares.
- domain assumption Airglow and background signals are separable from the stellar Ly-alpha signal with the described PSF model, and the airglow position and shape can be treated as constant within a visit.
- domain assumption Candidate flares in TIME-TAG data are not artifacts of photon counting or airglow variability.
Cite this review
Pith. "Pith review of Hubble's Multi-Year Search for Exospheres in the TRAPPIST-1 System Reveals Frequent Microflares." pith.science (2026). https://pith.science/paper/22UYJYUI
@misc{pith2026250612140,
  author       = {Pith},
  title        = {Pith review of: Hubble's Multi-Year Search for Exospheres in the TRAPPIST-1 System Reveals Frequent Microflares},
  year         = {2026},
  howpublished = {\url{https://pith.science/paper/22UYJYUI}},
  note         = {Machine review of arXiv:2506.12140}
}
abstract
Ly-$\alpha$ observations provide a powerful probe of stellar activity and atmospheric escape in exoplanetary systems. We present here an analysis of 104 HST/STIS orbits monitoring the TRAPPIST-1 system between 2017 and 2022, covering 3--5 transits for each of its seven planets. We rule out transit depths $\gtrsim20\%$, which translates into an upper limit on the escape rate of $1064~EO_H$/Gyr for planet b ($1~EO_H$ is the Earth-ocean-equivalent hydrogen content), in agreement with recent claims that planet b should be airless. These upper limits are $\sim$3 times larger than expected from the photon noise due to a large baseline scatter, which we ultimately link to TRAPPIST-1's intrinsic Ly-$\alpha$ variability from frequent ``microflares.'' While JWST observations of TRAPPIST-1 in the near infrared have shown that $\sim10^{30}$-erg flares occur every $\sim$6 hours, we report here $\sim10^{29}$-erg flares on sub-hour timescales in the HST/STIS and also Very Large Telescope (VLT) $g^{'}$ observations. The FUV and optical amplitudes ($\sim$400$\%$ vs $\sim$3$\%$, respectively) for flares with similar waiting-times indicate flare temperatures of 11000$^{+4200}_{-3100}$~K over 0.011$^{+0.03}_{-0.01}$\% of the stellar disk. Finally, our multi-year baseline reveals a variability with $P = 3.27 \pm 0.04$ days, providing further validation of the previously reported 3.295-day rotation period for TRAPPIST-1. These results highlight the importance of accounting for stellar microvariability when searching for exospheres around active M dwarfs.
Figures


Figures from the paper (5 more)


Reference graph
Works this paper leans on
-
[1]
Agol , E., Dorn , C., Grimm , S. L., et al. 2021, , 2, 1, 10.3847/PSJ/abd022
-
[2]
Astropy Collaboration , Robitaille , T. P., Tollerud , E. J., et al. 2013, , 558, A33, 10.1051/0004-6361/201322068
-
[3]
Astropy Collaboration , Price-Whelan , A. M., Sip o cz , B. M., et al. 2018, , 156, 123, 10.3847/1538-3881/aabc4f
-
[4]
Astropy Collaboration , Price-Whelan , A. M., Lim , P. L., et al. 2022, apj, 935, 167, 10.3847/1538-4357/ac7c74
-
[5]
I., Bertaux, J.-L., Quémerais, E., Izmodenov, V
Baliukin, I. I., Bertaux, J.-L., Quémerais, E., Izmodenov, V. V., & Schmidt, W. 2019, Journal of Geophysical Research: Space Physics, 124, 861, https://doi.org/10.1029/2018JA026136
- [6]
-
[7]
2017 a , , 597, A26, 10.1051/0004-6361/201629253
Bourrier , V., Ehrenreich , D., King , G., et al. 2017 a , , 597, A26, 10.1051/0004-6361/201629253
-
[8]
Bourrier , V., de Wit , J., Bolmont , E., et al. 2017 b , , 154, 121
work page 2017
Show all 55 references
-
[9]
, Ehrenreich, D
Bourrier, V. , Ehrenreich, D. , Wheatley, P. J. , et al. 2017, A&A, 599, L3, 10.1051/0004-6361/201630238
2017 doi
-
[10]
1995, , 378, 333, 10.1038/378333a0
Burrows , A., & Lunine , J. 1995, , 378, 333, 10.1038/378333a0
1995 doi
-
[11]
2013, Science, 342, 1473, 10.1126/science.1245450
de Wit , J., & Seager , S. 2013, Science, 342, 1473, 10.1126/science.1245450
2013 doi
-
[12]
R., Gillon , M., et al
de Wit , J., Wakeford , H. R., Gillon , M., et al. 2016, , 537, 69, 10.1038/nature18641
2016 doi
-
[13]
2018, Nature Astronomy, 2, 10.1038/s41550-017-0374-z
de Wit, J., Wakeford, H., Lewis, N., et al. 2018, Nature Astronomy, 2, 10.1038/s41550-017-0374-z
2018 doi
-
[14]
J., Moran, S
Garcia , L. J., Moran, S. E. , Rackham, B. V. , et al. 2022, A&A, 665, A19, 10.1051/0004-6361/202142603
2022 doi
-
[15]
2007, Planetary and Space Science, 55, 1426, https://doi.org/10.1016/j.pss.2007.03.007
García Muñoz , A. 2007, Planetary and Space Science, 55, 1426, https://doi.org/10.1016/j.pss.2007.03.007
2007 doi
-
[16]
Gillon, M., Triaud, A. H. M. J., Demory, B.-O., et al. 2017, Nature, 542, 456, 10.1038/nature21360
2017 doi
-
[17]
B., Lunine , J
Guillot , T., Burrows , A., Hubbard , W. B., Lunine , J. I., & Saumon , D. 1996, , 459, L35, 10.1086/309935
1996 doi
-
[18]
G., Hudson , H
Hannah , I. G., Hudson , H. S., Battaglia , M., et al. 2011, , 159, 263, 10.1007/s11214-010-9705-4
2011 doi
-
[19]
Hastings, W. K. 1970, Biometrika, 57, 97, 10.2307/2334940
1970 doi
-
[20]
S., Kowalski , A
Howard , W. S., Kowalski , A. F., Flagg , L., et al. 2023, , 959, 64, 10.3847/1538-4357/acfe75
2023 doi
-
[21]
S., MacGregor , M
Howard , W. S., MacGregor , M. A., Feinstein , A. D., et al. 2025, , 169, 27, 10.3847/1538-3881/ad93ce
2025 doi
-
[22]
Jackman , J. A. G., Shkolnik , E. L., Million , C., et al. 2023, , 519, 3564, 10.1093/mnras/stac3135
2023 doi
-
[23]
Kaltenegger , L., & Traub , W. A. 2009, , 698, 519, 10.1088/0004-637X/698/1/519
2009 doi
-
[24]
F., Hawley , S
Kowalski , A. F., Hawley , S. L., Wisniewski , J. P., et al. 2013, , 207, 15, 10.1088/0067-0049/207/1/15
2013 doi
-
[25]
2003, The Astrophysical Journal, 598, L121, 10.1086/380815
Lammer, H., Selsis, F., Ribas, I., et al. 2003, The Astrophysical Journal, 598, L121, 10.1086/380815
2003 doi
-
[26]
1993, , 408, 305, 10.1086/172589
Landsman , W., & Simon , T. 1993, , 408, 305, 10.1086/172589
1993 doi
-
[27]
Lichtenberg, T., & Clement, M. S. 2022, The Astrophysical Journal Letters, 938, L3, 10.3847/2041-8213/ac9521
2022 doi
-
[28]
2023, , 955, L22, 10.3847/2041-8213/acf7c4
Lim , O., Benneke , B., Doyon , R., et al. 2023, , 955, L22, 10.3847/2041-8213/acf7c4
2023 doi
-
[29]
L., Fontenla , J., & France , K
Linsky , J. L., Fontenla , J., & France , K. 2014, , 780, 61
2014
-
[30]
Lomb , N. R. 1976, , 39, 447, 10.1007/BF00648343
1976 doi
-
[31]
Loyd , R. O. P., France , K., Youngblood , A., et al. 2018, , 867, 71, 10.3847/1538-4357/aae2bd
2018 doi
-
[32]
S., & Lincowski, A
Lustig-Yaeger, J., Meadows, V. S., & Lincowski, A. P. 2019, The Astronomical Journal, 158, 27, 10.3847/1538-3881/ab21e0
2019 doi
-
[33]
J., Ilin , E., Oshagh , M., et al
Maas , A. J., Ilin , E., Oshagh , M., et al. 2022, , 668, A111, 10.1051/0004-6361/202243869
2022 doi
-
[34]
1970, Planetary and Space Science, 18, 803, https://doi.org/10.1016/0032-0633(70)90080-2
Meier, R., & Mange, P. 1970, Planetary and Space Science, 18, 803, https://doi.org/10.1016/0032-0633(70)90080-2
1970 doi
-
[35]
W., Rosenbluth, M
Metropolis, N., Rosenbluth, A. W., Rosenbluth, M. N., Teller, A. H., & Teller, E. 1953, The Journal of Chemical Physics, 21, 1087–1092, 10.1063/1.1699114
1953 doi
-
[36]
V., Knutson , H., Line , M., et al
Morley , C. V., Knutson , H., Line , M., et al. 2017, , 153, 86, 10.3847/1538-3881/153/2/86
2017 doi
-
[37]
A., Queloz , D., Gillon , M., et al
Murray , C. A., Queloz , D., Gillon , M., et al. 2022, , 513, 2615, 10.1093/mnras/stac1078
2022 doi
-
[38]
A., Chiang , E
Murray-Clay , R. A., Chiang , E. I., & Murray , N. 2009, , 693, 23, 10.1088/0004-637X/693/1/23
2009 doi
-
[39]
E., & Jackson , A
Owen , J. E., & Jackson , A. P. 2012, , 425, 2931, 10.1111/j.1365-2966.2012.21481.x
2012
-
[40]
2025, , 979, L5, 10.3847/2041-8213/ada381
Radica , M., Piaulet-Ghorayeb , C., Taylor , J., et al. 2025, , 979, L5, 10.3847/2041-8213/ada381
2025 doi
-
[41]
2016, , 596, A111
Ribas , I., Bolmont , E., Selsis , F., et al. 2016, , 596, A111
2016
-
[42]
E., Newton, E
Rockcliffe, K. E., Newton, E. R., Youngblood, A., et al. 2021, The Astronomical Journal, 162, 116, 10.3847/1538-3881/ac126f
2021 doi
-
[43]
Scargle , J. D. 1982, , 263, 835, 10.1086/160554
1982 doi
-
[44]
2007, , 191, 453
Selsis , F., Chazelas , B., Bord \'e , P., et al. 2007, , 191, 453
2007
-
[45]
Sim, S. A. 2001, Monthly Notices of the Royal Astronomical Society, 326, 821, 10.1046/j.1365-8711.2001.04632.x
2001
-
[46]
J., Sing , D
Spake , J. J., Sing , D. K., Evans , T. M., et al. 2018, Nature, 557, 67. 1805.01298
2018 arXiv
- [47]
-
[48]
2020, A&A, 638, A41, 10.1051/0004-6361/201937151
Turbet , M., Bolmont, Emeline , Ehrenreich, David , et al. 2020, A&A, 638, A41, 10.1051/0004-6361/201937151
2020 doi
-
[49]
T., Desch , S
Unterborn , C. T., Desch , S. J., Hinkel , N. R., & Lorenzo , A. 2018, Nature Astronomy, 2, 297, 10.1038/s41550-018-0411-6
2018 doi
-
[50]
2017, The Astrophysical Journal, 841, 124, 10.3847/1538-4357/aa6f05
Vida, K., Kővári, Z., Pál, A., Oláh, K., & Kriskovics, L. 2017, The Astrophysical Journal, 841, 124, 10.3847/1538-4357/aa6f05
2017 doi
-
[51]
2004, , 604, L69, 10.1086/383347
Vidal-Madjar , A., D \'e sert , J.-M., Lecavelier des Etangs , A., et al. 2004, , 604, L69, 10.1086/383347
2004 doi
-
[52]
R., Lewis , N
Wakeford , H. R., Lewis , N. K., Fowler , J., et al. 2019, , 157, 11, 10.3847/1538-3881/aaf04d
2019 doi
-
[53]
E., Redfield, S., Linsky, J
Wood, B. E., Redfield, S., Linsky, J. L., Müller, H.-R., & Zank, G. P. 2005, The Astrophysical Journal Supplement Series, 159, 118, 10.1086/430523
2005 doi
-
[54]
Yelle , R. V. 2004, , 170, 167, 10.1016/j.icarus.2004.02.008
2004 doi
-
[55]
A., Wang , L., et al
Zhang , M., Knutson , H. A., Wang , L., et al. 2022, , 163, 68, 10.3847/1538-3881/ac3f3b
2022 doi
Reviewed August 7, 2026 · model on record in the stance chip above.
Discussion (0). Continue with ORCID to comment.