REVIEW 3 major objections 5 minor 20 references
FindMeIfYouCan: Bringing Open Set metrics to $\textit{near} $, $ \textit{far} $ and $\textit{farther}$ Out-of-Distribution Object Detection
T0 review · 3 major / 5 minor · reviewed 2026-08-07 · deepseek-v4-flash
Pith's one-line read The standard OOD object-detection benchmark hides ignored objects; new near/far/farther splits expose that mistake.
desk verdict Useful benchmark and a real critique of VOS, but the near/far/farther trend rests on a confounded comparison; worth refereeing with fixes. read the letter →
The pith
A machine-rendered reading of the paper's core claim, the machinery that carries it, and where it could break.
The reading
What carries the argument
The load-bearing object is the curated evaluation split with ground-truth labels: distance categories near, far, and farther determined by CLIP cosine similarity plus manual inspection, together with the OSOD metrics APU, PU, RU, and nOSE computed at an IoU threshold of 0.5. The mechanism is that ground-truth boxes let the benchmark count ignored unknowns through low recall and confusions through nOSE, instead of only scoring the detector's confident predictions.
What would settle it
Construct a single-ID benchmark using only Pascal-VOC as in-distribution data, with three manually separated OOD levels whose measured CLIP-distance gaps match the near-far and far-farther gaps in FMIYC, and rerun the same methods; if the nOSE and recall trends do not reproduce a three-step gradient, the 'farther' label was not doing the work.
Extended reading notes
Core claim
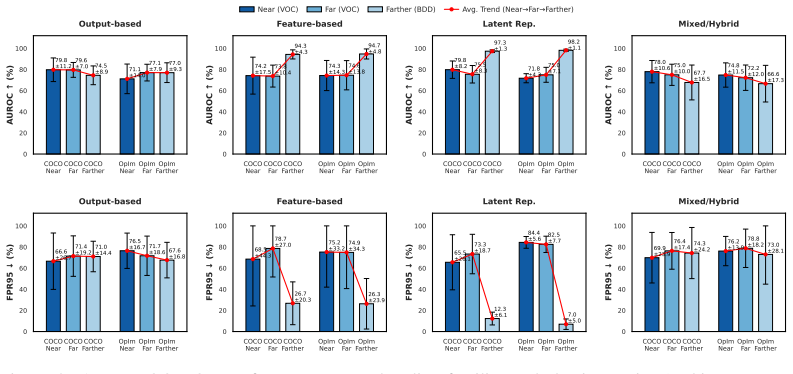
The central claim is that the widely used VOS benchmark for OOD object detection cannot measure whether unknown objects are found, ignored, or confused with known classes. The authors show that OOD images in that benchmark contain labeled and unlabeled instances of ID classes, such as people and dining tables, violating the non-overlap assumption, and that up to roughly 59% of images in one OOD split produce no predictions above threshold, so AUROC and FPR95 are computed on a biased subset. The proposed FMIYC benchmark removes overlaps, adds curated near and far splits relative to Pascal-VOC, and designates the BDD-based OOD sets as farther; it then applies open-set metrics that use ground-truth boxes to quantify unknown recall, precision, and the normalized open-set error. The result is that near OOD objects are localized better but also suffer the highest nOSE, while farther objects have very low recall and very low nOSE, a pattern invisible to the old metrics.
Load-bearing premise
The entire near/far/farther narrative assumes that CLIP similarity plus manual curation across two different in-distribution datasets, Pascal-VOC and BDD100k, yields one meaningful distance axis; if 'farther' just means 'BDD's OOD images,' the observed trend is not purely a distance effect.
Editorial extensions
If this is right
- If the protocol is adopted, prior OOD-OD results reported on the VOS benchmark need re-examination because their AUROC and FPR95 numbers are built on a contaminated and biased subset.
- Detector architectures and scoring functions can now be compared on whether they actually find unknowns, not just whether they flag incorrect predictions; for example, density-based scores excel on farther splits while others lead on near splits.
- Tuning the detection threshold becomes an explicit lever: lowering it gives scoring functions more candidate boxes and could raise unknown recall.
- The correlation analysis shows that unknown precision is orthogonal to AUROC and FPR95, so claims about OOD-OD safety should report open-set metrics as well.
- The benchmark enables a direct comparison of open-set metrics with legacy discrimination metrics on the same architecture, method, and split, which was previously impossible.
Reading between the lines
- The near/far/farther ordering is not a single validated distance axis because the farther level is defined relative to BDD100k rather than Pascal-VOC; a testable extension would build a true three-level split within one ID dataset.
- Because the benchmark depends on exhaustive ground-truth labels, unlabeled OOD objects that are detected will be counted as false positives; the paper acknowledges this and keeps AUROC/FPR95 for that case, so a hybrid reading is needed.
- The finding that near objects are easier to localize than far ones inverts the usual image-classification intuition; a natural next experiment is to ablate localization difficulty separately from semantic similarity to see which factor drives the trend.
Editorial analysis
A structured set of objections, weighed in public.
Referee Report
Summary. The paper argues that the standard VOS benchmark for out-of-distribution object detection (OOD-OD) violates its core non-overlap assumption because OOD images contain labeled and unlabeled in-distribution (ID) objects, and that the AUROC/FPR95 metrics built on that benchmark cannot measure whether unknown objects are actually localized, ignored, or confused with ID classes. To address this, the authors introduce the FMIYC benchmark, which removes overlapping images, creates near/far splits for Pascal-VOC and farther splits for BDD100k based on CLIP similarity and manual curation, and adds open-set metrics (APU, PU, RU, and the newly proposed nOSE). They evaluate several post-hoc OOD detection methods across Faster R-CNN, YOLOv8, and RT-DETR, and report that semantically near OOD objects are easier to localize but more often confounded with ID classes, whereas far and farther objects are harder to localize but less often mistaken for ID objects.
Significance. If validated, the paper would make a useful contribution: it documents a concrete overlap violation in an existing benchmark with counts and examples, releases a reproducible dataset and configuration files, and demonstrates that AUROC/FPR95 and open-set metrics are partially orthogonal (Figure 12). The breadth of architectures and methods evaluated is a strength, as is the concrete proposal of nOSE for cross-dataset comparability. However, the central empirical claim of a near/far/farther semantic-distance gradient is not established by the reported experiments, because the farther split changes both the ID dataset and the detector, and because the near/far ordering rests on manual curation without independent validation. The underlying idea is defensible, but the load-bearing comparison needs methodological repair before the headline conclusion can be accepted.
major comments (3)
- [§4.1, Figure 5, Table 3] The 'farther' split is not a third level on the same semantic-distance axis as near and far. Near and far splits are defined only for ID=Pascal-VOC, while the farther splits are OOD sets with respect to BDD100k, and the detectors are trained separately on each ID dataset. Table 3 shows that BDD-trained detectors have substantially lower mAP (31.2–33.3) than VOC-trained detectors (48.7–70.4), so the lower APU/RU and higher ignore rates observed for farther splits in Figure 5 and Tables 14–25 are confounded with detector quality and domain shift. Figure 3 compares each ID dataset to its own OOD sets rather than anchoring all splits to a common distribution. To support the claim that far and farther objects are harder to localize but less confounded as semantic distance increases, the authors should either construct a third distance level within a single ID dataset with a fixed detector, or explicitly limit the trend claim to within-ID comparisons.
- [§4.1, Table 6, Figure 3b] The near/far split is created by manually selecting near categories and then manually inspecting images, with no inter-annotator agreement, no random-selection control, and no independent validation of the ordering. CLIP similarity in Figure 3b is computed after the splits have been defined, so it reflects the manual category choices rather than providing an external test of the semantic-distance axis. Category-specific properties (object size, frequency, background) could drive the observed trends. The authors should add a per-category analysis or a random-split control to show that the measured effects are attributable to the semantic-distance gradient rather than to the particular categories chosen for each split.
- [§4.2 and Appendix D, Eq. (3)–(5), Eq. (9)] The definition of the OSOD metrics in a post-hoc OOD-OD setup is incomplete for predictions that do not overlap any ground-truth unknown object. The base detector emits ID-class labels; a detection labeled as an ID class on an OOD image that does not overlap a labeled unknown is neither a TP_U, an FP_U, nor an F_NM under the stated definitions, so it is not counted by PU, RU, or nOSE. Since the benchmark's OOD images are constructed to contain no ID objects, such spurious ID-class detections are exactly the failure mode the benchmark is meant to expose. The authors should specify how such predictions are treated, or add a metric that captures them; otherwise the claim that OSOD metrics 'comprehensively' evaluate confusion with ID objects is overstated.
minor comments (5)
- [§5.3, text near Figure 5] The sentence describing nOSE says it measures 'more objects are mistakenly predicted as one of the in-distribution (ID) classes among the correctly localized objects,' but the definition in Eq. (9) normalizes by all ground-truth unknowns (TP_U + FN_U), not only by correctly localized ones. Please correct the text to match the equation.
- [Figure 5] Several panels in Figure 5 use a broken or non-linear y-axis (e.g., ticks at 0, 10, 21.8, 30, 100), which can visually exaggerate differences. Use a consistent linear scale.
- [Abstract and Section 4.1] The terms near, far, and farther are typeset inconsistently (italic, roman, and a mix in the abstract). Please unify the formatting for readability.
- [References] The reference to Du et al. 2022b is rendered as 'V os' rather than 'VOS' in the bibliography; correct the typo.
- [Appendix B, Table 4] Table 4 reports the number of OOD images containing ID classes, but it would be helpful to also report the total number of images inspected and the inter-annotator agreement for the manual verification, since the curation is a key contribution.
Circularity Check
No circular derivation: the headline trends are measured OSOD metrics on curated splits, not fitted inputs; the farther-split label is post hoc and confounded but not constructed from the metrics.
full rationale
The paper's central findings are empirical measurements, not constructions. The OSOD metrics (nOSE = F_NM_U / (TP_U + FN_U), RU, APU, PU) are computed from ground-truth boxes and detector predictions; no parameter is fitted to force the near/far/farther trend. The near/far splits are defined by manually curated semantic categories w.r.t. Pascal-VOC (Sec. 4.1, Table 6), and farther is the BDD OOD set after overlap removal; these labels come from CLIP similarity plus manual inspection, not from the outcome metrics. The only circular-adjacent passage is Sec. 4.1: "we argue (after considering Figure 3b and the results) that the OOD datasets with respect to BDD can be called farther OOD." This is a post-hoc naming choice, and it creates a confound because the farther split changes both the ID dataset and the detector checkpoints (Table 3: BDD-trained models have much lower mAP), so the farther-vs-far differences in Figure 5 may reflect detector/ID quality rather than semantic distance. However, this is a validity/confound issue, not a self-definitional reduction: the trend is not forced by an equation or by the metric definitions. The LaRD baseline is adapted from the authors' prior work (Arnez et al. 2024), but it is one of many baselines and is not load-bearing for the benchmark claims. No self-citation chain or uniqueness theorem is used to forbid alternatives. Therefore no significant circularity; score 2 reflects the minor post-hoc labeling and self-citation, not a circular derivation.
Assumptions & free parameters
free parameters (3)
- near-category assignment =
Table 6 (manual list)
- farther assignment =
BDD OOD sets labeled farther without a numeric threshold
- LaRD layer selection =
RPN intermediate for Faster-RCNN, backbone final layer for YOLOv8, first encoder for RT-DETR
assumptions (5)
- domain assumption CLIP cosine similarity between image embeddings is a valid ordinal proxy for semantic and visual nearness of OOD objects to ID classes.
- domain assumption Manual visual inspection can reliably detect all unlabeled instances of ID classes and correctly assign images to near/far splits.
- domain assumption AUROC/FPR95 computed on predictions above the detector threshold capture the behavior of the previous benchmark; ignored images contribute no samples.
- domain assumption Adapting image-classification post-hoc OOD scores to per-object detections preserves their ranking properties.
- domain assumption The OOD operating point for PU/RU/nOSE is the threshold where 95% of ID detections pass.
Cite this review
Pith. "Pith review of FindMeIfYouCan: Bringing Open Set metrics to $\textit{near} $, $ \textit{far} $ and $\textit{farther}$ Out-of-Distribution Object Detection." pith.science (2026). https://pith.science/paper/BJT4RQLP
@misc{pith2026250614008,
  author       = {Pith},
  title        = {Pith review of: FindMeIfYouCan: Bringing Open Set metrics to $\textitnear $, $ \textitfar $ and $\textitfarther$ Out-of-Distribution Object Detection},
  year         = {2026},
  howpublished = {\url{https://pith.science/paper/BJT4RQLP}},
  note         = {Machine review of arXiv:2506.14008}
}
abstract
State-of-the-art Object Detection (OD) methods predominantly operate under a closed-world assumption, where test-time categories match those encountered during training. However, detecting and localizing unknown objects is crucial for safety-critical applications in domains such as autonomous driving and medical imaging. Recently, Out-Of-Distribution (OOD) detection has emerged as a vital research direction for OD, focusing on identifying incorrect predictions typically associated with unknown objects. This paper shows that the current evaluation protocol for OOD-OD violates the assumption of non-overlapping objects with respect to the In-Distribution (ID) datasets, and obscures crucial situations such as ignoring unknown objects, potentially leading to overconfidence in deployment scenarios where truly novel objects might be encountered. To address these limitations, we manually curate, and enrich the existing benchmark by exploiting semantic similarity to create new evaluation splits categorized as $\textit{near}$, $\textit{far}$, and $\textit{farther}$ from ID distributions. Additionally, we incorporate established metrics from the Open Set community, providing deeper insights into how effectively methods detect unknowns, when they ignore them, and when they mistakenly classify OOD objects as ID. Our comprehensive evaluation demonstrates that semantically and visually close OOD objects are easier to localize than far ones, but are also more easily confounded with ID objects. $\textit{Far}$ and $\textit{farther}$ objects are harder to localize but less prone to be taken for an ID object.
Figures


Figures from the paper (10 more)


Reference graph
Works this paper leans on
-
[1]
A. K. M. Abbas, K. Tirumala, D. Simig, S. Ganguli, and A. S. Morcos. Semdedup: Data-efficient learning at web-scale through semantic deduplication. InICLR 2023 Workshop on Mathematical and Empirical Understanding of Foundation Models,
work page 2023
-
[2]
In total, there are 7767 images across all splits. 18 (a) Most frequent labeled categories in OpenImages-Far (b) Most frequent labeled categories in OpenImages-Near (c) Most frequent labeled categories in COCO-Far (d) Most frequent labeled categories in COCO-Near Figure 8: Top 20 category count for OOD datasets w.r.t. Pascal-VOC (a) Most frequent labeled ...
work page 2005
-
[3]
We used the same hyperparameters for both models
G.1 Yolov8 We trained the nano version of Yolov8 for both ID datasets (BDD100k and Pascal-VOC). We used the same hyperparameters for both models. Most of them corresponded to the default hyperparameters. They were trained for 100 epochs, using the AdamW optimizer with momentum of 0.937 and weight decay of 5×10 −4. The learning rate was 10−3, and was contr...
work page 2023
-
[7]
Cannot measure unlabeled unknowns
22 Table 7: Overall metrics summary Metric Purpose Limitations Advantages AUROC, FPR95 Measures the ability of a scoring function to detect incorrect predictions Cannot take into account ignored objects Does not depend on GT labels, can detect incorrect predictions that do not overlap with labeled objects Precision Measures the percent of correct predicti...
- [8]
-
[9]
R. Padilla, S. L. Netto, and E. A. Da Silva. A survey on performance metrics for object-detection algorithms. In 2020 international conference on systems, signals and image processing (IWSSIP), pages 237–242. IEEE,
work page 2020
-
[10]
Y . Sun, Y . Ming, X. Zhu, and Y . Li. Out-of-distribution detection with deep nearest neighbors.arXiv preprint arXiv:2204.06507,
-
[11]
T.-H. Vu, E. Valle, A. Bursuc, T. Kerssies, D. de Geus, G. Dubbelman, L. Qian, B. Zhu, Y . Chen, M. Tang, et al. The bravo semantic segmentation challenge results in uncv2024.arXiv preprint arXiv:2409.15107,
Show all 20 references
-
[12]
near”, “far
12 Appendix A Datasheet for Datasets Here we provide complete answers to the datasheet in Gebru et al. [2021]. A.1 Motivation • For what purpose was the dataset created? Was there a specific task in mind? Was there a specific gap that needed to be filled? Please provide a desc...
2021
-
[13]
The embeddings for both ID datasets, and for OOD samples in each split were extracted
embedding space. The embeddings for both ID datasets, and for OOD samples in each split were extracted. Then, following the procedure in Mayilvahanan et al. [2023], we calculated the cosine similarity between ID and their respective OOD datasets. The obtained results before an...
2023
-
[15]
AUROC and FPR95 cannot measure that all OOD objects in these images are ignored
Even if the unknown objects are correctly localized, AUROC and FPR95 are not measuring this since 20 Figure 11: Absense of predictions of Faster-RCNN trained on BDD100k on images from the OOD datasets in the current benchmark. AUROC and FPR95 cannot measure that all OOD object...
2011
-
[17]
In our case, we used directly the latent activations without doing Monte Carlo dropout sampling of entropy estimation as in Arnez et al
and built a method based on the latent space convolutional activations. In our case, we used directly the latent activations without doing Monte Carlo dropout sampling of entropy estimation as in Arnez et al. [2024], nor using a surrogate model or the generation of adversarial...
2024
-
[26]
unknown" class directly into the object detector, adding specific loss terms and usually training with labeled or pseudo-labeled examples of
36 Table 26: Hyperparameters for training RT-DETR whith ID datasets BDD100k and Pascal-VOC Parameter ID: BDD ID: VOC Batch size 8 8 Inference threshold 0.25 0.25 Learning rate backbone4×10 −6 2×10 −6 Max epochs 60 60 Num queries 100 100 Random seed 40 40 Learning rate4×10 −5 2...
2023
-
[2017]
Hendrycks and K
D. Hendrycks and K. Gimpel. A baseline for detecting misclassified and out-of-distribution examples in neural networks.arXiv preprint arXiv:1610.02136,
-
[2018]
T.-Y . Lin, M. Maire, S. Belongie, J. Hays, P. Perona, D. Ramanan, P. Dollár, and C. L. Zitnick. Microsoft coco: Common objects in context. InComputer Vision–ECCV 2014: 13th European Conference, Zurich, Switzerland, September 6-12, 2014, Proceedings, Part V 13, pages 740–755. ...
2014
-
[2020]
Djurisic, N
A. Djurisic, N. Bozanic, A. Ashok, and R. Liu. Extremely simple activation shaping for out-of-distribution detection.arXiv preprint arXiv:2209.09858,
-
[2021]
Kuznetsova, H
A. Kuznetsova, H. Rom, N. Alldrin, J. Uijlings, I. Krasin, J. Pont-Tuset, S. Kamali, S. Popov, M. Malloci, A. Kolesnikov, et al. The open images dataset v4: Unified image classification, object detection, and visual relationship detection at scale.International Journal of Comp...
1956
-
[2022]
Mayilvahanan, T
P. Mayilvahanan, T. Wiedemer, E. Rusak, M. Bethge, and W. Brendel. Does clip’s generalization performance mainly stem from high train-test similarity? InNeurIPS 2023 Workshop on Distribution Shifts: New Frontiers with Foundation Models,
2023
-
[2023]
Ammar, N
H. Ammar, N. Kiselov, G. Lapouge, and R. Audigier. Open-set object detection: towards unified problem formulation and benchmarking.arXiv preprint arXiv:2411.05564,
-
[2024]
and RTDETR Zhao et al. [2024]. Both architectures were trained on a single GPU Nvidia A100 40G. The achieved mAP by both models in each ID dataset is found in Table
2024
Reviewed August 7, 2026 · model on record in the stance chip above.
Discussion (0). Sign in to comment.