REVIEW 3 major objections 6 minor 15 references
SAS in ESA Datalabs: A New Platform for XMM-Newton Analysis
T0 review · 3 major / 6 minor · reviewed 2026-08-07 · deepseek-v4-flash
Pith's one-line read The paper claims that ESA Datalabs, a cloud platform running XMM-Newton's SAS in a JupyterLab container, reproduces local analysis so closely that the only detected spectral difference is a mean ratio deviation of 0.0018, attributed to…
desk verdict Useful platform paper with a real deliverable; the quantitative replication claim is not controlled, so the abstract should be softened or the comparison upgraded. read the letter →
The pith
A machine-rendered reading of the paper's core claim, the machinery that carries it, and where it could break.
The reading
What carries the argument
The carrying object is the XMM-SAS Datalab: a Docker container built on JupyterLab, with HEASoft and SAS 21.0 installed, pySAS (a Python wrapper that lets SAS tasks be called as objects from notebook cells) available for all reduction steps, and XMM-Newton CCFs and analysis threads mounted automatically as data volumes. This container is what turns command-line SAS workflows into scriptable, shareable notebooks, and it is what the Vela X-1 case study runs inside. Interactive pieces such as JS9 image display and the lcviz light-curve viewer are added to preserve the interactive features of a local SAS session.
What would settle it
Take the same Vela X-1 observation, run the published notebook on a local SAS 21.0 installation with October 2024 CCFs, and compare the resulting time-averaged spectrum to the Datalabs spectrum; a residual mean that differs from 1 by much more than 0.0018, or shows a trend across energy, would indicate the platform itself alters results.
Extended reading notes
Core claim
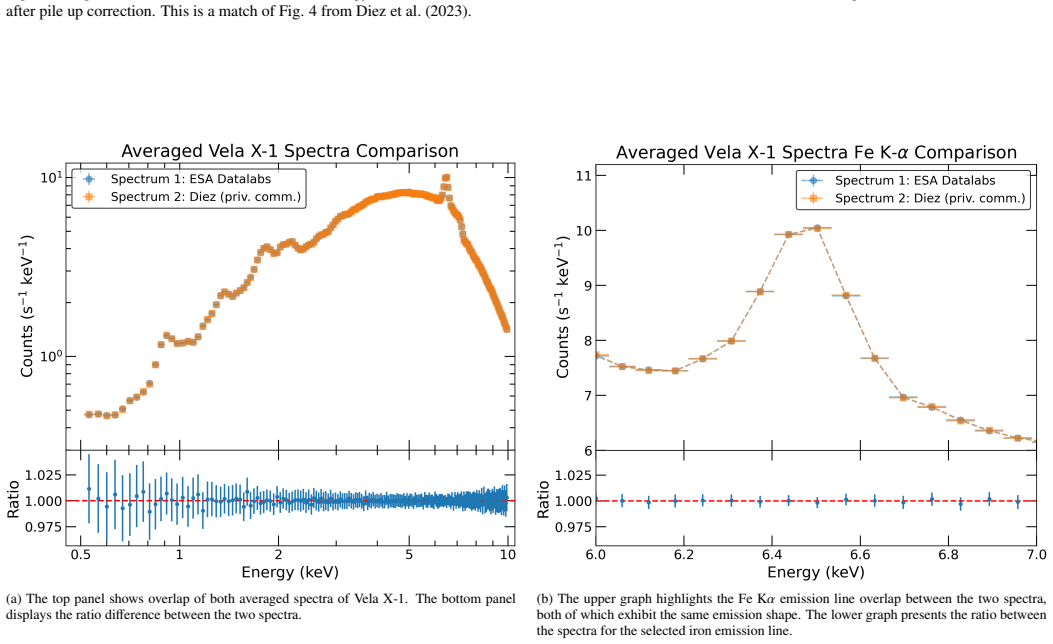
The central discovery is that the ESA Datalabs platform accurately reproduces the output of a local SAS installation, with only minimal deviations in the spectra. In the Vela X-1 case study, the cloud replica matched the original analysis in its light curve flares, energy-resolved light curves, pile-up diagnostics, and the time-averaged spectrum, including the Fe K-alpha line shape. The quantitative comparison uses a ratio of the Datalabs spectrum to the original local spectrum, interpolated over 0.5-10.0 keV, and gives a mean deviation of delta = 0.0018 from the no-deviation line of 1, with no discernible systematic pattern. The paper explains the small difference as coming from the newer software and calibration files used in the cloud run: SAS 21.0 with October 2024 CCFs instead of SAS 20.0 with April 2022 CCFs, a period that included updates to effective area files, response matrix files, and CTI corrections.
Load-bearing premise
The claim that Datalabs faithfully replicates local SAS rests on treating the 0.0018 spectral deviation as caused by the newer SAS and calibration files, since no run with identical versions on both sides is provided.
Editorial extensions
If this is right
- A researcher can run the complete XMM-Newton reduction chain, from data download to grouped spectra, in a web browser without installing SAS, HEASoft, or calibration files locally.
- Cloud outputs can be treated as equivalent to local outputs within calibration-version differences: the Vela X-1 replica shows a mean spectral ratio deviation of 0.0018 with no systematic residual pattern.
- The Jupyter notebook plus git integration turns an XMM-Newton analysis into a documented, shareable, reproducible package, as demonstrated by the public case-study repository.
- The trade-offs are explicit: Datalabs requires an internet connection, is affected by service maintenance and updates, and interactive use requires Python and pySAS knowledge.
- The same containerised environment gives direct access to current CCFs and SAS threads, removing a common source of setup error in local installations.
Reading between the lines
- If the version-difference explanation is right, pinning the Datalab container to SAS 20.0 with the April 2022 CCFs should make the residual mean essentially zero; the paper does not run this matched-version control.
- The container-plus-Jupyter pattern is not specific to XMM-Newton and could be reused for other missions' analysis software, since the design choices are generic to e-science platforms.
- The reproducibility promise is time-limited as currently implemented, because Datalabs tracks the latest SAS and CCF releases; archiving version-pinned containers would make past analyses exactly repeatable.
- A matched-version comparison on a fainter, non-timing-mode source would test whether the 0.0018-level agreement holds beyond this bright and heavily pile-up-corrected case.
Editorial analysis
A structured set of objections, weighed in public.
Referee Report
Summary. The paper describes the XMM-SAS Datalab, a containerized JupyterLab-based interface to the XMM-Newton Science Analysis System (SAS) running inside ESA Datalabs. It documents the platform architecture, the pySAS wrapper, available interactive tools (JS9, lcviz, Plotly), and a set of Jupyter notebook threads and Python helper functions. The central demonstration is a case study of Vela X-1 (ObsID 0841890201) that replicates a previous analysis by Diez et al. (2023): the authors run the EPIC-pn reduction pipeline (epproc, barycen, evselect, epiclccorr, epatplot, spectral extraction) inside Datalabs and compare the resulting time-averaged spectrum with the original one obtained from C. M. Diez by private communication. The paper reports a mean ratio deviation of δ = 0.0018 between 0.5 and 10 keV, interpreting this as evidence that the Datalabs platform accurately reproduces local SAS output. It also discusses limitations, including the lack of guarantee that SAS versions and CCFs remain fixed for full reproducibility, and compares ESA Datalabs with SciServer.
Significance. If the replication claim held, the contribution would be valuable: it would give XMM-Newton users a low-barrier, collaborative, cloud-based path to standard SAS analysis with transparent sharing of scripts and environments. The paper ships a public git repository with notebooks and scripts, which is a strength and makes the case study auditable. However, the quantitative replication claim is not yet established: the Datalabs run and the baseline differ in SAS version (21.0 vs 20.0) and CCF epoch (October 2024 vs April 2022), and the comparison baseline is a private spectrum from a coauthor. As a result, the measured deviation cannot be attributed specifically to the platform, and the headline claim 'reliably replicates local SAS outputs' is stronger than the evidence supports. The platform description and available tooling are nevertheless useful and appropriate for a software/practice journal like Astronomy & Computing.
major comments (3)
- [Section 5.2, Figure 6] The central claim that 'the ESA Datalabs platform accurately reproduces the original local SAS output' is not supported by the comparison as reported, because the two spectra differ simultaneously in SAS version (21.0 with October 2024 CCFs vs 20.0 with April 2022 CCFs) and in reduction provenance. No control run with identical SAS and CCF versions is shown, so the mean ratio of 1.0018 cannot be interpreted as a platform-induced error; it conflates software/calibration changes, possible differences in the re-implemented reduction choices, and any real platform effect. To support the claim, the authors would need either a matched-version comparison (same SAS and CCFs in both environments) or an explicit error budget that separates these contributions.
- [Section 5.2, Figure 6 caption] The baseline spectrum is obtained 'through private communication with C. M. Diez' rather than from a public archive or a published table. Because the reference is internal to the author group, the comparison does not constitute an independent replication, and no outside reader can verify the overlap or recompute the residual. The public git repository should include the baseline spectrum (or a machine-readable version of it) for the replication to be auditable.
- [Section 5.2, final paragraph] The paper itself notes that 'SAS datalab does not ensure that the same SAS software versions and CCFs would be available for full reproducibility of research scripts.' This is in tension with the abstract's claim that the platform 'reliably replicates local SAS outputs.' At minimum, the reproducibility claim should be qualified: Datalabs can reproduce a given analysis only within the tolerances set by the ever-changing SAS/CCF versions, and the version drift is a feature of the current design. The manuscript should either pin versions or soften the replication claim accordingly.
minor comments (6)
- [Section 5.2] The sentence 'The mean from the no deviation line of 1 is calculated to be δ = 0.0018' is ambiguous: please define whether δ is the mean of (ratio − 1), the mean of |ratio − 1|, or another quantity, and report the scatter or uncertainty on this value.
- [Section 5.1, code block] The epproc arguments appear with stray character spacing (e.g., 'w i t h d e f a u l t c a l = N'); this looks like a LaTeX rendering artifact and should be fixed for readability.
- [Section 4.1.1] The phrase 'the environment does include packages as Plotly and lcviz' should read 'such as Plotly and lcviz.'
- [Figure 6] Adding a legend that clearly distinguishes the Datalabs spectrum from the original spectrum in both panels would improve interpretability, particularly for readers relying on the printed version.
- [Section 6.1] The statement 'A lack of deviations with discernible systematic pattern' would be more convincing if the per-energy-bin residuals were shown with their errors, rather than only through visual inspection of the ratio plot.
- [Abstract] The phrase 'setting the way for future adaptations' might be better rendered as 'paving the way for future adaptations.'
Circularity Check
No circularity: the replication claim rests on an empirical comparison, not on a self-referential derivation.
full rationale
This paper is a platform description and a case study; it contains no theoretical derivation chain whose outputs are defined in terms of its inputs. The central quantitative claim in Sec. 5.2 is that the Datalabs spectrum matches the original local SAS spectrum with a mean ratio deviation of δ = 0.0018. That claim is supported by an empirical comparison between two independently produced spectra: one generated from raw ODFs inside ESA Datalabs (SAS 21.0, October 2024 CCFs) and one generated earlier with a local SAS setup (SAS 20.0, April 2022 CCFs), the latter obtained via private communication with co-author C. M. Diez. The fact that the baseline spectrum comes from a co-author is a provenance and independence concern, not circularity: the Datalabs output is not constructed from the baseline spectrum, and the baseline was not derived from the Datalabs output. The paper explicitly identifies the likely cause of the residual as calibration-file and SAS-version differences, and it concedes in Sec. 5.2 that Datalabs does not ensure the same SAS versions and CCFs would be available for full reproducibility of research scripts. No parameter is fitted and then renamed a prediction; no uniqueness theorem is imported from the authors' prior work; no ansatz is smuggled in via citation. The self-citation to Diez et al. (2023) is simply the published analysis being replicated, which is the target of the comparison rather than a load-bearing justification of the platform's correctness. No specific reduction of the claimed result to its inputs is exhibited, so no circular step is identified.
Assumptions & free parameters
assumptions (5)
- domain assumption SAS task outputs are deterministic for fixed software version, calibration files, and input parameters.
- domain assumption The pySAS wrapper faithfully translates Python calls into equivalent SAS command-line executions.
- domain assumption The private-communication spectrum from C. M. Diez represents the local SAS output of the original analysis without error.
- ad hoc to paper Differences between SAS 21.0 with Oct 2024 CCFs and SAS 20.0 with Apr 2022 CCFs are the dominant source of the observed deviations.
- domain assumption A single Vela X-1 observation in EPIC-pn timing mode is representative of general XMM-Newton SAS workloads.
Cite this review
Pith. "Pith review of SAS in ESA Datalabs: A New Platform for XMM-Newton Analysis." pith.science (2026). https://pith.science/paper/7KCTIZFA
@misc{pith2026250614444,
  author       = {Pith},
  title        = {Pith review of: SAS in ESA Datalabs: A New Platform for XMM-Newton Analysis},
  year         = {2026},
  howpublished = {\url{https://pith.science/paper/7KCTIZFA}},
  note         = {Machine review of arXiv:2506.14444}
}
read the original abstract
XMM-Newton is a cornerstone mission of the European Space Agency (ESA) for X-ray astronomy, providing high-quality X-ray data for astrophysical research since the start of the century. Its Science Analysis System (SAS) has been a reliable data reduction and analysis software, evolving throughout the years to meet changing user needs, while incorporating new methods. This paper presents the XMM-SAS Datalab, a tool within the cloud-based ESA Datalabs platform, designed to enhance the interactivity and collaborative potential of SAS. By integrating SAS with a modern, Python-based JupyterLab interface, it enables shared analysis workspaces, removes the need for local software setup, and provides faster access through containerised environments and preconfigured libraries. Moving SAS to the cloud preserves a consistent software setup while eliminating installation complexities, saving time and effort. A case study of the X-ray binary Vela X-1 demonstrates that the Datalabs platform reliably replicates local SAS outputs, with minimal deviations attributed to calibration file versions. The XMM-SAS Datalab allows straightforward X-ray data analysis with collaborative process, setting the way for future adaptations in e-science platforms and multi-wavelength astronomy, while offering traceability and reproducibility of scientific results.
Figures


Figures from the paper (4 more)


Reference graph
Works this paper leans on
-
[9]
The XMM-Newton optical /UV monitor telescope. Astron. Astrophys. 365, L36–L44. doi: 10.1051/0004-6361:20000044, arXiv:astro-ph/0011216. Navarro, V ., del Rio, S., Diego, M.A., Lopez-Caniego, M., Marinic, F., Kruk, S., Reerink, J., Arviset, C.,
-
[11]
The European Photon Imaging Camera on XMM-Newton: The pn-CCD camera. Astron. Astrophys. 365, L18–L26. doi:10.1051/0004-6361:20000066. STScI,
-
[12]
Sciserver: A science platform for astronomy and beyond. Astron. Com- put. 33, 100412. URL: http://dx.doi.org/10.1016/j.ascom.2020. 100412, doi:10.1016/j.ascom.2020.100412. Turner, M.J.L., Abbey, A., Arnaud, M., Balasini, M., Barbera, M., Belsole, E., Bennie, P.J., Bernard, J.P., Bignami, G.F., Boer, M., Briel, U., Butler, I., Cara, C., Chabaud, C., Cole, ...
arXiv 2020
-
[13]
The European Photon Imaging Camera on XMM-Newton: The MOS cameras. Astron. Astrophys. 365, L27–L35. doi: 10.1051/0004-6361:20000087, arXiv:astro-ph/0011498. Watanabe, S., Sako, M., Ishida, M., Ishisaki, Y ., Kahn, S.M., Kohmura, T., Nagase, F., Paerels, F., Takahashi, T.,
-
[15]
https://www.cosmos.esa.int/web/ xmm-newton/ccf-release-notes
Xmm-newton current calibration file release notes. https://www.cosmos.esa.int/web/ xmm-newton/ccf-release-notes . Accessed: 2025-02-05. Zoghbi, A., Nguyen, D.T.,
work page 2025
-
[57]
doi:10.1086/149312. den Herder, J.W., Brinkman, A.C., Kahn, S.M., Branduardi-Raymont, G., Thomsen, K., Aarts, H., Audard, M., Bixler, J.V ., den Boggende, A.J., Cot- tam, J., Decker, T., Dubbeldam, L., Erd, C., Goulooze, H., G ¨udel, M., Gut- tridge, P., Hailey, C.J., Janabi, K.A., Kaastra, J.S., de Korte, P.A.J., van Leeuwen, B.J., Mauche, C., McCalden, ...
-
[421]
XMM-Newton Science Operations Centre,
URL:https: //dx.doi.org/10.1086/507458, doi:10.1086/507458. XMM-Newton Science Operations Centre,
-
[2001]
The Reflection Grating Spectrometer on board XMM- Newton. Astron. Astrophys. 365, L7–L17. doi: 10.1051/0004-6361: 20000058. Diez, C.M., Grinberg, V ., F ¨urst, F., El Mellah, I., Zhou, M., Santangelo, A., Mart´ınez-N´u˜nez, S., Amato, R., Hell, N., Kretschmar, P.,
Show all 15 references
-
[2008]
High variability in vela x-1: giant flares and o ff states. Astron. Astrophys. 492, 511–525. URL: http://dx.doi.org/10.1051/0004-6361:200809956, doi:10. 1051/0004-6361:200809956. Lomaeva, M., Grinberg, V ., Guainazzi, M., Hell, N., Bianchi, S., Bissinger n´e K ¨uhnel, M., F ¨u...
-
[2017]
(Eds.), The X-ray Universe 2017, p
XMM-Newton Science Analysis System (SAS): medium and long term strategy, in: Ness, J.U., Migliari, S. (Eds.), The X-ray Universe 2017, p
2017
-
[2020]
A&A 641, A144
High-resolution x-ray spec- troscopy of the stellar wind in vela x-1 during a flare. A&A 641, A144. URL: https://doi.org/10.1051/0004-6361/202037807, doi:10.1051/0004-6361/202037807. Lumb, D., Gondoin, P., Erd, C., Much, R., Jansen, F.,
-
[2021]
Case study of a well-known X-ray binary and the limits of our knowledge
Revisiting the archetypical wind accretor Vela X-1 in depth. Case study of a well-known X-ray binary and the limits of our knowledge. Astron. Astrophys. 652, A95. doi:10.1051/0004-6361/202040272, arXiv:2104.13148. Kreykenbohm, I., Wilms, J., Kretschmar, P., Torrej ´on, J.M., P...
-
[2022]
Continuum, cyclotron line, and absorption variability in the high- mass X-ray binary Vela X-1. Astron. Astrophys. 660, A19. doi: 10.1051/ 0004-6361/202141751, arXiv:2201.04169. Gabriel, C.,
-
[2023]
Observing the onset of the accretion wake in Vela X-1. Astron. Astrophys. 674, A147. doi:10.1051/0004-6361/202245708, arXiv:2303.09631. Diez, C.M., Grinberg, V ., F¨urst, F., Sokolova-Lapa, E., Santangelo, A., Wilms, J., Pottschmidt, K., Mart ´ınez-N´u˜nez, S., Malacaria, C., ...
-
[2024]
Springer Nature Singapore, Singapore
ESA Datalabs: Digi- tal Innovation in Space Science. Springer Nature Singapore, Singapore. pp. 1–13. URL: https://doi.org/10.1007/978-981-97-0041-7_1 , doi:10.1007/978-981-97-0041-7_1 . Smithsonian Astrophysical Observatory,
Reviewed August 7, 2026 · model on record in the stance chip above.
Discussion (0). Continue with ORCID to comment.