REVIEW 1 major objections 4 minor 48 references
The ASAS-SN Low Surface Brightness Survey I: Proof-of-Concept and Potential Applications
T0 review · 1 major / 4 minor · reviewed 2026-08-07 · deepseek-v4-flash
Pith's one-line read Stacked ASAS-SN images reach a median 3-sigma g-band limit of 26.1 mag arcsec^-2 per pixel and recover 82 percent of ultra-diffuse galaxies with effective radius at least 16 arcseconds in the DES footprint.
desk verdict A genuinely useful proof-of-concept for an all-sky LSB atlas; the per-pixel depth numbers are fine, but the extended-source sensitivity is not yet demonstrated because flat-field gradients are acknowledged but unquantified. read the letter →
The pith
A machine-rendered reading of the paper's core claim, the machinery that carries it, and where it could break.
The reading
What carries the argument
The stacker scales each exposure by its median sky value before coadding; because the variance in blank sky is proportional to the sky level, the sum of I_i/S_i is an inverse-variance-weighted mean equivalent to I_i/$sigma_i^{2}$, the optimal way to combine noisy backgrounds. Iterative pixel-by-pixel 3-$\sigma$ outlier rejection cleans cosmic rays and moving objects, and the top 10 percent of images with the highest sky backgrounds are discarded. For the galaxy search, stars are first masked or PSF-subtracted using Gaia proper-motion and parallax cuts plus Gaussian and Moffat profile fits, and sources are then found with SourceExtractor using a 3x3-pixel kernel, supplemented by visual inspection.
What would settle it
Compute the residual background rms of the final stacked images after applying a 2D polynomial flat-field correction (as described in Section 4) on fields away from the Galactic plane; if the residual rms is larger than the nominal 3-$\sigma$ surface brightness limit of 26.1 mag $arcsec^{-2}$, the effective depth for extended sources is below the quoted value. Also cross-check detected ultra-diffuse galaxies against higher-resolution DES or Legacy images to confirm that sources near ASAS-SN field edges are real and not flat-field artifacts.
Extended reading notes
Core claim
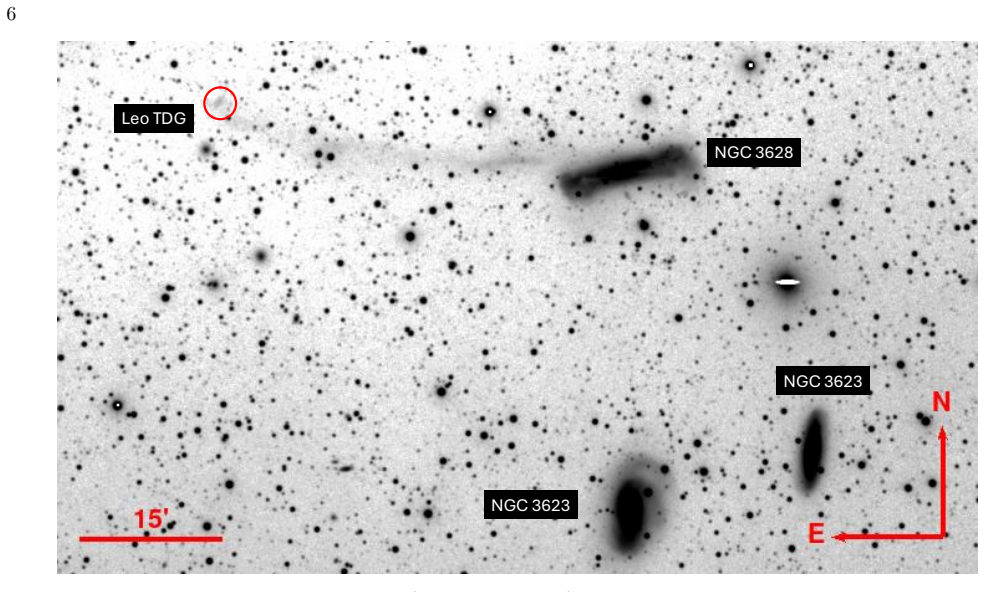
This paper claims that stacking about seven years of g-band ASAS-SN images, taken with 7.8-arcsecond pixels and median exposure times near 58 hours per field, reaches a median 3-$\sigma$ surface brightness limit of 26.1 mag $arcsec^{-2}$ per pixel for fields more than 20 degrees from the Galactic plane. It recovers 37 of 92 SMUDGes ultra-diffuse galaxies automatically and 38 more by visual inspection, for an 82 percent recovery rate among UDGs with effective radius at least 16 arcseconds in the DES footprint. The same stacks reveal Milky Way nebulae spanning several degrees, Galactic cirrus, and tidal features around NGC 3628 and NGC 474, which the authors present as proof that a time-domain survey can double as a wide-area low-surface-brightness survey.
Load-bearing premise
The load-bearing premise is that the stacked images can be trusted at low surface brightness across each field even though the calibration frames used to correct the camera's uneven response are only accurate to about one percent and create wide, smooth gradients across the image; if those gradients add correlated background structure at the level of the quoted limits, the true sensitivity for extended objects is lower and the recovery rate is optimistic.
Editorial extensions
If this is right
- Seventy-five percent of all ASAS-SN fields, and 97 percent of fields more than 20 degrees from the Galactic plane, reach surface brightness limits of 24 mag arcsec^-2 or deeper, the formal threshold of the low-surface-brightness regime.
- An LMC-like dwarf galaxy could be detected out to roughly 45 Mpc and an SMC-like dwarf to roughly 20 Mpc, so an all-sky search with these stacks can find nearby dwarf galaxies that previous surveys missed.
- The atlas resolves tidal tails and shells around nearby galaxies, enabling surface brightness profiles of galaxy halos to be measured over the whole sky.
- The same data can be used to produce an all-sky Galactic cirrus map, helping to mask regions of diffuse dust contamination for deeper surveys.
- A public, full-sky g-band low-surface-brightness mosaic is the planned end product, giving the community access to these images.
Reading between the lines
- The paper leaves implicit that, because the flat-field gradients limit reliability near field edges, the 82 percent recovery rate may be a conservative estimate for large galaxies away from edges; applying the 2D polynomial correction described in Section 4 before the next search should push the usable area deeper.
- Combining all cameras per field, rather than only the best single camera, would recover the full cumulative exposure time and could deepen the stacks by roughly the 0.4 mag implied by the exposure-time comparison, opening up slightly fainter and more distant dwarfs.
- An all-sky cirrus map built from these stacks could serve as a foreground mask for upcoming deep surveys, separating Galactic dust emission from genuine extragalactic low-surface-brightness features.
- Because the ASAS-SN point-spread function is well matched to ultraviolet and infrared all-sky surveys, cross-correlating the same stacks at other wavelengths could help separate stellar streams from cirrus, a testable extension the paper identifies as a natural next step.
Editorial analysis
A structured set of objections, weighed in public.
Referee Report
Summary. This proof-of-concept paper describes the construction of stacked g-band images from roughly seven years of ASAS-SN data, covering the full sky with a median cumulative exposure time of 58.1 hours per field. The authors report a median 3-sigma surface brightness limit of 26.1 mag arcsec^-2 per 7.8-arcsecond pixel off the Galactic plane, illustrate the survey's ability to reveal Galactic nebulae, cirrus, and tidal features, and benchmark its performance by recovering 82% of ultra-diffuse galaxies from the SMUDGes catalog with effective radii of at least 16 arcseconds in the DES footprint. The paper concludes with a plan to release a public all-sky low-surface-brightness mosaic and to search for dwarf galaxies and cirrus.
Significance. If the claimed depth and recovery rate hold up, this dataset would be a unique community resource: no other survey currently combines all-sky coverage, roughly 26 mag arcsec^-2 surface brightness depth, and degree-scale angular reach. The paper has real strengths: calibration is tied to an external catalog (Refcat), the recovery benchmark uses the independent SMUDGes catalog, and the science figures convincingly show known low-surface-brightness structures. The main weaknesses are that the quoted depth is a per-pixel photon-noise number rather than a demonstrated extended-source sensitivity, and the UDG recovery test is not blind and reports no false-positive rate. The project is promising and within the scope of an astronomical instrumentation/methods journal, but the headline claims need additional support before they can be taken at face value.
major comments (1)
- [Section 3.3, final paragraph] The statement in Section 3.3 that an LMC-like object could be detected out to roughly 45 Mpc uses the nominal surface brightness limit without accounting for the correlated flat-field systematics discussed in Section 4. This distance estimate should be revisited once the background residual amplitude is measured, and the assumptions about angular size and aperture should be stated explicitly.
minor comments (4)
- [Abstract and Section 2] The abstract reports a median cumulative exposure time of 58.1 hours per field, but the surface brightness limits shown in Figure 1 are for the deepest single-camera stack, which contains on average only about 35% of the total exposure. Please clarify this distinction in the abstract and in the discussion of Figure 1 so that readers do not connect the 58.1-hour exposure to the 26.1 mag arcsec^-2 limit.
- [Section 3.2, Figure 5 caption] The caption states a surface brightness limit of 26.67 without giving units; please add mag arcsec^-2.
- [Section 3.3, Figure 7] The horizontal axis label uses 'g (mag/arcsec2)' while the text refers to central surface brightness; please use a consistent notation such as mu_g and define it in the caption.
- [References] The entries for Liu et al. 2023a and Liu et al. 2023b appear to refer to the same paper and DOI; if so, the duplicate citation should be corrected.
Circularity Check
No significant circularity: the depth limit is derived from stacked-image noise and external Refcat calibration, and the 82% recovery is benchmarked against the independent SMUDGes catalog.
full rationale
The paper's central quantitative claims are the median 3-sigma surface brightness limit of 26.1 mag arcsec^-2 and the 82% recovery of SMUDGes UDGs with effective radius at least 16 arcseconds. The surface brightness limit is computed per pixel from the stacked-image sky noise after scaling images by their median sky level, with the scaling described as equivalent to an optimal average, and the photometric calibration uses the external Refcat catalog. It is not fitted to any target catalog and does not depend on the recovery benchmark. The recovery rate is measured against the independent SMUDGes catalog, with detections crossmatched using Source Extractor and visual inspection; the benchmark is external to this paper, so the test is not circular. The paper's self-citations, such as Shappee et al. 2014 and Kochanek et al. 2017, describe the ASAS-SN instrument and data collection and are not load-bearing for the reported depth or recovery rate. The acknowledged approximately 1% flat-field inaccuracy producing degree-scale gradients is a limitation on extended-source sensitivity near field borders; this is a robustness and correctness concern rather than a circularity, because the quoted limit is explicitly per pixel and the recovery test does not assume the stacks are photon-noise-limited. No equation defines a target quantity in terms of itself, no fitted parameter is renamed as a prediction, and no uniqueness argument is imported from the authors' prior work to force a choice. Therefore no circular step is present.
Assumptions & free parameters
free parameters (3)
- Sky background image cut =
10%
- SourceExtractor convolution kernel =
3x3 pixels
- Star grouping radius =
11 pixels
assumptions (4)
- domain assumption Noise in blank sky regions scales as sigma_i^2 proportional to S_i
- domain assumption Median pixel value is a robust estimator of sky brightness
- domain assumption Refcat provides accurate photometric calibration
- domain assumption SMUDGes is a suitable external benchmark for LSBG recovery
Cite this review
Pith. "Pith review of The ASAS-SN Low Surface Brightness Survey I: Proof-of-Concept and Potential Applications." pith.science (2026). https://pith.science/paper/OIIY4RMZ
@misc{pith2026250614873,
  author       = {Pith},
  title        = {Pith review of: The ASAS-SN Low Surface Brightness Survey I: Proof-of-Concept and Potential Applications},
  year         = {2026},
  howpublished = {\url{https://pith.science/paper/OIIY4RMZ}},
  note         = {Machine review of arXiv:2506.14873}
}
abstract
The ASAS-SN Low Surface Brightness Survey utilizes the $\sim7$ years of g-band CCD data from ASAS-SN (The All-Sky Automated Survey for Supernovae) to create stacked images of the entire sky. It is significantly deeper than previous photographic surveys. Our median/95th percentile cumulative exposure time per field is 58.1/86.8 hours, and our median $3{\sigma}$ g-band surface brightness limit off the Galactic plane ($|b| > 20{\deg}$) is 26.1 mag arcsec$^{-2}$. We image large-scale diffuse structures within the Milky Way, such as multiple degree-spanning supernova remnants and star-forming nebulae, and tidal features of nearby galaxies. To quantify how effective our deep images are, we compare with a catalog of known ultra-diffuse galaxies and find a recovery rate of 82$\%$. In the future, we intend to use this data set to perform an all-sky search for new nearby dwarf galaxies, create an all-sky Galactic cirrus map, create an all-sky low surface brightness mosaic for public use, and more.
Figures


Figures from the paper (5 more)



Reference graph
Works this paper leans on
-
[1]
Abraham, R. G., & van Dokkum, P. G. 2014, PASP, 126, 55, doi: 10.1086/674875
doi:10.1086/674875 2014
-
[2]
B., Ferr´ e-Mateu, A., Forbes, D
Alabi, A. B., Ferr´ e-Mateu, A., Forbes, D. A., Romanowsky, A. J., & Brodie, J. P. 2020, MNRAS, 497, 626, doi: 10.1093/mnras/staa1992
-
[3]
1996, Astronomy and Astrophysics Supplement Series, 117, 393–404, doi: 10.1051/aas:1996164
Bertin, E., & Arnouts, S. 1996, Astronomy and Astrophysics Supplement Series, 117, 393–404, doi: 10.1051/aas:1996164
-
[4]
1997, Publications of the Astronomical Society of the Pacific, 109, 745, doi: 10.1086/133941
Bothun, G., Impey, C., & McGaugh, S. 1997, Publications of the Astronomical Society of the Pacific, 109, 745, doi: 10.1086/133941
doi:10.1086/133941 1997
-
[5]
Bullock, J. S., & Boylan-Kolchin, M. 2017, ARA&A, 55, 343, doi: 10.1146/annurev-astro-091916-055313
-
[6]
1998, AJ, 115, 2331, doi: 10.1086/300369
McDermott, J. 1998, AJ, 115, 2331, doi: 10.1086/300369
-
[7]
Danieli, S., Lokhorst, D., Zhang, J., et al. 2020, ApJ, 894, 119, doi: 10.3847/1538-4357/ab88a8 de Vaucouleurs, G., de Vaucouleurs, A., Corwin, Herold G., J., et al. 1991, Third Reference Catalogue of Bright Galaxies
-
[8]
Dey, A., Schlegel, D. J., Lang, D., et al. 2019, AJ, 157, 168, doi: 10.3847/1538-3881/ab089d
Show all 48 references
-
[9]
G., Gal, R
Djorgovski, S. G., Gal, R. R., Odewahn, S. C., et al. 1998, in Wide Field Surveys in Cosmology, ed. S. Colombi, Y. Mellier, & B. Raban, Vol. 14, 89, doi: 10.48550/arXiv.astro-ph/9809187 Gaia Collaboration, Vallenari, A., Brown, A. G. A., et al. 2023, A&A, 674, A1, doi: 10.1051...
-
[10]
2022, ApJ, 932, 44, doi: 10.3847/1538-4357/ac6750
Gilhuly, C., Merritt, A., Abraham, R., et al. 2022, ApJ, 932, 44, doi: 10.3847/1538-4357/ac6750
2022 doi
-
[11]
R., Lique, F., & Santa-Maria, M
Goicoechea, J. R., Lique, F., & Santa-Maria, M. G. 2022, A&A, 658, A28, doi: 10.1051/0004-6361/202142210
2022 doi
-
[12]
C., & Blair, A
Hambly, N. C., & Blair, A. 2024, RAS Techniques and Instruments, 3, 73, doi: 10.1093/rasti/rzae004
2024 doi
-
[13]
P., Giovanelli, R., & Roberts, M
Haynes, M. P., Giovanelli, R., & Roberts, M. S. 1979, ApJ, 229, 83, doi: 10.1086/156932
1979 doi
-
[14]
E., & van Gorkom, J
Hibbard, J. E., & van Gorkom, J. H. 1996, AJ, 111, 655, doi: 10.1086/117815
1996 doi
-
[15]
A., & Hartmann, L
Hillenbrand, L. A., & Hartmann, L. W. 1998, ApJ, 492, 540, doi: 10.1086/305076 Ivezi´ c,ˇZ., Kahn, S. M., Tyson, J. A., et al. 2019, ApJ, 873, 111, doi: 10.3847/1538-4357/ab042c
1998 doi
-
[16]
E., Hendel, D., et al
Kado-Fong, E., Greene, J. E., Hendel, D., et al. 2018, ApJ, 866, 103, doi: 10.3847/1538-4357/aae0f0
2018 doi
-
[17]
Kaisin, S. S. 2019, in IAU Symposium, Vol. 344, Dwarf Galaxies: From the Deep Universe to the Present, ed. K. B. W. McQuinn & S. Stierwalt, 377–380, doi: 10.1017/S1743921318005987
2019 doi
-
[18]
D., Karachentseva, V
Karachentsev, I. D., Karachentseva, V. E., Huchtmeier, W. K., & Makarov, D. I. 2004, The Astronomical Journal, 127, 2031–2068, doi: 10.1086/382905
2004 doi
-
[19]
E., & Karachentsev, I
Karachentseva, V. E., & Karachentsev, I. D. 1998, Astronomy and Astrophysics Supplement Series, 127, 409–419, doi: 10.1051/aas:1998109
1998 doi
-
[20]
2014, MNRAS, 440, 2944, doi: 10.1093/mnras/stu338
Kaviraj, S. 2014, MNRAS, 440, 2944, doi: 10.1093/mnras/stu338
2014 doi
-
[21]
S., Shappee, B
Kochanek, C. S., Shappee, B. J., Stanek, K. Z., et al. 2017, Publications of the Astronomical Society of the Pacific, 129, 104502, doi: 10.1088/1538-3873/aa80d9
2017 doi
-
[22]
M., Puget, J
Lamarre, J. M., Puget, J. L., Bouchet, F., et al. 2003, NewAR, 47, 1017, doi: 10.1016/j.newar.2003.09.006
2003 doi
-
[23]
M., Gromoll, S., Shara, M
Lanzetta, K. M., Gromoll, S., Shara, M. M., et al. 2023, PASP, 135, 015002, doi: 10.1088/1538-3873/acaee6
2023 doi
-
[24]
1982, ESO/Uppsala survey of the ESO(B) atlas
Lauberts, A. 1982, ESO/Uppsala survey of the ESO(B) atlas
1982
-
[25]
A., Graham, J
Levenson, N. A., Graham, J. R., Keller, L. D., & Richter, M. J. 1998, ApJS, 118, 541, doi: 10.1086/313136
1998 doi
-
[26]
G., et al
Liu, Q., Abraham, R., Martin, P. G., et al. 2023a, ApJ, 953, 7, doi: 10.3847/1538-4357/acdee3 —. 2023b, ApJ, 953, 7, doi: 10.3847/1538-4357/acdee3
-
[27]
C., Fanson, J., Schiminovich, D., et al
Martin, D. C., Fanson, J., Schiminovich, D., et al. 2005, ApJL, 619, L1, doi: 10.1086/426387
2005 doi
-
[28]
D., et al
Martinez-Delgado, D., Stein, M., Sakowska, J. D., et al. 2025, arXiv e-prints, arXiv:2504.02071, doi: 10.48550/arXiv.2504.02071
2025 doi
-
[29]
McConnachie, A. W. 2012, AJ, 144, 4, doi: 10.1088/0004-6256/144/1/4
2012 doi
-
[30]
M., Nesci, R., Rossi, C., et al
Mickaelian, A. M., Nesci, R., Rossi, C., et al. 2007, A&A, 464, 1177, doi: 10.1051/0004-6361:20066241
2007 doi
-
[31]
Miller, J. S. 1974, ApJ, 189, 239, doi: 10.1086/152794 Miville-Deschˆ enes, M.-A., & Lagache, G. 2005, ApJS, 157, 302, doi: 10.1086/427938
1974 doi
- [32]
-
[33]
2014, ApJ, 786, 144, doi: 10.1088/0004-637X/786/2/144
Urbanik, M. 2014, ApJ, 786, 144, doi: 10.1088/0004-637X/786/2/144
2014 doi
-
[34]
1973, Uppsala general catalogue of galaxies
Nilson, P. 1973, Uppsala general catalogue of galaxies
1973
-
[35]
1996, Principal Galaxy Catalogue
Paturel, G., Bottinelli, L., di Nella, H., et al. 1996, Principal Galaxy Catalogue. Second edition: PGC CD-ROM
1996
-
[36]
2023, The Astrophysical Journal Supplement Series, 265, 57, doi: 10.3847/1538-4365/acbfa7
Paudel, S., Yoon, S.-J., Yoo, J., et al. 2023, The Astrophysical Journal Supplement Series, 265, 57, doi: 10.3847/1538-4365/acbfa7
2023 doi
-
[37]
Quinn, P. J. 1984, ApJ, 279, 596, doi: 10.1086/161924
1984 doi
-
[38]
J., Mutlu-Pakdil, B., Jones, M
Sand, D. J., Mutlu-Pakdil, B., Jones, M. G., et al. 2022, ApJL, 935, L17, doi: 10.3847/2041-8213/ac85ee
2022 doi
-
[39]
D., & Mathis, J
Savage, B. D., & Mathis, J. S. 1979, ARA&A, 17, 73, doi: 10.1146/annurev.aa.17.090179.000445
1979
-
[40]
1980, ApJ, 237, 303, doi: 10.1086/157870
Schweizer, F. 1980, ApJ, 237, 303, doi: 10.1086/157870
1980 doi
-
[41]
J., Prieto, J
Shappee, B. J., Prieto, J. L., Grupe, D., et al. 2014, The Astrophysical Journal, 788, 48, doi: 10.1088/0004-637x/788/1/48
2014 doi
-
[42]
P., Carey, S., et al
Smith, N., Egan, M. P., Carey, S., et al. 2000, ApJL, 532, L145, doi: 10.1086/312578
2000 doi
- [43]
-
[44]
2021, The Astrophysical Journal Supplement Series, 252, 18, doi: 10.3847/1538-4365/abca89 The Dark Energy Survey Collaboration
Tanoglidis, D., Drlica-Wagner, A., Wei, K., et al. 2021, The Astrophysical Journal Supplement Series, 252, 18, doi: 10.3847/1538-4365/abca89 The Dark Energy Survey Collaboration. 2005, arXiv e-prints, astro, doi: 10.48550/arXiv.astro-ph/0510346
-
[45]
L., Denneau, L., Flewelling, H., et al
Tonry, J. L., Denneau, L., Flewelling, H., et al. 2018, ApJ, 867, 105, doi: 10.3847/1538-4357/aae386
2018 doi
-
[46]
J., Bridges, T
Turnbull, A. J., Bridges, T. J., & Carter, D. 1999, MNRAS, 307, 967, doi: 10.1046/j.1365-8711.1999.02724.x van den Bergh, S. 1966, AJ, 71, 922, doi: 10.1086/109987 van Maanen, A. 1916, ApJ, 44, 210, doi: 10.1086/142287
1999
-
[47]
L., Eisenhardt, P
Wright, E. L., Eisenhardt, P. R. M., Mainzer, A. K., et al. 2010, AJ, 140, 1868, doi: 10.1088/0004-6256/140/6/1868
2010 doi
-
[48]
2023, The Astrophysical Journal Supplement Series, 267, 27, doi: 10.3847/1538-4365/acdd71
Zaritsky, D., Donnerstein, R., Dey, A., et al. 2023, The Astrophysical Journal Supplement Series, 267, 27, doi: 10.3847/1538-4365/acdd71
2023 doi
Reviewed August 7, 2026 · model on record in the stance chip above.
Discussion (0). Continue with ORCID to comment.