REVIEW 5 major objections 5 minor 53 references
Atys: An Efficient Profiling Framework for Identifying Hotspot Functions in Large-scale Cloud Microservices
T0 review · 5 major / 5 minor · reviewed 2026-08-15 · deepseek-v4-flash
Pith's one-line read Atys shows that hotspot profiling of cloud microservices can be made roughly 87.6% cheaper by pruning uninformative threads and adapting sampling frequency, while keeping hotspot-function error near 0.58%.
desk verdict A plausible microservice profiling system whose headline numbers are undermined by an internal inconsistency in the FSP model. read the letter →
The pith
A machine-rendered reading of the paper's core claim, the machinery that carries it, and where it could break.
The reading
What carries the argument
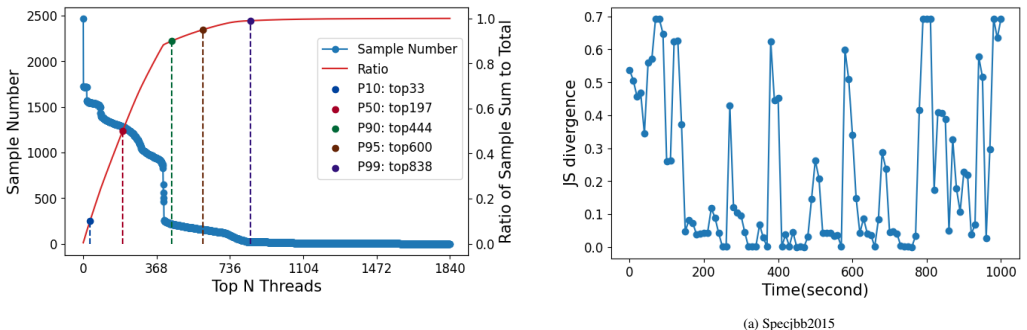
The load-bearing object is the P99 thread-pruning rule together with a Jensen–Shannon divergence gated frequency controller. P99 pruning treats a thread's sample count as a proxy for its informative worth, discarding all threads outside the smallest set that accounts for 99% of samples; because the number of threads (about 1,840 in the motivating run) is far smaller than the number of stack traces, sorting and cutting threads is cheap, and the paper fits simple models T(p) and MAPE(p) to choose the pruning percentage under a user-entered error bound. The FDA controller represents the top 10 hotspot functions' CPU-time shares as a probability distribution, compares consecutive 10-second windows with JS divergence, multiplies frequency by λ when the divergence is below the threshold θ for several windows, and divides by λ when it is above; this turns high-rate reference samples into anchors that substitute for low-rate samples during stable phases.
What would settle it
Run Atys on a long-lived production microservice whose request handling spawns short-lived threads, collect the full trace at a high rate, then re-rank the top 50 functions after P99 pruning; if the MAPE on function CPU time consistently exceeds the paper's 0.58%, the concentration assumption fails. A more direct check is to measure the cumulative sample share of the bottom pruned threads during a burst of rare, expensive requests and see whether it exceeds 1% then.
Extended reading notes
Core claim
The paper's central claim is that the call-stack data needed for hotspot-function identification in large distributed services can be drastically reduced without moving the answer. Atys prunes stack traces by thread: threads are ranked by sample count and all but the P99 threads—the smallest set covering 99% of samples—are dropped before aggregation; the remaining traces are aggregated at two levels so users see service-wide flamegraphs instead of per-instance snapshots. It then makes sampling frequency self-adjusting: the CPU-time distribution of the top ten hotspot functions is monitored across consecutive time windows, and the Jensen–Shannon divergence between consecutive distributions triggers exponential frequency increases or decreases. On the paper's cluster experiments, these two mechanisms yield a 6.8% aggregation-time reduction at 0.58% MAPE for the top 50 functions, and an 87.6% sampling-cost reduction at accuracy comparable to a 10,000 Hz sampling rate; the central collector stays near 175 MB memory and below 6% CPU when monitoring 1,000 instances.
Load-bearing premise
The load-bearing premise is that in any large cloud service a tiny fraction of threads accounts for almost all profiling samples, so the P99 rule can discard the rest without moving the hotspot ranking; if a real service spreads samples evenly across many short-lived threads, pruning would lose informative frames and the reported 0.58% error would not hold.
Editorial extensions
If this is right
- With FDA's cost reduction, continuous profiling can run by default on long-lived services instead of being started only for targeted investigations, since the average sampling rate and overhead drop by roughly an order of magnitude.
- FSP's thread-level pruning is a pre-aggregation step, so it can be applied to existing sampling profilers and monitoring pipelines without changing their kernels; any profiler that exposes per-thread stack traces could use it.
- Two-level aggregation makes service-level flamegraphs the primary view, removing per-instance variance and cutting the data moved to the central collector by about 99%; multi-level grouping extends this to fleets beyond 1,000 instances.
- The reported memory (around 175 MB for 1,000 monitored instances) and CPU (below 6%) footprints imply one central node can support a large production fleet, so profiling capacity no longer dominates deployment cost.
Reading between the lines
- The paper demonstrates the P99 concentration on two long-running workloads; a natural extension is to test whether the same concentration holds for short-lived serverless or request-per-thread microservices, where threads are born and die too quickly for the ranking to stabilize.
- The FDA controller's reliance on JS divergence between consecutive windows assumes periodicity; for non-periodic bursty workloads the same anchor-and-substitute idea could be made reactive to request-rate signals rather than to the sampling history itself.
- The paper leaves the threshold θ, decay λ, window length, and the number of top functions as user parameters; a natural follow-up is to auto-tune them from the fitted T(p)/MAPE(p) models, making the whole system parameter-free.
- If the pruning is performed at each aggregation level rather than only at local profilers, the aggregation time savings would compound with the level of the hierarchy; the paper's two-level design suggests but does not measure this compounding.
Signed reviews
Editorial analysis
A structured set of objections, weighed in public.
Referee Report
Summary. The paper presents Atys, a distributed profiling framework for large-scale cloud microservices. Atys combines a language-agnostic adaptation mechanism (async-profiler for Java, py-spy for Python, Perf for compiled languages), a two-level flamegraph aggregation method, a function selective pruning (FSP) strategy that retains only high-sample-count threads to reduce aggregation cost, and a frequency dynamic adjustment (FDA) scheme that adapts the sampling rate based on JS divergence between consecutive hotspot-function distributions. The evaluation on a 13-node cluster with SPECjbb2015 and VGG16 reports that FSP reduces aggregation time by 6.8% with 0.58% MAPE for the top 50 hotspot functions, and that FDA achieves MSE comparable to 10 kHz sampling at 12.4% of the cost (an 87.6% reduction). Scalability up to 1,000 monitored instances is claimed with about 175 MB memory and 6% CPU on the Prometheus server.
Significance. If substantiated, Atys would be a useful practical contribution: the architecture is clean, the workloads are realistic, and the open-source prototype is a reproducible artifact. The two key ideas—pruning uninformative daemon threads and adapting sampling frequency to workload periodicity—are sensible and could reduce profiling overhead in production. However, as written the paper's central quantitative claims are not internally consistent or fully evidenced: the FSP model in Section 5.3 contradicts the reported P99 results, the evaluation is in-sample and single-run, FSP is evaluated on only one benchmark despite the abstract's claim of two, the FDA sampling-rate figures disagree by an order of magnitude, and several supporting figures are missing placeholders. These issues must be resolved before the contributions can be accepted.
major comments (5)
- [Section 5.3, Eq. (1); Section 6.3, Figure 4] The fitted FSP models contradict the reported headline result. Section 5.3 defines p as the percentage of pruned threads and fits T(p) = -1.0614p + 114.44 and MAPE(p) = 984.368 * log(-0.001p + 1.099). The P99 configuration used in Section 6.3 prunes 1,002 of 1,840 threads, i.e. p = 54.5. Substituting p = 54.5 into the paper's own model gives T = 114.44 - 1.0614*54.5 ≈ 56.6, a 50.5% reduction from the p=0 baseline, not the claimed 6.8%; and MAPE ≈ 42.9% (natural log) or 18.6% (log base 10), not 0.58%. Solving the stated constraint MAPE(p) ≤ 0.58 yields p ≥ 98.4%, implying that 98.4% of threads would need to be pruned to achieve the claimed error, which is incompatible with the P99 threshold. The statement that T(p) and MAPE(p) are 'both monotonically increasing' is also inconsistent with the defined T(p), which decreases with p. The FSP claim is therefore not reproducible from the models presented in the paper, and a corrected model, a corrected definition of p, or a corrected error figure is required.
- [Section 5.3, 6.3, 6.4] The evaluation is in-sample for both FSP and FDA. The T(p) and MAPE(p) models in Section 5.3 are fitted to the same SPECjbb2015 run that is then used in Section 6.3 to report the 0.58% MAPE and 6.8% time reduction. Similarly, the FDA thresholds θ_specjbb = 0.5, θ_vgg = 0.05, and λ = 0.8 are selected after pre-profiling the same two workloads, and the accuracy/cost numbers in Section 6.4 are reported on those same workloads. There is no held-out workload, no cross-validation, and no discussion of how the reported error would change for a different service. The paper claims general applicability for large-scale microservices, but the evidence is consistent only with per-deployment tuning and in-sample estimation, which generally yields optimistic accuracy. Please provide out-of-sample results or clearly reframe the claims as per-deployment tuning demonstrations.
- [Abstract; Section 6.3] The abstract states that 'Cluster-scale experiments on two benchmarks show that the FSP strategy achieves a 6.8% reduction in time with a mere 0.58% MAPE', but the FSP evaluation in Section 6.3 is performed only on SPECjbb2015 ('we employ the function selective pruning strategy ... on the stack traces gathered from a specific execution of Specjbb2015'). No FSP results are reported for VGG16 or any other workload. The cross-benchmark claim in the abstract is therefore unsupported; please either report FSP results for the second benchmark or revise the abstract and introduction to attribute the FSP result to SPECjbb2015 alone.
- [Introduction vs. Section 6.4] The FDA sampling-rate figures are inconsistent by an order of magnitude. The introduction states that 'the FDA scheme, averaging a sampling rate of 3,578 Hz, yields results with a mean squared error (MSE) comparable to a 10,000 Hz sampling rate, at only 12.4% of the cost.' Section 6.4, however, reports that 'Atys has an average sampling frequency of 357.8Hz' for the Java benchmark, while also mentioning a comparison at '5,00Hz' (presumably 500 Hz). Since the 12.4% cost figure and the comparison to a 10 kHz baseline depend on which sampling rate is correct, the FDA cost/accuracy tradeoff cannot be evaluated as stated. Please correct the number and ensure the abstract, introduction, and evaluation are mutually consistent.
- [Section 4.2, Section 6.5, Figures 3 and 8] The manuscript contains unresolved figure placeholders for load-bearing results. Section 4.2 references 'Figure ?? and Figure ??' for the RandomGen flamegraph aggregation example and 'Figure ??' for the aggregated flamegraph, and Section 6.5 references 'Figure ??' for memory usage and 'Figure ??' for CPU usage; Figures 3(a)–3(c) and 8(a)–8(b) are shown in the text but the in-text citations are missing. The scalability claims of 175 MB memory and 6% CPU at 1,000 instances are presented without an associated readable figure or table, and the two-level aggregation example cannot be checked. Please fix all figure references and, ideally, provide numerical data for the scalability experiment.
minor comments (5)
- [Section 6.4] The text 'CPU usage comparable to async-profiler at 5,00Hz' appears to be a typo for '500 Hz'; please correct it.
- [Section 5.3] The phrases 'fitting MAPE=4.75' and 'fitting MAPE=15.73' are unclear; please define what these numbers represent (e.g., residual fit error, model MAPE, or something else).
- [Abstract and Section 6.3] The abstract refers to 'MAPE in stack traces aggregation' while Section 6.3 specifies MAPE for the top 5, 10, 20, and 50 hotspot functions; the abstract should match the actual metric definition.
- [Section 5.3] The sentence 'Since T(p) and MAPE(p) are both monotonically increasing' is inconsistent with the fitted form of T(p), which is decreasing; please correct the monotonicity statement or redefine T(p) to represent time saved rather than aggregation time.
- [Throughout evaluation] The quantitative claims are based on what appears to be a single run per configuration; reporting multiple runs with variance (e.g., mean and standard deviation) would substantially strengthen the credibility of the reported improvements.
Circularity Check
No construction-level circularity: the FSP/FDA headline numbers are measured outcomes, not outputs of the fitted parameter models.
full rationale
The paper's FSP and FDA claims are reported as experimental measurements in Section 6, not as consequences of the fitted models in Section 5.3. The Section 5.3 T(p)/MAPE(p) fits and Eq. (1) are a calibration procedure that selects an operating point (pruning percentage or JS-divergence threshold) from pre-profiling; the 0.58% MAPE and 6.8% aggregation-time reduction are then measured on the benchmark executions, so the headline numbers are not equivalent to the calibration inputs by construction. The calibration is intentionally service-specific ('different services have different performance characteristics...'), so using the same benchmark for tuning and evaluation is an in-sample weakness rather than a definitional circularity. The paper's own fitted equations are numerically inconsistent with the reported P99 result—substituting a P99 pruning ratio into the stated formulas gives about 43% MAPE and 50% time reduction, not 0.58% and 6.8%—which is a serious correctness/reproducibility problem but not a circularity. The only self-citation, ref [49], supports the periodic-variation motivation but is corroborated by the paper's own Figure 5 and is not load-bearing. Hence no circular step is identified.
Assumptions & free parameters
free parameters (5)
- pruning percentage p (default P99 threshold) =
P99 threads, i.e., top 838 of 1,840 threads in SPECjbb2015
- FDA JS-divergence threshold theta =
0.5 for SPECjbb2015, 0.05 for VGG16
- FDA decay rate lambda =
0.8
- Top-k functions for JS divergence =
10
- Linear and logarithmic model coefficients for T(p) and MAPE(p) =
T(p) = -1.0614p + 114.44; MAPE(p) = 984.368 * log(-0.001p + 1.099)
assumptions (4)
- domain assumption The concentration of profiling samples in a small subset of threads is a general property of large-scale microservices.
- domain assumption Hotspot function distributions exhibit periodic variation that can be captured by JS divergence over the top 10 functions.
- domain assumption The selected profiling kernels (async-profiler, py-spy, perf) produce accurate stack traces without perturbing the service.
- domain assumption CPU time of functions can be extrapolated linearly from sample counts at varying sampling frequencies.
Cite this review
Pith. "Pith review of Atys: An Efficient Profiling Framework for Identifying Hotspot Functions in Large-scale Cloud Microservices." pith.science (2026). https://pith.science/paper/QQI6RYMR
@misc{pith2026250615523,
  author       = {Pith},
  title        = {Pith review of: Atys: An Efficient Profiling Framework for Identifying Hotspot Functions in Large-scale Cloud Microservices},
  year         = {2026},
  howpublished = {\url{https://pith.science/paper/QQI6RYMR}},
  note         = {Machine review of arXiv:2506.15523}
}
read the original abstract
To handle the high volume of requests, large-scale services are comprised of thousands of instances deployed in clouds. These services utilize diverse programming languages and are distributed across various nodes as encapsulated containers. Given their vast scale, even minor performance enhancements can lead to significant cost reductions. In this paper, we introduce Atys1, an efficient profiling framework specifically designed to identify hotspot functions within large-scale distributed services. Atys presents four key features. First, it implements a language-agnostic adaptation mechanism for multilingual microservices. Second, a two-level aggregation method is introduced to provide a comprehensive overview of flamegraphs. Third, we propose a function selective pruning (FSP) strategy to enhance the efficiency of aggregating profiling results. Finally, we develop a frequency dynamic adjustment (FDA) scheme that dynamically modifies sampling frequency based on service status, effectively minimizing profiling cost while maintaining accuracy. Cluster-scale experiments on two benchmarks show that the FSP strategy achieves a 6.8% reduction in time with a mere 0.58% mean average percentage error (MAPE) in stack traces aggregation. Additionally, the FDA scheme ensures that the mean squared error (MSE) remains on par with that at high sampling rates, while achieving an 87.6% reduction in cost.
Figures


Figures from the paper (5 more)


Reference graph
Works this paper leans on
-
[1]
Google inc., Google search, https://www.google.com (2023)
work page 2023
-
[2]
Amazon inc., Amazon shop, https://www.amazon.com (2023)
work page 2023
-
[3]
D. Huye, Y . Shkuro, R. R. Sambasivan, Lifting the veil on Meta’s microservice architecture: Analyses of topology and request workflows, in: 2023 USENIX Annual Technical Conference (USENIX ATC 23), USENIX Association, Boston, MA, 2023, pp. 419–432, https://www.usenix.org/conference/atc23/presentation/huye
work page 2023
-
[4]
L. A. Barroso, U. Hölzle, P. Ranganathan, The Dat- acenter as a Computer: Designing Warehouse-Scale 12 (a) Memory usage (b) CPU usage Figure 8: Memory and CPU usage of the Prometheus server with varying numbers of monitoring instances. Machines, Third Edition, Synthesis Lectures on Com- puter Architecture, Morgan & Claypool Publishers, 2018. doi:10.2200/S...
-
[5]
D. Merkel, Docker: lightweight linux con- tainers for consistent development and de- ployment, Linux Journal 2014 (2014) 2, https://api.semanticscholar.org/CorpusID:62479797
work page 2014
-
[6]
A. C. de Melo, Red Hat, The new linux ’perf’ tools, Tech. rep., Red Hat Inc., http://oldvger.kernel.org/ acme/perf/lk2010-perf-paper .pdf(2010)
work page 2010
-
[7]
Intel Corporation, Intel vtune, https://www.intel.com/content/www/us /en/docs/vtune-profiler/user-guide/2023-0/overview.html, (2023)
work page 2023
-
[8]
S. L. Graham, P. B. Kessler, M. K. Mckusick, Gprof: A call graph execution profiler, in: Proceedings of the 1982 SIG- PLAN Symposium on Compiler Construction, SIGPLAN ’82, Association for Computing Machinery, New York, NY , USA, 1982, p. 120–126. doi:10.1145/800230.806987
arXiv 1982
Show all 53 references
-
[9]
G. Ren, E. Tune, T. Moseley, Y . Shi, S. Rus, R. Hundt, Google-wide profiling: A continuous profiling infrastruc- ture for data centers, IEEE Micro 30 (4) (2010) 65–79. doi:10.1109/MM.2010.68
2010 doi
-
[10]
Adhianto, S
L. Adhianto, S. Banerjee, M. W. Fagan, M. Krentel, G. Marin, J. M. Mellor-Crummey, N. R. Tallent, HPC- TOOLKIT: tools for performance analysis of optimized parallel programs, Concurr. Comput. Pract. Exp. 22 (6) (2010) 685–701. doi:10.1002/CPE.1553
2010 doi
-
[11]
Pyroscope, Inc, pyroscope, https://pyroscope.io/ (2023)
2023
-
[12]
Gregg, Flame graphs, https://www.brendangregg.com/flamegraphs.html (2020)
B. Gregg, Flame graphs, https://www.brendangregg.com/flamegraphs.html (2020)
2020
-
[13]
Standard Performance Evaluation Corporation, 13 Specjbb2015, https://www.spec.org/jbb2015/ (2023)
2023
-
[14]
Simonyan, A
K. Simonyan, A. Zisserman, Very deep convolutional net- works for large-scale image recognition, in: Y . Bengio, Y . LeCun (Eds.), 3rd International Conference on Learn- ing Representations, ICLR 2015, San Diego, CA, USA, May 7-9, 2015, Conference Track Proceedings, 2015. arXi...
2015 arXiv
-
[15]
H. Xu, Q. Wang, S. Song, L. K. John, X. Liu, Can we trust profiling results?: understanding and fixing the inac- curacy in modern profilers, in: R. Eigenmann, C. Ding, S. A. McKee (Eds.), Proceedings of the ACM Interna- tional Conference on Supercomputing, ICS 2019, Phoenix, A...
2019
-
[16]
J. Yi, B. Dong, M. Dong, H. Chen, On the precision of pre- cise event based sampling, in: T. Kim, P. P. C. Lee (Eds.), APSys ’20: 11th ACM SIGOPS Asia-Pacific Workshop on Systems, Tsukuba, Japan, August 24-25, 2020, ACM, 2020, pp. 98–105. doi:10.1145/3409963.3410490
2020
-
[17]
Rice University, Hpctoolkit, http://hpctoolkit.org (2023)
2023
-
[18]
Burchell, O
H. Burchell, O. Larose, S. Marr, Towards realistic results for instrumentation-based profilers for jit-compiled sys- tems, in: Proceedings of the 21st ACM SIGPLAN In- ternational Conference on Managed Programming Lan- guages and Runtimes, MPLR 2024, Vienna, Austria, 19 Septemb...
2024
-
[19]
T. Ball, J. R. Larus, Efficient path profiling, in: Proceedings of the 29th Annual ACM/IEEE International Symposium on Microarchitecture, MICRO 29, IEEE Computer Society, USA, 1996, p. 46–57. doi:10.1109/MICRO.1996.566449
1996
-
[20]
Google Inc., Package pprof, https://golang.google.cn/pkg/runtime/pprof/ (2023)
2023
-
[21]
Python Software Foundation, The python profilers, https://docs.python.org/3/library/profile.htm (2023)
2023
-
[22]
OpenJS Foundation and Node.js contributors, Easy profiling for node.js applications, https://nodejs.org/en/docs/guides/simple-profiling (2023)
2023
-
[23]
al., async-profiler, https://github.com/async-profiler/async-profiler (2017)
Andrei Pangin et. al., async-profiler, https://github.com/async-profiler/async-profiler (2017)
2017
-
[24]
ej-technologies GmbH, The award- winning all-in-one java profiler, https://www.ej-technologies.com/products/jprofiler/overview.html (2023)
2023
-
[25]
Oracle Corporation, Package java.lang.instrument, https://docs.oracle.com/javase/1.5.0/docs/api/java /lang/instrument/package-summary.html(2010)
2010
-
[26]
Oracle Corporation, Jep 435: Asynchronous stack trace vm api,https://openjdk.org/jeps/435(2023)
2023
-
[27]
Optimyze Inc., Prodfiler, https://prodfiler.com (2021)
2021
-
[28]
Google Inc., Google cloud profiler, https://cloud.google.com/profiler/(2023)
2023
-
[29]
Silicon Graphics Inc., Aconex, Red Hat, Performance co- pilot,https://pcp.io(2023)
2023
-
[30]
Zabbix LLC., The all-in-one, open-source solution that lets you monitor anything, https://www.zabbix.com (2023)
2023
-
[31]
Prometheus Authors, Prometheus system, https://prometheus.io/ docs/introduction/overview/(2023)
2023
-
[32]
P. Su, S. Jiao, M. Chabbi, X. Liu, Pinpointing performance inefficiencies via lightweight variance profiling, in: Pro- ceedings of the International Conference for High Perfor- mance Computing, Networking, Storage and Analysis, SC ’19, Association for Computing Machinery, New ...
2019
-
[33]
T. E. Carlson, S. Nilakantan, M. Hempstead, W. Heirman, Epoch profiles: Microarchitecture-based application analy- sis and optimization, IEEE Computer Architecture Letters 14 (1) (2015) 30–33. doi:10.1109/LCA.2014.2329873
2015
-
[34]
F. B. Moreira, M. A. Z. Alves, M. Diener, P. O. A. Navaux, I. Koren, Profiling and reducing micro-architecture bot- tlenecks at the hardware level, in: 2014 IEEE 26th International Symposium on Computer Architecture and High Performance Computing, 2014, pp. 222–229. doi:10.110...
2014 doi
-
[35]
Mytkowicz, P
T. Mytkowicz, P. F. Sweeney, M. Hauswirth, A. Diwan, Time interpolation: So many metrics, so few registers, in: 40th Annual IEEE/ACM International Symposium on Microarchitecture (MICRO 2007), 2007, pp. 286–300. doi:10.1109/MICRO.2007.27
2007 doi
-
[36]
Azimi, M
R. Azimi, M. Stumm, R. W. Wisniewski, Online perfor- mance analysis by statistical sampling of microprocessor performance counters, in: Proceedings of the 19th Annual International Conference on Supercomputing, ICS ’05, As- sociation for Computing Machinery, New York, NY , USA...
2005
-
[37]
Mathur, J
W. Mathur, J. Cook, Improved estimation for software mul- tiplexing of performance counters, in: 13th IEEE Interna- tional Symposium on Modeling, Analysis, and Simulation of Computer and Telecommunication Systems, 2005, pp. 23–32. doi:10.1109/MASCOTS.2005.34. 14
2005 doi
-
[38]
Hauswirth, A
M. Hauswirth, A. Diwan, P. F. Sweeney, M. C. Mozer, Automating vertical profiling, in: Proceedings of the 20th Annual ACM SIGPLAN Conference on Object- Oriented Programming, Systems, Languages, and Ap- plications, OOPSLA ’05, Association for Computing Machinery, New York, NY ,...
2005
-
[39]
Ehlers, A
J. Ehlers, A. van Hoorn, J. Waller, W. Hasselbring, Self- adaptive software system monitoring for performance anomaly localization, in: Proceedings of the 8th ACM International Conference on Autonomic Computing, ICAC ’11, Association for Computing Machinery, New York, NY , USA...
2011
-
[40]
H. K. Cho, T. Moseley, R. Hank, D. Bruening, S. Mahlke, Instant profiling: Instrumentation sampling for profil- ing datacenter applications, in: Proceedings of the 2013 IEEE/ACM International Symposium on Code Generation and Optimization (CGO), 2013, pp. 1–10. doi:10.1109/CGO....
2013
-
[41]
Becker, M
D. Becker, M. Geimer, R. Rabenseifner, F. Wolf, Synchro- nizing the timestamps of concurrent events in traces of hybrid mpi/openmp applications, in: 2010 IEEE Interna- tional Conference on Cluster Computing, 2010, pp. 38–47. doi:10.1109/CLUSTER.2010.13
2010 doi
-
[42]
Benavides, K
Z. Benavides, K. V ora, R. Gupta, Dprof: distributed pro- filer with strong guarantees, Proc. ACM Program. Lang. 3 (OOPSLA) (2019) 1–24. doi:10.1145/3360582
2019 doi
-
[43]
S. Yang, J. Jeong, B. Scholz, B. Burgstaller, Cloudpro- filer: Tsc-based inter-node profiling and high-throughput data ingestion for cloud streaming workloads (2023). arXiv:2205.09325
2023 arXiv
-
[44]
Curtsinger, E
C. Curtsinger, E. D. Berger, Coz: finding code that counts with causal profiling, Commun. ACM 61 (6) (2018) 91–99. doi:10.1145/3205911
2018 doi
-
[45]
M. Ahn, D. Kim, T. Nam, J. Jeong, Scoz: A system- wide causal profiler for multicore systems, Software: Practice and Experience 51 (5) (2021) 1043–1058. doi:10.1002/spe.2930
2021 doi
-
[46]
Prometheus Authors, Prometheus metric types, https://prometheus.io/docs/concepts/metric_types/ (2023)
2023
-
[47]
al., py-spy, https://github.com/benfred/py-spy(2023)
Ben Frederickson et. al., py-spy, https://github.com/benfred/py-spy(2023)
2023
-
[48]
E. Garcia, Programming languages en- dorsed for server-side use at meta, https://engineering.fb.com/2022/07/27/developer-tools/ programming-languages-endorsed-for-server-side-use-at-meta/ (2024)
2024
-
[49]
Q. Hua, D. Yang, S. Qian, H. Hu, J. Cao, G. Xue, Kae- informer: A knowledge auto-embedding informer for fore- casting long-term workloads of microservices, in: Proceed- ings of the ACM Web Conference 2023, WWW ’23, As- sociation for Computing Machinery, New York, NY , USA, 202...
2023
-
[50]
Q. Fan, Q. Wang, Performance comparison of web servers with different architectures: A case study using high con- currency workload, in: 2015 Third IEEE Workshop on Hot Topics in Web Systems and Technologies (HotWeb), 2015, pp. 37–42. doi:10.1109/HotWeb.2015.11
2015 doi
-
[51]
Krizhevsky, Learning multiple layers of features from tiny images, Tech
A. Krizhevsky, Learning multiple layers of features from tiny images, Tech. rep., University of Toronto, https://www.cs.toronto.edu/ kriz/ learning-features-2009-TR.pdf(2009)
2009
-
[52]
Lin, Divergence measures based on the shannon entropy, IEEE Transactions on Information Theory 37 (1) (1991) 145–151
J. Lin, Divergence measures based on the shannon entropy, IEEE Transactions on Information Theory 37 (1) (1991) 145–151. doi:10.1109/18.61115
1991 doi
-
[53]
The Kubernetes Authors, Production-grade container or- chestration,https://kubernetes.io(2024). 15
2024
Reviewed August 15, 2026 · model on record in the stance chip above.
Discussion (0). Continue with ORCID to comment.