REVIEW 4 major objections 5 minor 74 references
Data-Driven Heat Pump Management: Combining Machine Learning with Anomaly Detection for Residential Hot Water Systems
T0 review · 4 major / 5 minor · reviewed 2026-08-07 · deepseek-v4-flash
Pith's one-line read On six real Swedish households, a LightGBM forecaster predicts mid-tank hot-water temperature more accurately than LSTM variants, and an isolation forest turns those predictions into a household-specific shower-event calendar, supporting…
desk verdict A useful real-world forecasting benchmark undercut by unsupported anomaly-detection metrics and an unresolved data-split contradiction. read the letter →
The pith
A machine-rendered reading of the paper's core claim, the machinery that carries it, and where it could break.
The reading
What carries the argument
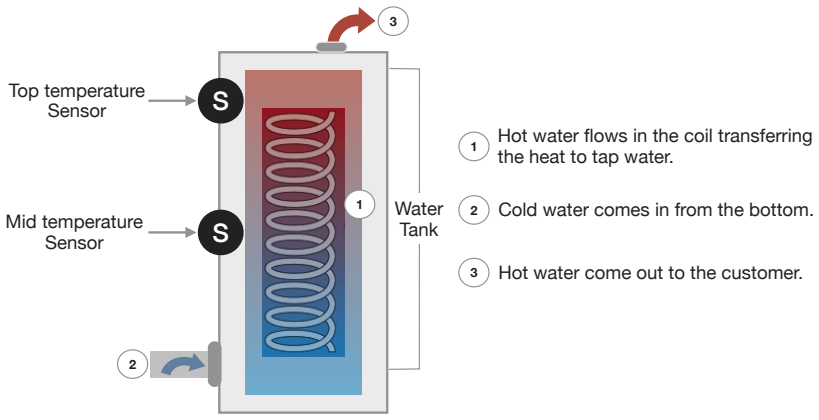
The load-bearing object is the mid-tank temperature $t_{\text{mid}}$, which drops sharply when hot water is drawn and therefore encodes both the household's demand and the start/stop needs of the heat pump. The models are trained on lagged temperature features $t_{\text{mid}}(10)$, $t_{\text{mid}}(20)$, $t_{\text{mid}}(30)$, $t_{\text{mid}}(90)$, the corresponding $t_{\text{top}}$ lags, current $t_{\text{top}}$, and the week number. LightGBM, a gradient-boosting tree method using gradient-based one-side sampling and exclusive feature bundling, supplies the forecast; isolation forest, which scores each point by the path length needed to isolate it in random decision trees, supplies the anomaly detection that identifies shower events. The paper's mechanism is the combination: forecast first, then isolate unusually sharp temperature drops, then aggregate the detected events into a demand calendar that decides when the heat pump should start producing hot water.
What would settle it
Inspect the preprocessing pipeline or rerun it exactly, and test for leakage by checking whether any row in the test period contributed to the lagged values used for training. Concretely, retrain LightGBM on data split strictly by timestamp with no shuffling and recompute RMSE and $R^2$; if the numbers match the paper's, the split was clean, and if they are materially worse, the published scores are inflated by future information.
Extended reading notes
Core claim
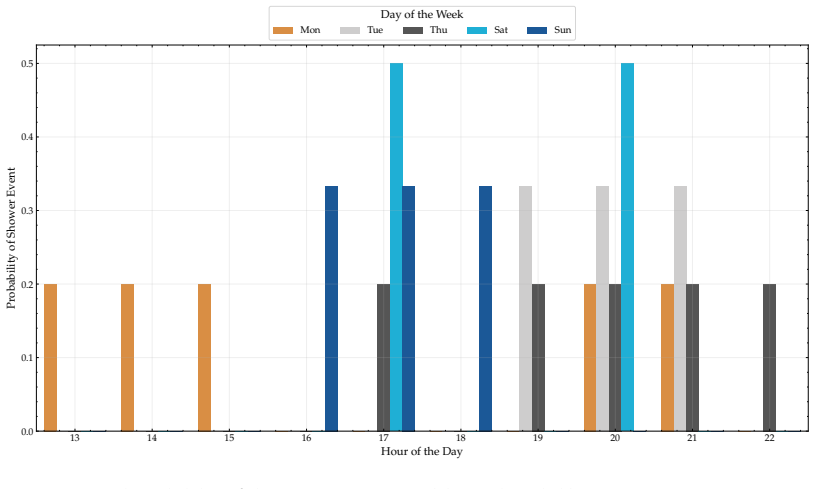
On the paper's own terms, the discovery is that a lightweight gradient-boosting forecaster, LightGBM, predicts the mid-tank temperature of a residential hot water tank more accurately than recurrent models (LSTM and bidirectional LSTM with self-attention), and that an unsupervised isolation forest can then turn those predictions into a reliable household-specific calendar of shower events. The claim is that this two-stage design makes demand-responsive heat pump control practical without per-household thresholds: the model consumes ten lagged sensor values for the top and middle tank temperatures plus the current top temperature and week number, predicts future mid-tank temperature, and the iForest flags the sharp drops that indicate hot water use. Across six installations the RMSE improvement over LSTM reaches 9.37%, and the shower-event detector reaches F1 0.87 with a false-alarm rate of 5.2%.
Load-bearing premise
The reported accuracy depends on the 85/15 split being chronological and leakage-free; the data-processing diagram's label 'Shuffling and random split of data' conflicts with the date-based train/test ranges in the experimental setup, and if shuffling preceded the split, the lag features would expose near-future values during training.
Editorial extensions
If this is right
- A heat pump controller that knows the household's predicted demand can start hot water production before expected shower times rather than only after temperature falls below a threshold.
- The same trained forecaster can be retuned per household, since the paper finds household-specific LightGBM tuning is needed while the anomaly detector carries over without per-household thresholds.
- The two-stage pipeline could be applied to other appliances or time series where a physical variable, such as temperature, pressure, or flow, drops sharply during usage events.
- Because LightGBM trains in about a third of the time of the LSTM variants, the approach is more feasible for resource-constrained edge controllers.
- The shower-event calendar gives a concrete weekly operating schedule from the data, not from fixed assumptions about when people use hot water.
Reading between the lines
- Inference: because the paper never measures electricity consumption or energy savings from the generated calendar, the practical payoff of the approach would need a randomized field trial that compares threshold-based and forecast-based control under matched weather and occupancy.
- Inference: the split inconsistency should be resolved before the numeric claims are taken at face value; a strictly chronological rerun is the first check a deploying engineer would run.
- Inference: the forecast-then-isolate pattern is portable to other usage-correlated physical signals, such as flow, pressure, or appliance current draw, but the weekly calendar construction assumes fairly regular household routines and would need a separate treatment for irregular consumers.
- Inference: the paper's own admission that no ablation study was run leaves open which features, especially the ten-minute lag versus the full lag set, carry the forecast skill; a feature ablation would be an inexpensive next experiment.
Editorial analysis
A structured set of objections, weighed in public.
Referee Report
Summary. The paper proposes a data-driven pipeline for residential heat-pump hot-water management: three machine-learning models (LightGBM, LSTM, and a BiLSTM with self-attention, called attLSTM) are trained to forecast the mid-tank temperature tmid, and an isolation-forest (iForest) module is applied to the forecast to detect shower events, from which a household-specific hot-water demand calendar is derived. The evaluation is conducted on six real Swedish households. The paper reports that LightGBM outperforms the LSTM variants with RMSE improvements up to 9.37% and R2 values between 0.748 and 0.983, and that the iForest anomaly detector achieves an F1-score of 0.87 with a false alarm rate of 5.2%. The central claim is that this composite approach can steer heat-pump hot-water production more responsively than conventional threshold-based control.
Significance. If the reported results are valid, the paper would provide a useful application-level contribution: real sensor data from six households, a comparison of three model families with explicit hyperparameter search spaces, and a concrete anomaly-detection step aimed at producing shower-event calendars. The paper also reports computational training times and documents the data-preprocessing choices, which is helpful for reproducibility. However, the two headline results are not yet supported. The anomaly-detection metrics appear only in the abstract and introduction, with no labeled evaluation in the experimental sections. The forecasting evaluation is threatened by an unresolved contradiction about whether the data were shuffled before the chronological split, which would invalidate the reported error metrics. These are load-bearing gaps rather than presentation issues.
major comments (4)
- [Figure 2; Section 5.2.1; Section 6.1; Table 2] There is an unresolved contradiction about the data split that directly affects the validity of Table 7. Figure 2 lists 'Shuffling and random split of data' inside the Data Processing block, while Section 5.2.1 and Section 6.1 describe an 85/15 split of the data into training and testing, and Table 2 gives contiguous chronological date ranges for the two parts. Because the feature set in Table 3 includes lagged values tmid(10), tmid(20), tmid(30), and tmid(90) and the target is a future value of tmid, a random shuffle before the split would place test rows within minutes of training rows. Given the strong autocorrelation of tank temperature, the model could then effectively copy or interpolate near-identical sensor readings rather than forecast, inflating the reported R2, RMSE, and MAPE values. The authors must clarify whether rows were shuffled before or after the split, and if shuffling was applied, the evaluation must be rerun on a strictly chronological split.
- [Abstract and Section 1 vs. Section 6.5] The claimed anomaly-detection performance, F1-score of 0.87 and false alarm rate of 5.2%, is reported in the abstract and introduction but is never derived in the methods or results sections. Section 6.5 applies iForest to the forecast window for household 4 and shows detected shower events in Figure 8, but no ground-truth labels, confusion matrix, precision/recall computation, or evaluation equation are provided. The abstract's quantitative claim is therefore unsupported. The authors should either add an explicit anomaly-detection evaluation protocol with labeled events or remove these numbers from the headline claims.
- [Section 5.1.5 and Section 7] The false alarm rate of 5.2% appears to be essentially determined by the hand-set iForest contamination rate. Section 5.1.5 states that the contamination rate is preset to 0.05 for all households, and Section 7 repeats that the contamination rate was chosen after experimentation but without reporting those experiments. With no labeled anomalies, the false alarm rate cannot be computed independently, and the F1-score is not defined. The authors should state how false alarms and F1 were computed, and how the choice of contamination rate affects these metrics.
- [Section 6.3 and Table 6] Table 6 does not report the final hyperparameter values used for LightGBM; it reproduces the search ranges (e.g., 'Max Depth 5, 10, 30', 'Learning Rate 0.001, 0.01, 0.1') rather than the selected values for each household. This makes the headline model comparison irreproducible. The final selected hyperparameters for LightGBM should be reported for each household, as is done for the LSTM models.
minor comments (5)
- [Section 5.2.2] The feature-selection step is described as using 'partial OLS regression', but the method is not defined or cited; please clarify what 'partial' means here so that the feature-selection procedure can be reproduced.
- [Section 6.5] The text refers to 'Figure 6.5' before Figure 8; the figure numbering should be corrected.
- [Section 8] The section states that limitations are categorized into two main areas, but then lists three categories: model-specific limitations, data quality dependencies, and dataset considerations.
- [Throughout] The notation is inconsistent: 'R2' should be written as R^2 or R², and the attention-based model is variously called 'attLSTM', 'BiLSTM with attention', and 'Bi-LSTM with Attention'.
- [Section 6.2] Equation (11) contains an odd LaTeX rendering ('/radicaltp/radicalvertex/radicalvertex√') that should be replaced with a proper square-root symbol.
Circularity Check
Anomaly-detection metrics reduce to the hand-set iForest contamination rate; the forecast comparison is not circular, though its split is leakage-ambiguous.
-
fitted input called prediction
[Section 5.1.5 (contamination), Section 8 (Limitations, tuning), Abstract (F1/FAR), Section 7 (unsupervised choice)]
"'The contamination rate chosen for all the use cases in this paper is 0.05.' ... 'we selected a contamination rate of 0.05 after rounds of experimentation with multiple different rates.' ... 'For anomaly detection, our iForest implementation achieved an F1-score of 0.87 with a false alarm rate of only 5.2%.' ... 'data labeling for every household is typically challenging and expensive to perform... iForest as an unsupervised anomaly detection method is preferred.'"
The 0.05 contamination parameter tells iForest what fraction of the training data is anomalous; in iForest the contamination value sets the decision threshold, so the proportion flagged is 5% by construction. The paper's 'false alarm rate of only 5.2%' is therefore the chosen contamination prior (plus the 30-minute post-processing filter), not an independently measured error rate. Since Section 7 justifies iForest as unsupervised because labeling is 'challenging and expensive,' no external ground-truth label set for shower events is described; the F1-score of 0.87 cannot be verified against independent labels and is consistent with being computed from the model's own anomaly assignments.
full rationale
The forecasting contribution is not circular: inputs are past and current sensor values (tmid(90), tmid(30), tmid(20), tmid(10), ttop(90), ttop(30), ttop(20), ttop(10), ttop, Week) and the target is a future tmid value; no equation defines the prediction as one of its inputs. The unresolved 'Shuffling and random split of data' statement in Figure 2 versus the chronological dates and 85/15 split in Section 5.2.1/Table 2 is a potential data-leakage threat to Table 7, but leakage is a correctness problem, not circularity. The circularity is localized to the anomaly-detection headline: Section 5.1.5 fixes the iForest contamination rate to 0.05 for all households, Section 8 says this rate was selected 'after rounds of experimentation,' and the abstract reports a false alarm rate of only 5.2%. Because contamination directly sets the fraction of data iForest labels anomalous, the reported false alarm rate is essentially the tuned input restated as a measured outcome. Section 7 also justifies iForest as unsupervised because labeling is 'challenging and expensive,' and no external ground-truth labels or F1 computation protocol are described for shower events, so the 0.87 F1-score is not anchored to an independent label set. The only self-citation (ref. 11, co-authored by B.S. Ahmed) appears in related-work context and is not load-bearing. Overall: one of the two headline results is partially self-referential; the forecasting comparison retains independent content. Score 6.
Assumptions & free parameters
free parameters (3)
- iForest contamination rate =
0.05
- Post-processing window for merging shower events =
30 minutes
- Lag set for forecasting features =
{10, 20, 30, 90} minutes
assumptions (4)
- domain assumption Sensor data recorded only on change are accurately reconstructed by forward-fill.
- domain assumption tmid is a sufficient proxy for household hot water demand.
- domain assumption The 85/15 split is chronological and leakage-free.
- domain assumption iForest anomaly scores correspond to actual shower events without labeled ground truth.
Cite this review
Pith. "Pith review of Data-Driven Heat Pump Management: Combining Machine Learning with Anomaly Detection for Residential Hot Water Systems." pith.science (2026). https://pith.science/paper/YNCPHIAK
@misc{pith2026250615719,
  author       = {Pith},
  title        = {Pith review of: Data-Driven Heat Pump Management: Combining Machine Learning with Anomaly Detection for Residential Hot Water Systems},
  year         = {2026},
  howpublished = {\url{https://pith.science/paper/YNCPHIAK}},
  note         = {Machine review of arXiv:2506.15719}
}
abstract
Heat pumps (HPs) have emerged as a cost-effective and clean technology for sustainable energy systems, but their efficiency in producing hot water remains restricted by conventional threshold-based control methods. Although machine learning (ML) has been successfully implemented for various HP applications, optimization of household hot water demand forecasting remains understudied. This paper addresses this problem by introducing a novel approach that combines predictive ML with anomaly detection to create adaptive hot water production strategies based on household-specific consumption patterns. Our key contributions include: (1) a composite approach combining ML and isolation forest (iForest) to forecast household demand for hot water and steer responsive HP operations; (2) multi-step feature selection with advanced time-series analysis to capture complex usage patterns; (3) application and tuning of three ML models: Light Gradient Boosting Machine (LightGBM), Long Short-Term Memory (LSTM), and Bi-directional LSTM with the self-attention mechanism on data from different types of real HP installations; and (4) experimental validation on six real household installations. Our experiments show that the best-performing model LightGBM achieves superior performance, with RMSE improvements of up to 9.37\% compared to LSTM variants with $R^2$ values between 0.748-0.983. For anomaly detection, our iForest implementation achieved an F1-score of 0.87 with a false alarm rate of only 5.2\%, demonstrating strong generalization capabilities across different household types and consumption patterns, making it suitable for real-world HP deployments.
Figures


Figures from the paper (7 more)


Reference graph
Works this paper leans on
-
[1]
Gaur, A.S.; Fitiwi, D.Z.; Curtis, J. Heat pumps and our low-carbon future: A comprehensive review, Energy Research & Social Science 2021, 71, 101764
work page 2021
-
[2]
Energy flexible heat pumps in industrial energy systems: A review, Energy Reports 2023, 9, 386--394
Sadjjadi, B.S.; Gerdes, J.N.; Sauer, A. Energy flexible heat pumps in industrial energy systems: A review, Energy Reports 2023, 9, 386--394
work page 2023
-
[3]
Machine Learning and Deep Learning in Energy Systems: A Review, Sustainability 2022, 14 (8)
Forootan, M.M.; Larki, I.; Zahedi, R.; Ahmadi, A. Machine Learning and Deep Learning in Energy Systems: A Review, Sustainability 2022, 14 (8)
work page 2022
-
[4]
Ahmad, T.; Zhang, H.; Yan, B. A review on renewable energy and electricity requirement forecasting models for smart grid and buildings, Sustainable Cities and Society 2020, 55, 102052
work page 2020
-
[5]
Ukoba, K.; Olatunji, K.O.; Adeoye, E.; Jen, T.C.; Madyira, D.M. Optimizing renewable energy systems through artificial intelligence: Review and future prospects, Energy & Environment 2024, 35 (7), 3833--3879
work page 2024
-
[6]
Heating up the global heat pump market, Nature Energy 2022, 7 (10), 901--904
Rosenow, J.; Gibb, D.; Nowak, T.; Lowes, R. Heating up the global heat pump market, Nature Energy 2022, 7 (10), 901--904
work page 2022
-
[7]
Song, Y.; Peskova, M.; Rolando, D.; Zucker, G.; Madani, H. Estimating electric power consumption of in-situ residential heat pump systems: A data-driven approach, Applied Energy 2023, 352, 121971
work page 2023
-
[8]
Antonopoulos, I.; Robu, V.; Couraud, B.; Kirli, D.; Norbu, S.; Kiprakis, A.; Flynn, D.; Elizondo-Gonzalez, S.; Wattam, S. Artificial intelligence and machine learning approaches to energy demand-side response: A systematic review, Renewable and Sustainable Energy Reviews 2020, 130, 109899
work page 2020
Show all 74 references
-
[9]
Data-driven soft sensors targeting heat pump systems, Energy Conversion and Management 2023, 279, 116769
Song, Y.; Rolando, D.; Avellaneda, J.M.; Zucker, G.; Madani, H. Data-driven soft sensors targeting heat pump systems, Energy Conversion and Management 2023, 279, 116769
2023
-
[10]
Recent advances in the analysis of residential electricity consumption and applications of smart meter data, Applied Energy 2017, 208, 402--427
Yildiz, B.; Bilbao, J.; Dore, J.; Sproul, A. Recent advances in the analysis of residential electricity consumption and applications of smart meter data, Applied Energy 2017, 208, 402--427
2017
-
[11]
DA-LSTM: A dynamic drift-adaptive learning framework for interval load forecasting with LSTM networks, Engineering Applications of Artificial Intelligence 2023, 123, 106480
Bayram, F.; Aupke, P.; Ahmed, B.S.; Kassler, A.; Theocharis, A.; Forsman, J. DA-LSTM: A dynamic drift-adaptive learning framework for interval load forecasting with LSTM networks, Engineering Applications of Artificial Intelligence 2023, 123, 106480
2023
-
[12]
Deep Learning in Fault Detection and Diagnosis of building HVAC Systems: A Systematic Review with Meta Analysis, Energy and AI 2023, 12, 100235
Zhang, F.; Saeed, N.; Sadeghian, P. Deep Learning in Fault Detection and Diagnosis of building HVAC Systems: A Systematic Review with Meta Analysis, Energy and AI 2023, 12, 100235
2023
-
[13]
A systematic review of machine learning techniques related to local energy communities, Renewable and Sustainable Energy Reviews 2022, 170, 112651
Hernandez-Matheus, A.; Löschenbrand, M.; Berg, K.; Fuchs, I.; Aragüés-Peñalba, M.; Bullich-Massagué, E.; Sumper, A. A systematic review of machine learning techniques related to local energy communities, Renewable and Sustainable Energy Reviews 2022, 170, 112651
2022
-
[14]
An application of the artificial neural network to optimise the energy performances of a magnetic refrigerator, International Journal of Refrigeration 2017, 82, 238--251
Aprea, C.; Greco, A.; Maiorino, A. An application of the artificial neural network to optimise the energy performances of a magnetic refrigerator, International Journal of Refrigeration 2017, 82, 238--251
2017
-
[15]
Artificial intelligence models for refrigeration, air conditioning and heat pump systems, Energy Reports 2022, 8, 8451--8466
Adelekan, D.; Ohunakin, O.; Paul, B. Artificial intelligence models for refrigeration, air conditioning and heat pump systems, Energy Reports 2022, 8, 8451--8466
2022
-
[16]
A deep learning framework for building energy consumption forecast, Renewable and Sustainable Energy Reviews 2021, 137, 110591
Somu, N.; Raman M R , G.; Ramamritham, K. A deep learning framework for building energy consumption forecast, Renewable and Sustainable Energy Reviews 2021, 137, 110591
2021
-
[17]
A review on machine learning forecasting growth trends and their real-time applications in different energy systems, Sustainable Cities and Society 2020, 54, 102010
Ahmad, T.; Chen, H. A review on machine learning forecasting growth trends and their real-time applications in different energy systems, Sustainable Cities and Society 2020, 54, 102010
2020
-
[18]
Bayesian approach and time series dimensionality reduction to LSTM-based model-building for fault diagnosis of a reciprocating compressor, Neurocomputing 2020, 380, 51--66
Cabrera, D.; Guamán, A.; Zhang, S.; Cerrada, M.; Sánchez, R.V.; Cevallos, J.; Long, J.; Li, C. Bayesian approach and time series dimensionality reduction to LSTM-based model-building for fault diagnosis of a reciprocating compressor, Neurocomputing 2020, 380, 51--66
2020
-
[19]
An optimized model using LSTM network for demand forecasting, Computers & Industrial Engineering 2020, 143, 106435
Abbasimehr, H.; Shabani, M.; Yousefi, M. An optimized model using LSTM network for demand forecasting, Computers & Industrial Engineering 2020, 143, 106435
2020
-
[20]
Fault detection and diagnosis of large-scale HVAC systems in buildings using data-driven methods: A comprehensive review, Energy and Buildings 2020, 229, 110492
Mirnaghi, M.S.; Haghighat, F. Fault detection and diagnosis of large-scale HVAC systems in buildings using data-driven methods: A comprehensive review, Energy and Buildings 2020, 229, 110492
2020
-
[21]
Large-scale heat pumps: Applications, performance, economic feasibility and industrial integration, Renewable and Sustainable Energy Reviews 2020, 133, 110219
Schlosser, F.; Jesper, M.; Vogelsang, J.; Walmsley, T.; Arpagaus, C.; Hesselbach, J. Large-scale heat pumps: Applications, performance, economic feasibility and industrial integration, Renewable and Sustainable Energy Reviews 2020, 133, 110219
2020
-
[22]
A long short-term memory artificial neural network to predict daily HVAC consumption in buildings, Energy and Buildings 2020, 216, 109952
Sendra-Arranz, R.; Guti \'e rrez, A. A long short-term memory artificial neural network to predict daily HVAC consumption in buildings, Energy and Buildings 2020, 216, 109952
2020
-
[23]
Short-term electricity consumption forecast with artificial neural networks—A case study of office buildings, In 2017 IEEE Manchester PowerTech, IEEE, 2017; pp 1--6
Xypolytou, E.; Meisel, M.; Sauter, T. Short-term electricity consumption forecast with artificial neural networks—A case study of office buildings, In 2017 IEEE Manchester PowerTech, IEEE, 2017; pp 1--6
2017
-
[24]
Using long short-term memory networks to predict energy consumption of air-conditioning systems, Sustainable Cities and Society 2020, 55, 102000
Zhou, C.; Fang, Z.; Xu, X.; Zhang, X.; Ding, Y.; Jiang, X.; et al. Using long short-term memory networks to predict energy consumption of air-conditioning systems, Sustainable Cities and Society 2020, 55, 102000
2020
-
[25]
A hybrid model approach for forecasting future residential electricity consumption, Energy and Buildings 2016, 117, 341--351
Dong, B.; Li, Z.; Rahman, S.M.; Vega, R. A hybrid model approach for forecasting future residential electricity consumption, Energy and Buildings 2016, 117, 341--351
2016
-
[26]
Naug, A.; Biswas, G. A data driven method for prediction of energy demand in commercial buildings, In 2018 IEEE 14th International Conference on Automation Science and Engineering (CASE), IEEE, 2018; pp 335--340
2018
-
[27]
Short-term residential load forecasting based on LSTM recurrent neural network, IEEE transactions on smart grid 2017, 10 (1), 841--851
Kong, W.; Dong, Z.Y.; Jia, Y.; Hill, D.J.; Xu, Y.; Zhang, Y. Short-term residential load forecasting based on LSTM recurrent neural network, IEEE transactions on smart grid 2017, 10 (1), 841--851
2017
-
[28]
Building thermal load prediction through shallow machine learning and deep learning, Applied Energy 2020, 263, 114683
Wang, Z.; Hong, T.; Piette, M.A. Building thermal load prediction through shallow machine learning and deep learning, Applied Energy 2020, 263, 114683
2020
-
[29]
A novel energy demand prediction strategy for residential buildings based on ensemble learning, Energy Procedia 2019, 158, 3411--3416
Huang, Y.; Yuan, Y.; Chen, H.; Wang, J.; Guo, Y.; Ahmad, T. A novel energy demand prediction strategy for residential buildings based on ensemble learning, Energy Procedia 2019, 158, 3411--3416. Innovative Solutions for Energy Transitions
2019
-
[30]
Oil and gold price prediction using optimized fuzzy inference system based extreme learning machine, Resources Policy 2022, 79, 103109
Das, S.; Sahu, T.P.; Janghel, R.R. Oil and gold price prediction using optimized fuzzy inference system based extreme learning machine, Resources Policy 2022, 79, 103109
2022
-
[31]
Das, S.; Sahu, T.; Janghel, R.; Sahu, B. Effective forecasting of stock market price by using extreme learning machine optimized by PSO-based group oriented crow search algorithm, Neural Computing and Applications 2022, 34
2022
-
[32]
Sahu, R.K.; Shaw, B.; Nayak, J.R.; Shashikant. Short/medium term solar power forecasting of Chhattisgarh state of India using modified TLBO optimized ELM, Engineering Science and Technology, an International Journal 2021, 24 (5), 1180--1200. ://www.sciencedirect.com/science/ar...
2021
-
[33]
Revolutionizing Sustainable Energy Production with Quantum Artificial Intelligence: Applications in Autonomous Robotics and Data Management, Green and Low-Carbon Economy 2023
Baklaga, L. Revolutionizing Sustainable Energy Production with Quantum Artificial Intelligence: Applications in Autonomous Robotics and Data Management, Green and Low-Carbon Economy 2023
2023
-
[34]
A Semi-Supervised Modulation Identification in MIMO Systems: A Deep Learning Strategy, IEEE Access 2022, 10, 76622--76635
Bouchenak, S.; Merzougui, R.; Harrou, F.; Dairi, A.; Sun, Y. A Semi-Supervised Modulation Identification in MIMO Systems: A Deep Learning Strategy, IEEE Access 2022, 10, 76622--76635
2022
-
[35]
Automatic fault detection in grid-connected photovoltaic systems via variational autoencoder-based monitoring, Energy Conversion and Management 2024, 314, 118665
Harrou, F.; Dairi, A.; Taghezouit, B.; Khaldi, B.; Sun, Y. Automatic fault detection in grid-connected photovoltaic systems via variational autoencoder-based monitoring, Energy Conversion and Management 2024, 314, 118665. ://www.sciencedirect.com/science/article/pii/S019689042400606X
2024
-
[36]
TransNAS-TSAD: Harnessing Transformers for Multi-Objective Neural Architecture Search in Time Series Anomaly Detection, Neural Computing & Applications 2024
Haq, I.U.; Lee, B.S.; Rizzo, D.M. TransNAS-TSAD: Harnessing Transformers for Multi-Objective Neural Architecture Search in Time Series Anomaly Detection, Neural Computing & Applications 2024. Available Online
2024
-
[37]
Peak Anomaly Detection from Environmental Sensor-Generated Watershed Time Series Data, In Information Management and Big Data
Lee, B.S.; Kaufmann, J.C.; Rizzo, D.M.; Haq, I.U. Peak Anomaly Detection from Environmental Sensor-Generated Watershed Time Series Data, In Information Management and Big Data. SIMBig 2022; Lossio-Ventura, J.A., Valverde-Rebaza, J., Díaz, E., Alatrista-Salas, H., Eds.; Springe...
2022
-
[38]
General review of ground-source heat pump systems for heating and cooling of buildings, Energy and Buildings 2014, 70, 441--454
Sarbu, I.; Sebarchievici, C. General review of ground-source heat pump systems for heating and cooling of buildings, Energy and Buildings 2014, 70, 441--454
2014
-
[39]
Machine learning-based performance prediction for ground source heat pump systems, Geothermics 2022, 105, 102509
Zhang, X.; Wang, E.; Liu, L.; Qi, C. Machine learning-based performance prediction for ground source heat pump systems, Geothermics 2022, 105, 102509
2022
-
[40]
Ahmed, N.; Assadi, M.; Ahmed, A.A.; Banihabib, R. Optimal design, operational controls, and data-driven machine learning in sustainable borehole heat exchanger coupled heat pumps: Key implementation challenges and advancement opportunities, Energy for Sustainable Development 2...
2023
-
[41]
RNN-LSTM: From applications to modeling techniques and beyond—Systematic review, Journal of King Saud University - Computer and Information Sciences 2024, 36 (5), 102068
Al-Selwi, S.M.; Hassan, M.F.; Abdulkadir, S.J.; Muneer, A.; Sumiea, E.H.; Alqushaibi, A.; Ragab, M.G. RNN-LSTM: From applications to modeling techniques and beyond—Systematic review, Journal of King Saud University - Computer and Information Sciences 2024, 36 (5), 102068
2024
-
[42]
A Lightweight Concept Drift Detection and Adaptation Framework for IoT Data Streams, IEEE Internet of Things Magazine 2021, 4 (2), 96--101
Yang, L.; Shami, A. A Lightweight Concept Drift Detection and Adaptation Framework for IoT Data Streams, IEEE Internet of Things Magazine 2021, 4 (2), 96--101
2021
-
[43]
Light gradient boosting machine with optimized hyperparameters for identification of malicious access in IoT network, Digital Communications and Networks 2023, 9 (1), 125--137
Mishra, D.; Naik, B.; Nayak, J.; Souri, A.; Dash, P.B.; Vimal, S. Light gradient boosting machine with optimized hyperparameters for identification of malicious access in IoT network, Digital Communications and Networks 2023, 9 (1), 125--137
2023
-
[44]
Intrusion detection model of Internet of Things based on LightGBM, IEICE Transactions on Communications 2023, 106 (8), 622--634
Zhao, G.; Wang, Y.; Wang, J. Intrusion detection model of Internet of Things based on LightGBM, IEICE Transactions on Communications 2023, 106 (8), 622--634
2023
-
[45]
Multi-sensor Data Fusion Method Based on ARIMA-LightGBM for AGV Positioning, In 2021 5th International Conference on Robotics and Automation Sciences (ICRAS), 2021; pp 272--276
Che, H. Multi-sensor Data Fusion Method Based on ARIMA-LightGBM for AGV Positioning, In 2021 5th International Conference on Robotics and Automation Sciences (ICRAS), 2021; pp 272--276
2021
-
[46]
Parmezan, A.R.S.; Souza, V.M.; Batista, G.E. Evaluation of statistical and machine learning models for time series prediction: Identifying the state-of-the-art and the best conditions for the use of each model, Information Sciences 2019, 484, 302--337
2019
-
[47]
Long short-term memory, Neural computation 1997, 9 (8), 1735--1780
Hochreiter, S.; Schmidhuber, J. Long short-term memory, Neural computation 1997, 9 (8), 1735--1780
1997
-
[48]
A review of data-driven approaches for prediction and classification of building energy consumption, Renewable and Sustainable Energy Reviews 2018, 82, 1027--1047
Wei, Y.; Zhang, X.; Shi, Y.; Xia, L.; Pan, S.; Wu, J.; Han, M.; Zhao, X. A review of data-driven approaches for prediction and classification of building energy consumption, Renewable and Sustainable Energy Reviews 2018, 82, 1027--1047
2018
-
[49]
A comparative performance analysis of different activation functions in LSTM networks for classification, Neural Computing and Applications 2019, 31, 2507--2521
Farzad, A.; Mashayekhi, H.; Hassanpour, H. A comparative performance analysis of different activation functions in LSTM networks for classification, Neural Computing and Applications 2019, 31, 2507--2521
2019
-
[50]
LSTM inefficiency in long-term dependencies regression problems, Journal of Advanced Research in Applied Sciences and Engineering Technology 2023, 30 (3), 16--31
Al-Selwi, S.M.; Hassan, M.F.; Abdulkadir, S.J.; Muneer, A. LSTM inefficiency in long-term dependencies regression problems, Journal of Advanced Research in Applied Sciences and Engineering Technology 2023, 30 (3), 16--31
2023
-
[51]
A survey on anomaly detection for technical systems using LSTM networks, Computers in Industry 2021, 131, 103498
Lindemann, B.; Maschler, B.; Sahlab, N.; Weyrich, M. A survey on anomaly detection for technical systems using LSTM networks, Computers in Industry 2021, 131, 103498. ://www.sciencedirect.com/science/article/pii/S0166361521001056
2021
-
[52]
A novel attLSTM framework combining the attention mechanism and bidirectional LSTM for demand forecasting, Expert Systems with Applications 2024, 254, 124409
Cui, L.; Chen, Y.; Deng, J.; Han, Z. A novel attLSTM framework combining the attention mechanism and bidirectional LSTM for demand forecasting, Expert Systems with Applications 2024, 254, 124409
2024
-
[53]
Paraphrase detection using LSTM networks and handcrafted features, Multimedia Tools and Applications 2021, 80 (4), 6479--6492
Shahmohammadi, H.; Dezfoulian, M.; Mansoorizadeh, M. Paraphrase detection using LSTM networks and handcrafted features, Multimedia Tools and Applications 2021, 80 (4), 6479--6492
2021
-
[54]
Zhou, P.; Shi, W.; Tian, J.; Qi, Z.; Li, B.; Hao, H.; Xu, B. Attention-based bidirectional long short-term memory networks for relation classification, In Proceedings of the 54th annual meeting of the association for computational linguistics (volume 2: Short papers), 2016; pp...
2016
-
[55]
Feng, T.; Zhao, Y.; Shi, H.; Li, H.; Zhang, X.; Wang, G.; Badawi, R.D.; Price, P.M.; Jones, T.; Cherry, S.R. The effects of delay on the input function for early dynamics in total body parametric imaging, In 2019 IEEE Nuclear Science Symposium and Medical Imaging Conference (N...
2019
-
[56]
Unidirectional and bidirectional LSTM models for short-term traffic prediction, Journal of Advanced Transportation 2021, 2021 (1), 5589075
Abduljabbar, R.L.; Dia, H.; Tsai, P.W. Unidirectional and bidirectional LSTM models for short-term traffic prediction, Journal of Advanced Transportation 2021, 2021 (1), 5589075
2021
-
[57]
Extended Isolation Forest, IEEE Transactions on Knowledge and Data Engineering 2021, 33 (4), 1479--1489
Hariri, S.; Kind, M.C.; Brunner, R.J. Extended Isolation Forest, IEEE Transactions on Knowledge and Data Engineering 2021, 33 (4), 1479--1489
2021
-
[58]
Anomaly detection: A survey, ACM Comput
Chandola, V.; Banerjee, A.; Kumar, V. Anomaly detection: A survey, ACM Comput. Surv. 2009, 41 (3)
2009
-
[59]
New Trends in Time Series Anomaly Detection., In EDBT, 2023; pp 847--850
Boniol, P.; Paparizzos, J.; Palpanas, T. New Trends in Time Series Anomaly Detection., In EDBT, 2023; pp 847--850
2023
-
[60]
An In-Depth Study and Improvement of Isolation Forest, IEEE Access 2022, 10, 10219--10237
Chabchoub, Y.; Togbe, M.U.; Boly, A.; Chiky, R. An In-Depth Study and Improvement of Isolation Forest, IEEE Access 2022, 10, 10219--10237
2022
-
[61]
l-DBSCAN : A Fast Hybrid Density Based Clustering Method, In 18th International Conference on Pattern Recognition (ICPR'06), 2006; Vol
Viswanath, P.; Pinkesh, R. l-DBSCAN : A Fast Hybrid Density Based Clustering Method, In 18th International Conference on Pattern Recognition (ICPR'06), 2006; Vol. 1, pp 912--915
2006
-
[62]
Approximate training of one-class support vector machines using expected margin, Computers & Industrial Engineering 2019, 130, 772--778
Kang, S.; Kim, D.; Cho, S. Approximate training of one-class support vector machines using expected margin, Computers & Industrial Engineering 2019, 130, 772--778
2019
-
[63]
Autoencoders and their applications in machine learning: a survey, Artificial Intelligence Review 2024, 57 (2), 28
Berahmand, K.; Daneshfar, F.; Salehi, E.S.; Li, Y.; Xu, Y. Autoencoders and their applications in machine learning: a survey, Artificial Intelligence Review 2024, 57 (2), 28
2024
-
[64]
Isolation forest, In 2008 eighth ieee international conference on data mining, IEEE, 2008; pp 413--422
Liu, F.T.; Ting, K.M.; Zhou, Z.H. Isolation forest, In 2008 eighth ieee international conference on data mining, IEEE, 2008; pp 413--422
2008
-
[65]
Vitorino, J.; Andrade, R.; Pra c a, I.; Sousa, O.; Maia, E. A Comparative Analysis of Machine Learning Techniques for IoT Intrusion Detection, In Foundations and Practice of Security, Cham; A \"i meur, E., Laurent, M., Yaich, R., Dupont, B., Garcia-Alfaro, J., Eds.; Springer I...
2022
-
[66]
Effects of data preprocessing on detecting autism in adults using web-based eye-tracking data, Behaviour & Information Technology 2023, 42 (14), 2476--2484
Erfan Khalaji, Y.Y., Sukru Eraslan; Yaneva, V. Effects of data preprocessing on detecting autism in adults using web-based eye-tracking data, Behaviour & Information Technology 2023, 42 (14), 2476--2484
2023
-
[67]
Missing data in time series: A review of imputation methods and case study, Learning and Nonlinear Models 2022, 20 (1), 31--46
Ribeiro, S.M.; Castro, C. Missing data in time series: A review of imputation methods and case study, Learning and Nonlinear Models 2022, 20 (1), 31--46
2022
-
[68]
v‐plots: Designing Hybrid Charts for the Comparative Analysis of Data Distributions, Computer Graphics Forum 2020, 39, 565--577
Blumenschein, M.; Debbeler, L.; Lages, N.; Renner, B.; Keim, D.; El-Assady, M. v‐plots: Designing Hybrid Charts for the Comparative Analysis of Data Distributions, Computer Graphics Forum 2020, 39, 565--577
2020
-
[69]
Random feature selection using random subspace logistic regression, Expert Systems with Applications 2023, 217, 119535
Wichitaksorn, N.; Kang, Y.; Zhang, F. Random feature selection using random subspace logistic regression, Expert Systems with Applications 2023, 217, 119535
2023
-
[70]
Anomaly detection based on machine learning in IoT-based vertical plant wall for indoor climate control, Building and Environment 2020, 183, 107212
Liu, Y.; Pang, Z.; Karlsson, M.; Gong, S. Anomaly detection based on machine learning in IoT-based vertical plant wall for indoor climate control, Building and Environment 2020, 183, 107212
2020
-
[71]
Electricity load forecasting: a systematic review, Journal of Electrical Systems and Information Technology 2020, 7, 1--19
Nti, I.K.; Teimeh, M.; Nyarko-Boateng, O.; Adekoya, A.F. Electricity load forecasting: a systematic review, Journal of Electrical Systems and Information Technology 2020, 7, 1--19
2020
-
[72]
Global vs
Buonanno, A.; Caliano, M.; Pontecorvo, A.; Sforza, G.; Valenti, M.; Graditi, G. Global vs. Local Models for Short-Term Electricity Demand Prediction in a Residential/Lodging Scenario, Energies 2022, 15 (6)
2022
-
[73]
, " * write output.state after.block =
ENTRY address archive author booktitle chapter collaboration edition editor eid howpublished institution journal key lastchecked month note number numpages organization pages publisher school series title type url volume year label INTEGERS output.state before.all mid.sentence...
-
[74]
write newline
" write newline "" before.all 'output.state := FUNCTION n.dashify 't := "" t empty not t #1 #1 substring "-" = t #1 #2 substring "--" = not "--" * t #2 global.max substring 't := t #1 #1 substring "-" = "-" * t #2 global.max substring 't := while if t #1 #1 substring * t #2 gl...
Reviewed August 7, 2026 · model on record in the stance chip above.
Discussion (0). Sign in to comment.