Manifold Learning for Personalized and Label-Free Detection of Cardiac Arrhythmias
Pith reviewed 2026-05-19 08:28 UTC · model grok-4.3
The pith
Nonlinear dimensionality reduction clusters ECG heartbeats from one person into normal and arrhythmic groups without labels or training.
A machine-rendered reading of the paper's core claim, the machinery that carries it, and where it could break.
Core claim
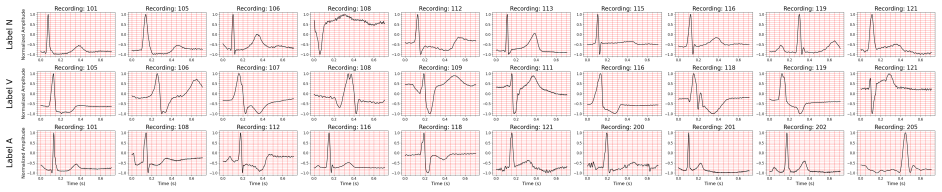
Applying nonlinear dimensionality reduction to heartbeats of a single individual separates normal beats from arrhythmias into distinct clusters identifiable in an unsupervised manner. Both t-SNE and UMAP produce 2D embeddings with trustworthiness scores of at least 0.95, and a k-nearest neighbors classifier on these embeddings discriminates individual recordings with at least 80 percent accuracy while identifying arrhythmias with median accuracy of at least 98 percent and median F1-score of at least 85 percent, outperforming classification in the original high-dimensional space.
What carries the argument
Nonlinear dimensionality reduction via t-SNE and UMAP, which embeds high-dimensional ECG signals into 2D spaces while preserving local neighborhood structure to expose medically relevant clusters.
If this is right
- NLDR applied to mixed populations groups signals by individual rather than by arrhythmia type.
- Per-patient embeddings enable label-free arrhythmia detection with high median accuracy using only a simple classifier.
- The 2D representations outperform the original high-dimensional ECG features for classification tasks.
- The approach operates without pretraining or population-level labeled datasets.
Where Pith is reading between the lines
- Per-patient manifold learning could support real-time analysis on wearable devices that lack access to large supervised training sets.
- If clusters map reliably to specific arrhythmia subtypes, the method might reduce dependence on variable expert annotations across clinics.
- The same per-individual embedding strategy could be tested on other physiological time series such as EEG or blood-pressure waveforms.
Load-bearing premise
The clusters that appear in the 2D space must reflect true differences between normal and abnormal heartbeats rather than noise, lead placement, or other non-medical sources of signal variation.
What would settle it
Re-applying t-SNE or UMAP to the MIT-BIH database and finding that normal and arrhythmic beats from the same patient occupy the same cluster, or that k-NN accuracy on the embeddings falls below 70 percent, would show the unsupervised separation does not hold.
Figures


read the original abstract
Electrocardiograms (ECGs) provide non-invasive measurements of heart activity and are established tools for detecting cardiac arrhythmias. Although supervised machine learning has emerged as a promising approach for automated heartbeat classification, substantial variations in ECG signals across individuals and leads, combined with inconsistent labeling standards and dataset biases, make it difficult to develop generalizable models. Dimensionality reduction maps high-dimensional data into a lower-dimensional space while preserving the underlying structure, enabling visualization and pattern discovery. Conventional methods, e.g., principal component analysis, prioritize large variances and typically overlook subtle yet clinically relevant patterns. Here, we show that nonlinear dimensionality reduction (NLDR) algorithms, e.g., t-SNE and UMAP, can identify medically relevant features in ECG signals without pretraining or prior information. Using the MIT-BIH Arrhythmia Database, we show that: a) applying NLDR to a mixed population of heartbeats reveals inter-individual morphological differences, as signals from the same person cluster together in latent spaces; and b) applying NLDR to heartbeats of a single individual separates normal beats from arrhythmias into distinct clusters, identifiable in an unsupervised manner. To our knowledge, this is the first systematic evaluation of NLDR for unsupervised arrhythmia detection. Both UMAP and t-SNE achieved trustworthiness scores >=0.95, indicating that local neighborhoods are well preserved in the embedding. Classification on 2D embeddings outperforms the original high-dimensional space, with a k-NN classifier discriminating individual recordings with >=80% accuracy and identifying arrhythmias with median accuracy >=98% and median F1-score >=85%. These results show that NLDR holds much promise for cardiac monitoring and personalized healthcare.
Editorial analysis
A structured set of objections, weighed in public.
Referee Report
Summary. The paper claims that nonlinear dimensionality reduction (NLDR) algorithms such as t-SNE and UMAP, when applied to ECG heartbeats from the MIT-BIH Arrhythmia Database, can identify medically relevant features without pretraining or prior information. Specifically, NLDR on mixed-population data reveals inter-individual morphological differences via clustering, while per-patient application separates normal beats from arrhythmias into distinct unsupervised clusters. Both methods achieve trustworthiness scores >=0.95; k-NN classification on the resulting 2D embeddings outperforms the original high-dimensional space, yielding >=80% accuracy for discriminating individual recordings and median accuracy >=98% with median F1-score >=85% for arrhythmia identification.
Significance. If the clusters and performance gains demonstrably isolate arrhythmia-specific morphology rather than artifacts, the approach could enable practical label-free, personalized arrhythmia detection in cardiac monitoring, reducing dependence on large labeled datasets and supervised models. The systematic evaluation on a public benchmark and the reported local neighborhood preservation are strengths that support further investigation.
major comments (3)
- [Results (trustworthiness evaluation and cluster visualization)] The trustworthiness score >=0.95 (reported in the abstract and results) only certifies local neighborhood preservation and does not test whether the global structure of the 2D embedding aligns with clinical arrhythmia annotations (N vs. V, S, etc.). Without quantitative alignment metrics such as adjusted Rand index or cluster purity between unsupervised clusters and ground-truth labels, the separation could arise from non-arrhythmia factors like amplitude, baseline wander, or lead-specific shape, weakening the central claim of medically relevant feature identification.
- [Methods and Experimental Setup] The manuscript provides insufficient detail on preprocessing steps for the ECG signals, hyperparameter choices for t-SNE (e.g., perplexity) and UMAP (e.g., n_neighbors, min_dist), and the train/test protocol or cross-validation for the k-NN classifier. These omissions make it impossible to assess reproducibility of the reported median accuracy >=98% and F1 >=85%, or to determine whether the outperformance over the original space is statistically significant.
- [Abstract and Results (classification experiments)] The label-free detection claim (title and abstract) sits in tension with the use of supervised k-NN classification to quantify arrhythmia identification performance. If detection is intended to be fully unsupervised, evaluation should emphasize unsupervised metrics (e.g., silhouette score on clusters or agreement with annotations via ARI) rather than supervised accuracy, which can succeed even when embeddings capture confounding morphological variation.
minor comments (2)
- [Abstract] The abstract states median values without indicating the number of patients or recordings over which the median is taken or the inter-quartile range; adding this information would clarify variability across individuals.
- [Figures (embedding visualizations)] Figure captions and axis labels for the 2D embeddings should explicitly note whether points are colored by ground-truth arrhythmia labels or by unsupervised cluster assignment to avoid ambiguity in interpreting the visual separation.
Simulated Author's Rebuttal
We thank the referee for their constructive comments, which help clarify the presentation and strengthen the manuscript. We address each major point below and indicate revisions where we agree changes are needed.
read point-by-point responses
-
Referee: The trustworthiness score >=0.95 only certifies local neighborhood preservation and does not test whether the global structure of the 2D embedding aligns with clinical arrhythmia annotations (N vs. V, S, etc.). Without quantitative alignment metrics such as adjusted Rand index or cluster purity, the separation could arise from non-arrhythmia factors.
Authors: We agree that trustworthiness primarily assesses local neighborhood preservation and does not directly quantify global alignment with clinical labels. Our visualizations show patient-specific and arrhythmia-specific clustering, but to better support the claim of medically relevant features, we will add adjusted Rand index (ARI) and cluster purity metrics comparing unsupervised clusters to ground-truth annotations in the revised results section. revision: yes
-
Referee: The manuscript provides insufficient detail on preprocessing steps for the ECG signals, hyperparameter choices for t-SNE (e.g., perplexity) and UMAP (e.g., n_neighbors, min_dist), and the train/test protocol or cross-validation for the k-NN classifier.
Authors: We acknowledge this omission limits reproducibility. In the revised Methods section we will provide: full preprocessing details (filtering, normalization, R-peak detection and segmentation from MIT-BIH), exact hyperparameter settings for t-SNE and UMAP, and the train/test splits plus cross-validation scheme used for k-NN, including any statistical tests for performance differences. revision: yes
-
Referee: The label-free detection claim (title and abstract) sits in tension with the use of supervised k-NN classification to quantify arrhythmia identification performance. If detection is intended to be fully unsupervised, evaluation should emphasize unsupervised metrics (e.g., silhouette score on clusters or agreement with annotations via ARI) rather than supervised accuracy.
Authors: The embedding step itself is unsupervised; k-NN serves only as a post-hoc quantitative measure of separation quality, which is standard for validating embeddings. We will revise the abstract and discussion to reduce ambiguity around 'label-free' and will add unsupervised metrics such as silhouette scores alongside the existing k-NN results. revision: partial
Circularity Check
No circularity detected; standard NLDR application remains self-contained
full rationale
The paper applies established NLDR methods (t-SNE and UMAP) directly to raw or lightly preprocessed ECG segments from the public MIT-BIH database. Cluster separation and k-NN accuracies on the resulting 2D embeddings are reported as empirical outcomes evaluated against external clinical annotations; no equations in the manuscript define the embedding coordinates in terms of the target arrhythmia labels or vice versa. No self-citations, uniqueness theorems, or ansatzes from prior author work are invoked to justify the core pipeline. The trustworthiness metric certifies neighborhood preservation independently of the arrhythmia classification results. This is a conventional experimental workflow with no load-bearing reductions to fitted inputs or self-referential definitions.
Axiom & Free-Parameter Ledger
axioms (1)
- domain assumption High-dimensional ECG heartbeat data lies on a lower-dimensional manifold that can be recovered by nonlinear dimensionality reduction
Lean theorems connected to this paper
-
IndisputableMonolith/Foundation/RealityFromDistinction.leanreality_from_one_distinction unclear?
unclearRelation between the paper passage and the cited Recognition theorem.
nonlinear dimensionality reduction (NLDR) algorithms, e.g., t-SNE and UMAP, can identify medically relevant features in ECG signals without pretraining or prior information
-
IndisputableMonolith/Cost/FunctionalEquation.leanwashburn_uniqueness_aczel unclear?
unclearRelation between the paper passage and the cited Recognition theorem.
Classification on 2D embeddings outperforms the original high-dimensional space, with a k-NN classifier discriminating individual recordings with >=80% accuracy
What do these tags mean?
- matches
- The paper's claim is directly supported by a theorem in the formal canon.
- supports
- The theorem supports part of the paper's argument, but the paper may add assumptions or extra steps.
- extends
- The paper goes beyond the formal theorem; the theorem is a base layer rather than the whole result.
- uses
- The paper appears to rely on the theorem as machinery.
- contradicts
- The paper's claim conflicts with a theorem or certificate in the canon.
- unclear
- Pith found a possible connection, but the passage is too broad, indirect, or ambiguous to say the theorem truly supports the claim.
Reference graph
Works this paper leans on
-
[1]
M. Di Cesare, P. Perel, S. Taylor, C. Kabudula, H. Bixby, T. A. Gaziano, D. V . McGhie, J. Mwangi, B. Pervan, J. Narula, D. Pineiro, and F. J. Pinto, “The Heart of the World,”Global Heart, vol. 19, no. 1, p. 11, Jan. 2024, doi: https://doi.org/10.5334/gh.1288
-
[2]
R. G. Carbone and A.-M. Russell, ”Smoking cessation in heart and chronic respiratory disease: A healthy global strategy,” International Journal of Cardiology, vol. 418, Art no. 132584, 2025. doi: 10.1016/j.ijcard.2024.132584
-
[3]
D. Desai and S. Hajouli, ”Arrhythmias,” StatPearls [Internet], Treasure Island (FL): StatPearls Publishing, updated June 5, 2023. Available: https://www.ncbi.nlm.nih.gov/books/NBK558923/
work page 2023
-
[4]
P. Kligfield et al., ”Recommendations for the Standardization and Interpretation of the Electrocardiogram,”Circulation, vol. 115, no. 10, pp. 1306–1324, 2007, doi: 10.1161/CIRCULATIONAHA.106.180200
-
[5]
B. Rajoub, ”Machine learning in biomedical signal processing with ECG applications,” inBiomedical Signal Processing and Artificial Intelli- gence in Healthcare, W. Zgallai, Ed., Developments in Biomedical Engineering and Bioelectronics, ch. 4, pp. 91-112. Academic Press, 2020. ISBN: 9780128189467. doi: 10.1016/B978-0-12-818946-7.00004-4. [Online]. Availab...
-
[6]
F. Liu, C. Liu, L. Zhao, X. Zhang, X. Wu, X. Xu, Y . Liu, C. Ma, S. Wei, Z. He, J. Li, and E. N. Kwee, ”An Open Access Database for Evaluating the Algorithms of Electrocardiogram Rhythm and Morphology Abnormality Detection,” Journal of Medical Imaging and Health Informatics, vol. 8, no. 7, pp. 1368-1373, Sep. 2018, doi: https://doi.org/10.1166/jmihi.2018.2442
-
[7]
Accuracy of Physicians’ Electrocardiogram Interpretations: A Systematic Review and Meta-analysis,
D. A. Cook, S. Y . Oh, and M. V . Pusic, “Accuracy of Physicians’ Electrocardiogram Interpretations: A Systematic Review and Meta-analysis,” JAMA Internal Medicine, vol. 180, no. 11, pp. 1461–1471, Nov. 2020, doi: https://doi.org/10.1001/jamainternmed.2020.3989
-
[8]
ECG interpretation skill acquisition: A review of learning, teaching and assessment,
C. J. Breen, G. P. Kelly, and W. G. Kernohan, “ECG interpretation skill acquisition: A review of learning, teaching and assessment,” Journal of Electrocardiology, vol. 73, pp. 125–128, 2022, doi: https://doi.org/10.1016/j.jelectrocard.2019.03.010
-
[9]
Ch. Usha Kumari, A. Sampath Dakshina Murthy, B. Lakshmi Prasanna, M. Pala Prasad Reddy, and Asisa Kumar Panigrahy, ”An automated detection of heart arrhythmias using machine learning technique: SVM,”Materials Today: Proceedings, vol. 45, part 2, pp. 1393–1398, 2021, doi: 10.1016/j.matpr.2020.07.088
-
[10]
B. Baraeinejad et al., ”Design and Implementation of an Ultralow-Power ECG Patch and Smart Cloud-Based Platform,” IEEE Transactions on Instrumentation and Measurement, vol. 71, pp. 1-11, 2022, Art no. 2506811. doi: 10.1109/TIM.2022.3164151
-
[11]
A. Ebrahimzadeh and A. Khazaee, ”Detection of premature ventricular contractions using MLP neural networks: A comparative study,” Measurement, vol. 43, no. 1, pp. 103–112, 2010, doi: 10.1016/j.measurement.2009.07.002
-
[12]
D. E. Moghaddam, A. Muguli, M. Razavi, and B. Aazhang, ”A graph-based cardiac arrhythmia classification methodology using one-lead ECG recordings,”Intelligent Systems with Applications, vol. 22, p. 200385, 2024. doi: 10.1016/j.iswa.2024.200385
-
[13]
D. Bertsimas, L. Mingardi, and B. Stellato, ”Machine learning for real-time heart disease prediction,” IEEE J. Biomed. Health Inform., vol. 25, no. 9, pp. 3627-3637, Sept. 2021. doi: 10.1109/JBHI.2021.3066347
-
[14]
J. Yu, X. Wang, X. Chen, and J. Guo, ”Automatic Premature Ventricular Contraction Detection Using Deep Metric Learning and KNN,” Biosensors, vol. 11, no. 3, p. 69, 2021, doi: 10.3390/bios11030069
-
[15]
D. Lai et al., ”Non-Standardized Patch-Based ECG Lead Together With Deep Learning Based Algorithm for Automatic Screen- ing of Atrial Fibrillation,” IEEE Journal of Biomedical and Health Informatics , vol. 24, no. 6, pp. 1569–1578, June 2020, doi: 10.1109/JBHI.2020.2980454
-
[16]
P. N. Singh and R. P. Mahapatra, ”A novel deep learning approach for arrhythmia prediction on ECG classification using recurrent CNN with GWO,”Int. J. Inf. Technol., vol. 16, pp. 577–585, 2024. doi: 10.1007/s41870-023-01611-1
-
[17]
R. Anand, S. V . Lakshmi, D. Pandey, et al., ”An enhanced ResNet-50 deep learning model for arrhythmia detection using electrocardiogram biomedical indicators,”Evolving Systems, vol. 15, pp. 83–97, 2024. doi: 10.1007/s12530-023-09559-0
-
[18]
A. Rajkumar, M. Ganesan, and R. Lavanya, ”Arrhythmia classification on ECG using Deep Learning,” in Proc. 5th Int. Conf. Adv. Comput. Commun. Syst. (ICACCS), Coimbatore, India, 2019, pp. 365–369. doi: 10.1109/ICACCS.2019.8728362
-
[19]
Y . D. Daydulo, B. L. Thamineni, and A. A. Dawud, ”Cardiac arrhythmia detection using deep learning approach and time frequency repre- sentation of ECG signals,”BMC Med. Inform. Decis. Mak., vol. 23, no. 232, 2023. doi: 10.1186/s12911-023-02326-w
-
[20]
J. Chen, X. Zhang, L. Xu, V . H. C. de Albuquerque, and W. Wu, ”Implementing the confidence constraint cloud-edge collaborative computing strategy for ultra-efficient arrhythmia monitoring,” Applied Soft Computing, vol. 154, 111402, 2024, doi: https://doi.org/10.1016/j. asoc.2024.111402
work page doi:10.1016/j 2024
-
[21]
Deep learning-based multidimensional feature fusion for classification of ECG arrhythmia,
J. Cui, L. Wang, X. He, et al., “Deep learning-based multidimensional feature fusion for classification of ECG arrhythmia,”Neural Computing and Applications, vol. 35, pp. 16073–16087, 2023. doi: 10.1007/s00521-021-06487-5
-
[22]
G. B. Moody and R. G. Mark, ”The impact of the MIT-BIH Arrhythmia Database,” IEEE Engineering in Medicine and Biology Magazine , vol. 20, no. 3, pp. 45-50, May-June 2001. doi: 10.1109/51.932724
-
[23]
A. L. Goldberger, L. A. N. Amaral, L. Glass, et al., ”PhysioBank, PhysioToolkit, and PhysioNet: Components of a New Research Resource for Complex Physiologic Signals,”Circulation, vol. 101, no. 23, pp. e215–e220, 2000. doi: 10.1161/01.CIR.101.23.e215
-
[24]
N. Sarshar and M. Mirzaei, ”Premature ventricular contraction recognition based on a deep learning approach,” J. Healthc. Eng., vol. 2022, Article ID 1450723, Mar. 2022. doi: 10.1155/2022/1450723. PMID: 35378947; PMCID: PMC8976634
-
[25]
F. De Marco, D. Finlay, and R. R. Bond, ”Classification of premature ventricular contraction using deep learning,” in 2020 Computing in Cardiology, Rimini, Italy, 2020, pp. 1-4. doi: 10.22489/CinC.2020.311
-
[26]
M. Mastoi, M. S. Memon, A. Lakhan, et al., ”Machine learning-data mining integrated approach for premature ventricular contraction prediction,”Neural Comput. Appl., vol. 33, pp. 11703–11719, 2021. doi: 10.1007/s00521-021-05820-2
-
[27]
T. J. Jun et al., ”Premature Ventricular Contraction Beat Detection with Deep Neural Networks,” in2016 15th IEEE International Conference on Machine Learning and Applications (ICMLA), Anaheim, CA, USA, 2016, pp. 859-864. doi: 10.1109/ICMLA.2016.0154
-
[28]
Testing the manifold hypothesis,
C. Fe fferman, S. Mitter, and H. Narayanan, “Testing the manifold hypothesis,” Journal of the American Mathematical Society , vol. 29, pp. 983–1049, 2016. https://doi.org/10.1090/jams/852
-
[29]
L. van der Maaten and G. Hinton, ”Visualizing Data using t-SNE,” Journal of Machine Learning Research , vol. 9, no. 86, pp. 2579-2605,
-
[30]
Available: http://jmlr.org/papers/v9/vandermaaten08a.html
[Online]. Available: http://jmlr.org/papers/v9/vandermaaten08a.html
-
[31]
UMAP: Uniform Manifold Approximation and Projection for Dimension Reduction
L. McInnes, J. Healy, and J. Melville, ”UMAP: Uniform Manifold Approximation and Projection for Dimension Reduction,” arXiv, 2020. [Online]. Available: https://arxiv.org/abs/1802.03426
work page internal anchor Pith review Pith/arXiv arXiv 2020
-
[32]
Time series data augmentation for neural networks by time warping with a discriminative teacher,
L. Weijler, M. Diem, M. Reiter, and M. Maurer-Granofszky, ”Detecting Rare Cell Populations in Flow Cytometry Data Using UMAP,” in Proceedings of the 25th International Conference on Pattern Recognition (ICPR) , Milan, Italy, 2021, pp. 4903-4909. doi: 10.1109/ICPR48806.2021.9413180
-
[33]
V . van Unen, T. H¨ollt, N. Pezzotti, et al., “Visual analysis of mass cytometry data by hierarchical stochastic neighbour embedding reveals rare cell types,”Nature Communications, vol. 8, p. 1740, 2017. doi: 10.1038/s41467-017-01689-9
-
[34]
E. Becht, L. McInnes, J. Healy, et al., ”Dimensionality reduction for visualizing single-cell data using UMAP,” Nature Biotechnology, vol. 37, pp. 38-44, 2019. doi: 10.1038/nbt.4314
-
[35]
W. M. Abdelmoula, B. Ballu ff, S. Englert, J. Dijkstra, M. J. T. Reinders, A. Walch, L. A. McDonnell, and B. P. F. Lelieveldt, “Data-driven identification of prognostic tumor subpopulations using spatially mapped t-SNE of mass spectrometry imaging data,” Proceedings of the National Academy of Sciences of the United States of America, vol. 113, no. 43, pp....
-
[36]
F. H. M. Oliveira, A. R. P. Machado, and A. O. Andrade, “On the use of t-distributed stochastic neighbor embedding for data visualization 17 and classification of individuals with Parkinson’s disease,” Computational and Mathematical Methods in Medicine , vol. 2018, Article ID 8019232, 2018. doi: 10.1155/2018/8019232
-
[37]
G. Colombo, R. J. A. Cubero, L. Kanari, et al., ”A tool for mapping microglial morphology, morphOMICs, reveals brain-region and sex- dependent phenotypes,”Nature Neuroscience, vol. 25, pp. 1379-1393, 2022. doi: 10.1038/s41593-022-01167-6
-
[38]
J. Fleischer and M. T. Islam, ”Identifying and phenotyping COVID-19 patients using machine learning on chest X-rays,” European Respira- tory Journal, vol. 56, suppl. 64, p. 4151, 2020. Available: https://doi.org/10.1183/13993003.congress-2020.4151
-
[39]
M. T. Islam and J. W. Fleischer, ”Outlier Detection in Large Radiological Datasets Using UMAP,” inTopology- and Graph-Informed Imaging Informatics, C. Chen, Y . Singh, and X. Hu, Eds., TGI3 2024, Lecture Notes in Computer Science, vol. 15239. Cham: Springer, 2025. Available: https://doi.org/10.1007/978-3-031-73967-5_11
-
[40]
E. Merdjanovska and A. Rashkovska, ”A framework for comparative study of databases and computational methods for arrhythmia detection from single-lead ECG,”Scientific Reports, vol. 13, no. 11682, 2023, doi: 10.1038/s41598-023-38532-9
-
[41]
I. I. Christov, ”Real-time electrocardiogram QRS detection using combined adaptive threshold,” BioMed Engineering Online, vol. 3, p. 28,
-
[42]
doi: 10.1186/1475-925X-3-28. [Online]. Available: https://doi.org/10.1186/1475-925X-3-28
-
[43]
J. Pan and W. J. Tompkins, ”A Real-Time QRS Detection Algorithm,” IEEE Transactions on Biomedical Engineering, vol. BME-32, no. 3, pp. 230-236, Mar. 1985. doi: 10.1109/TBME.1985.325532
-
[44]
D. Makowski, T. Pham, Z. J. Lau, et al. , ”NeuroKit2: A Python toolbox for neurophysiological signal processing,” Behavior Research Methods, vol. 53, pp. 1689-1696, 2021. doi: 10.3758/s13428-020-01516-y
-
[45]
Neighborhood preservation in nonlinear projection methods: An experimental study,
J. Venna and S. Kaski, “Neighborhood preservation in nonlinear projection methods: An experimental study,” inInternational Conference on Artificial Neural Networks, pp. 485–491, Springer, 2001. doi: 10.1007/3-540-44668-0 66
-
[46]
Sex matters: A comprehensive comparison of female and male hearts,
S. R. St Pierre, M. Peirlinck, and E. Kuhl, “Sex matters: A comprehensive comparison of female and male hearts,” Frontiers in Physiology, vol. 13, p. 831179, Mar. 2022. doi: 10.3389/fphys.2022.831179
-
[47]
Sex differences in heart: from basics to clinics,
C. Prajapati, J. Koivum ¨aki, M. Pekkanen-Mattila, and K. Aalto-Set ¨al¨a, “Sex differences in heart: from basics to clinics,” European Journal of Medical Research, vol. 27, no. 1, p. 241, Nov. 2022. doi: 10.1186/s40001-022-00880-z
-
[48]
ECG analysis: a new approach in human identification,
L. Biel, O. Pettersson, L. Philipson, and P. Wide, “ECG analysis: a new approach in human identification,” IEEE Transactions on Instrumen- tation and Measurement, vol. 50, no. 3, pp. 808-812, June 2001, doi: 10.1109/19.930458
-
[49]
Right Bundle Branch Block: Current Considerations,
T. Ikeda, “Right Bundle Branch Block: Current Considerations,” Current Cardiology Reviews, vol. 17, no. 1, pp. 24–30, 2021, doi: 10. 2174/1573403X16666200708111553
work page 2021
-
[50]
Electrocardiographic Changes in Primary Hyperparathyroidism,
A. Alzate, M. M. Urbano, and K. Buitrago-Toro, “Electrocardiographic Changes in Primary Hyperparathyroidism,” International Journal of Clinical Cardiology, vol. 2, no. 6, Art. no. 068, Dec. 2015, doi: https://doi.org/10.23937/2378-2951/1410068
-
[51]
M. Shiozaki, M. Sumiyoshi, H. Tabuchi, H. Hayashi, H. Tamura, K. Inoue, and T. Minamino, “A Case of J Wave Syndrome Due to Severe Hypercalcemia with Ventricular Fibrillation Storm and Successful Treatment of Isoproterenol Infusion,”International Heart Journal, vol. 62, no. 4, pp. 924–926, 2021, doi: https://doi.org/10.1536/ihj.20-798
-
[52]
Learning a parametric embedding by preserving local structure,
L. van der Maaten, “Learning a parametric embedding by preserving local structure,” in Proceedings of the Twelfth International Conference on Artificial Intelligence and Statistics , Proceedings of Machine Learning Research, vol. 5, pp. 384–391, 2009. https://proceedings. mlr.press/v5/maaten09a.html
work page 2009
-
[53]
Parametric UMAP embeddings for representation and semi-supervised learning,
T. Sainburg, L. McInnes, and T. Q. Gentner, “Parametric UMAP embeddings for representation and semi-supervised learning,”arXiv preprint arXiv:2009.12981, 2021. [Online]. Available: https://arxiv.org/abs/2009.12981
-
[54]
Manifold-aligned neighbor embedding,
M. T. Islam and J. W. Fleischer, “Manifold-aligned neighbor embedding,” arXiv preprint arXiv:2205.11257 , 2022. [Online]. Available: https://arxiv.org/abs/2205.11257
-
[55]
S. Man, A. C. Maan, M. J. Schalij, and C. A. Swenne, “Vectorcardiographic diagnostic and prognostic information derived from the 12-lead electrocardiogram: Historical review and clinical perspective,” Journal of Electrocardiology, vol. 48, no. 4, pp. 463–475, 2015. https: //doi.org/10.1016/j.jelectrocard.2015.05.002
-
[56]
B. Baraeinejad, M. Shams, M. S. Hamedani, et al., “Clinical IoT in Practice: A Novel Design and Implementation of a Multi-functional Digital Stethoscope for Remote Health Monitoring,” TechRxiv, Nov. 7, 2023. doi: 10.36227/techrxiv.24459988.v1
-
[57]
Y . Torabi, S. Shirani, and J. P. Reilly, “Descriptor: Heart and Lung Sounds Dataset Recorded from a Clinical Manikin using Digital Stetho- scope (HLS-CMDS),”IEEE Data Descriptions, 2025, doi: 10.1109/IEEEDATA.2025.3566012. Appendix A. Example Appendix Section To further demonstrate that many distinct clusters in Figure 6 correspond to di fferent individu...
discussion (0)
Sign in with ORCID, Apple, or X to comment. Anyone can read and Pith papers without signing in.