REVIEW 3 major objections 5 minor 103 references
Overtuning in Hyperparameter Optimization
T0 review · 3 major / 5 minor · reviewed 2026-08-06 · deepseek-v4-flash
Pith's one-line read Hyperparameter optimization can pick worse models than earlier candidates in about 10% of runs.
desk verdict A useful formalization and large-scale empirical study of HPO overtuning, but the headline 10% severe-overtuning rate is conditioned on an arbitrary improvement threshold and the analysis treats noisy outer-test estimates as noiseless. read the letter →
The pith
A machine-rendered reading of the paper's core claim, the machinery that carries it, and where it could break.
The reading
What carries the argument
The carrying object is the relative overtuning statistic of Definition 3.2, built on the overtuning gap of Definition 3.1. It compares the test error of the current validation-optimal incumbent to the best test error achieved by any earlier incumbent, then divides by the total test-improvement made over the first configuration, so a value of 1 means HPO has squandered all its generalization gains. The empirical machinery is the reanalysis of publicly logged HPO trajectories that contain both validation and outer-test scores, plus generalized and linear mixed-effects models that predict the probability of nonzero overtuning and the size of relative overtuning as functions of budget, metric, classifier, resampling strategy, and dataset size. This combination lets the paper turn scattered prior observations about validation-test divergence into a quantitative claim about how often and how badly HPO is misled.
What would settle it
Recompute the relative-overtuning distribution on the same seven suites under one unified protocol, using a single fixed outer test set, models retrained on the full training portion, and identical fold assignments, and check whether the fraction of runs with relative overtuning above 1 still hovers near 10%; if a unified protocol drops that fraction below about 3%, the headline prevalence is an artifact of heterogeneous evaluation protocols.
Extended reading notes
Core claim
The paper's central claim is that overtuning is a real and measurable phenomenon in HPO, not a theoretical curiosity. Using Definition 3.1, overtuning at time $t$ is $ot_t = \mathrm{test}(\lambda^*_t) - \min_{\lambda^*_{t'} \in \{\lambda^*_1,\ldots,\lambda^*_t\}} \mathrm{test}(\lambda^*_{t'})$, and the normalized version $\tilde{ot}_t$ divides this by the maximum test-error improvement achieved over the first configuration. Across the seven suites, roughly 60% of runs show no overtuning, 70% stay below relative overtuning 0.1, and about 10% exceed 1.0, which the paper calls severe because the validation-optimal incumbent has given back all of the improvement over the first configuration. The magnitude varies strongly across suites: some show almost no overtuning while others exceed 50% of runs with overtuning and more than 15% severe. The paper further finds, through mixed models, that the probability and extent of overtuning rise with tuning budget (with a plateau), fall with larger datasets and more sophisticated resampling, differ by metric and algorithm, and are slightly more likely but much smaller under Bayesian optimization than under random search.
Load-bearing premise
The load-bearing premise is that the outer-test performance numbers recorded in the seven benchmark suites are unbiased, low-noise estimates of true generalization error, computed without any test information leaking into validation-based selection; if those numbers are noisy or inconsistent across suites, the measured 10% severe-overtuning rate could be inflated or distorted.
Editorial extensions
If this is right
- In roughly 10% of HPO runs, the final validation-optimal configuration has a test error worse than the first configuration evaluated, so HPO can actively destroy generalization progress rather than improve it.
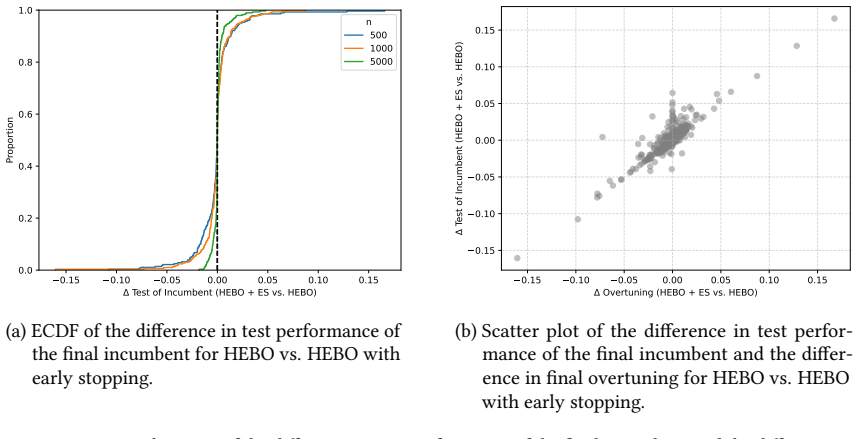
- Using 5-fold or 5x5-fold cross-validation instead of a single holdout reduces both the odds and the magnitude of overtuning, and the same holds for larger datasets, with the largest reductions at n=5000 versus n=500.
- Log loss and RMSE tend to be less overtuning-prone than accuracy and ROC AUC, while flexible models such as CatBoost, Funnel MLP, and neural networks show more overtuning than Elastic Net.
- Bayesian optimizers (HEBO, SMAC3) slightly increase the chance that some overtuning occurs but substantially reduce its magnitude and, for HEBO, reduce final test regret relative to random search.
- Reshuffling resampling splits reduces overtuning and final test regret in the holdout-plus-ROC-AUC setting even though it increases meta-overfitting, while early stopping has a small and inconsistent mitigating effect.
Reading between the lines
- One practical extension the paper leaves implicit: relative overtuning can be computed online during a run whenever an unbiased outer estimate is available, so it could serve as an anytime early-stopping diagnostic, not just a post-hoc benchmark metric.
- Because the 10% figure pools large and small datasets, practitioners working with a few hundred samples under holdout should expect severe overtuning to be more common than 10%, while large-data, repeated-CV runs should be far below it.
- A testable conjecture following from the mixed-model results: reporting the trajectory of relative overtuning alongside validation curves would expose when a search is over-tuning into noise, which could be verified by simulating HPO with synthetic validation noise and checking if overtuning rates rise monotonically with noise variance.
- The paper's comparison of mitigations treats overtuning and final test error as separate outcomes; the implication for protocol design is that overtuning alone should never be the criterion for choosing an HPO method, since a method with zero overtuning can still generalize worse than a mildly overtuned method.
Editorial analysis
A structured set of objections, weighed in public.
Referee Report
Summary. The paper formalizes a phenomenon it calls overtuning in hyperparameter optimization: when the validation-optimal incumbent at time t has worse true generalization error than an earlier incumbent, the HPO run has been misled by noisy validation estimates. It defines absolute and relative overtuning, distinguishes them from meta-overfitting and test regret, and then reanalyzes seven large HPO benchmark suites (FCNet, LCBench, WDTB, TabZilla, TabRepo, reshuffling, PD1) to estimate the prevalence and severity of overtuning. The central empirical claim is that about 10% of HPO runs exhibit severe overtuning, defined as relative overtuning greater than 1. The paper also fits mixed-effects models on the reshuffling data to study how overtuning depends on budget, metric, classifier, resampling strategy, dataset size, optimizer, and reshuffling, and it discusses mitigation strategies such as repeated cross-validation, early stopping, and split reshuffling.
Significance. If the empirical claims withstand scrutiny, the paper makes a useful contribution: it gives clean, formal definitions of overtuning and relative overtuning, connects them to a broad related-work literature, and provides a large-scale empirical picture that goes beyond individual anecdotes. The mixed-model analyses are statistically careful in their use of random intercepts and significance tests, and the authors release code for reproduction. The distinction between overtuning, meta-overfitting, and test regret is conceptually helpful, and the per-study ECDFs reveal substantial heterogeneity that is worth reporting. However, the headline 10% severe-overtuning figure is load-bearing and currently rests on treating noisy outer-test estimates as true generalization error, on a conditioning step that is absent from the abstract, and on an unweighted pooling of heterogeneous evaluations. These issues are fixable, but they require substantive revision rather than copy-editing.
major comments (3)
- [Section 5, Definition 3.1/3.2, Figure 2] The empirical analysis plugs the recorded outer-test estimate dtest into Definition 3.1, which is stated for the true generalization error test(lambda). Test estimates are treated as effectively noiseless when computing the event 'final test error worse than the best earlier test error'. In several of the seven suites the outer test sets are small: TabRepo uses a 10% test split per fold, LCBench uses a 33% test split on datasets that are often small, WDTB caps test sizes and uses small folds for small datasets, and TabZilla relies on the provided OpenML folds. For a binary metric, a test-error difference of 0.01 is within one or two standard errors on a few hundred test samples. Unbiasedness of dtest is not sufficient; the variance of dtest can produce the severe-overtuning event even when validation-based selection has no true effect on generalization. The paper should report uncertainty in dtest (e.g., standard errors or confidence intervals per run) and, crucially, compare the observed severe-overtuning rate to a null baseline in which the final incumbent is chosen independently of validation performance, for example by permuting the trajectory indices or selecting a random configuration from the evaluated set. This concern also propagates to Section 6, where relative overtuning derived from dtest is used as the outcome in the mixed models.
- [Abstract and Section 5, Equation (8)] The abstract claims that 'in approximately 10% of cases' overtuning leads to selection of a configuration with worse generalization than the first configuration tried. In Section 5, however, this 10% is computed after discarding the 38.5% of HPO runs whose test improvement is smaller than epsilon = 0.001. The abstract does not state this conditioning, and the paper provides no sensitivity analysis with respect to epsilon. The 10% figure is therefore a conditional statement about runs with at least a small observed test improvement, not about all HPO runs. The claim should be rephrased accordingly, and the authors should report the rate for several epsilon values or for metric-specific thresholds to show that the conclusion is not an artifact of this arbitrary cutoff.
- [Section 5, Figure 2] The pooled ECDF in Figure 2 gives equal weight to every HPO run across seven studies that differ substantially in trajectory length, metric scale, evaluation protocol, and number of runs. The threshold epsilon = 0.001 has a very different meaning for accuracy, log loss, RMSE, and R2, and the pooled 10% figure is not obviously representative of 'HPO runs' in general. The paper already provides per-study ECDFs, but the aggregate should be accompanied by an explicit statement that it is unweighted, or by a sensitivity analysis stratified or weighted by study, metric, and protocol. Without this, the headline number conflates heterogeneous conditions in a way that is difficult to interpret.
minor comments (5)
- [Appendix E, Table 2a] The table lists 'dataset size (1000)' twice; the second row should presumably be 'dataset size (5000)'.
- [Appendix E, Tables 7a and 7b] There are duplicate 'dataset size (500)' rows, and the label 'resampling (5x 5-fold CV' is missing a closing parenthesis; these should be corrected.
- [Figure 2] The y-axis starts at 0.3 rather than 0, which visually compresses the lower tail of the ECDF; starting at 0 would improve readability.
- [Abstract and Section 5] The phrase 'worse than the default or first configuration tried' is ambiguous because in TabZilla and WDTB the default HPCs are explicitly excluded from the analysis; the reference point should be stated precisely as the first evaluated configuration or an included default, as appropriate for each study.
- [Section 6] The text alternates between 'SMAC3' and 'SMAC' for the same optimizer; the notation should be unified in text and tables.
Circularity Check
No significant circularity: overtuning is computed directly from recorded validation and test trajectories, and the factor analyses do not fit parameters that are relabeled as predictions.
full rationale
The paper defines overtuning in Definition 3.1 as test(lambda*_t) minus the best test performance among earlier incumbents, and estimates it by plugging recorded outer-test performance dtest into that definition. No parameter is fitted to the overtuning outcome and then reported as a prediction; the prevalence ECDFs in Figure 2 are direct summaries of per-run relative overtuning. The mixed models in Section 6 regress overtuning indicators and magnitudes on metric, classifier, resampling, dataset size, budget, optimizer, and reshuffling; these are explanatory analyses of the same computed outcomes, not predictions derived from a fitted quantity that defines the outcome. The paper's load-bearing data sources (FCNet, LCBench, WDTB, TabZilla, TabRepo, reshuffling, PD1) are external benchmark repositories; the reshuffling data is from Nagler et al. (2024), which includes three of the present authors, but the current paper does not justify any theoretical premise by citing that work. It reanalyzes the published data and compares it with independent suites. The exclusion of runs with near-zero test improvement (epsilon = 0.001) is disclosed and affects interpretation, but it is not circular. The reviewer concern that outer test estimates are noisy and no null baseline is provided is a validity and uncertainty concern, not a case of the derivation reducing to its own inputs. No self-definitional, fitted-input-as-prediction, self-citation-load-bearing, uniqueness-imported, ansatz-smuggled, or renaming circularity was found.
Assumptions & free parameters
free parameters (1)
- epsilon (improvement threshold) =
0.001
assumptions (3)
- domain assumption Test error estimates in the seven benchmark studies are unbiased or at least comparable estimates of generalization error for each HPC.
- domain assumption The benchmark HPO trajectories are representative of typical HPO practice, using random search or fixed grids with the first configuration as a meaningful baseline.
- domain assumption Resampling-based validation errors are noisy estimates, and the sequence of validation incumbents is a reasonable model of how HPO selects configurations.
Cite this review
Pith. "Pith review of Overtuning in Hyperparameter Optimization." pith.science (2026). https://pith.science/paper/X76XEMVY
@misc{pith2026250619540,
  author       = {Pith},
  title        = {Pith review of: Overtuning in Hyperparameter Optimization},
  year         = {2026},
  howpublished = {\url{https://pith.science/paper/X76XEMVY}},
  note         = {Machine review of arXiv:2506.19540}
}
read the original abstract
Hyperparameter optimization (HPO) aims to identify an optimal hyperparameter configuration (HPC) such that the resulting model generalizes well to unseen data. As the expected generalization error cannot be optimized directly, it is estimated with a resampling strategy, such as holdout or cross-validation. This approach implicitly assumes that minimizing the validation error leads to improved generalization. However, since validation error estimates are inherently stochastic and depend on the resampling strategy, a natural question arises: Can excessive optimization of the validation error lead to overfitting at the HPO level, akin to overfitting in model training based on empirical risk minimization? In this paper, we investigate this phenomenon, which we term overtuning, a form of overfitting specific to HPO. Despite its practical relevance, overtuning has received limited attention in the HPO and AutoML literature. We provide a formal definition of overtuning and distinguish it from related concepts such as meta-overfitting. We then conduct a large-scale reanalysis of HPO benchmark data to assess the prevalence and severity of overtuning. Our results show that overtuning is more common than previously assumed, typically mild but occasionally severe. In approximately 10% of cases, overtuning leads to the selection of a seemingly optimal HPC with worse generalization error than the default or first configuration tried. We further analyze how factors such as performance metric, resampling strategy, dataset size, learning algorithm, and HPO method affect overtuning and discuss mitigation strategies. Our results highlight the need to raise awareness of overtuning, particularly in the small-data regime, indicating that further mitigation strategies should be studied.
Figures


Figures from the paper (11 more)


Reference graph
Works this paper leans on
-
[1]
and Celisse, A
Arlot, S. and Celisse, A. (2010). A survey of cross-validation procedures for model selection. Statistics Surveys , 4:40--79
2010
-
[2]
Rip van Winkle's Razor: A Simple Estimate of Overfit to Test Data
Arora, S. and Zhang, Y. (2021). Rip van Winkle's razor: A simple estimate of overfit to test data. arXiv:2102.13189 [cs.LG]
work page Pith review arXiv 2021
-
[3]
Austern, M. and Zhou, W. (2020). Asymptotics of cross-validation. arXiv:2001.11111 [math.ST]
arXiv 2020
-
[4]
C., de Carvalho, A
Barros, R. C., de Carvalho, A. C. P. L. F., and Freitas, A. A. (2015). Automatic Design of Decision-Tree Induction Algorithms . Springer International Publishing, Cham
2015
-
[5]
Bartz-Beielstein, T., Friese, M., Zaefferer, M., Naujoks, B., Flasch, O., Konen, W., and Koch, P. (2011). Noisy optimization with sequential parameter optimization and optimal computational budget allocation. In Proceedings of the 13th Annual Conference Companion on Genetic and Evolutionary Computation , page 119–120
2011
-
[6]
Bates, D., Mächler, M., Bolker, B., and Walker, S. (2015). Fitting linear mixed-effects models using lme4 . Journal of Statistical Software , 67(1):1–--48
2015
-
[7]
Bates, S., Hastie, T., and Tibshirani, R. (2024). Cross-validation: What does it estimate and how well does it do it? Journal of the American Statistical Association , 119(546):1434--1445
2024
-
[8]
Bayle, P., Bayle, A., Janson, L., and Mackey, L. (2020). Cross-validation confidence intervals for test error. In Larochelle, H., Ranzato, M., Hadsell, R., Balcan, M.-F., and Lin, H., editors, Proceedings of the 33rd International Conference on Advances in Neural Information Processing Systems ( N eur IPS '20) , pages 16339--16350. Curran Associates
2020
Show all 103 references
-
[9]
and Grandvalet, Y
Bengio, Y. and Grandvalet, Y. (2004). No unbiased estimator of the variance of k-fold cross-validation. Journal of Machine Learning Research , 4:1089--1105
2004
-
[10]
Bergman, E., Purucker, L., and Hutter, F. (2024). Don’t waste your time: Early stopping cross-validation. In automlconf24 , pages 9/1--31
2024
-
[11]
and Bengio, Y
Bergstra, J. and Bengio, Y. (2012). Random search for hyper-parameter optimization. Journal of Machine Learning Research , 13:281--305
2012
-
[12]
Birattari, M. (2004). The Problem of Tuning Metaheuristics as Seen from a Machine Learning Perspective . PhD thesis, Université Libre de Bruxelles
2004
-
[13]
Birattari, M. (2009). Some considerations on the experimental methodology. In Birattari, M., editor, Tuning Metaheuristics: A Machine Learning Perspective , pages 171--195. Springer, Berlin, Heidelberg
2009
-
[14]
Birattari, M., Stützle, T., Paquete, L., and Varrentrapp, K. (2002). A racing algorithm for configuring metaheuristics. In Langdon, W., Cantu-Paz, E., Mathias, K., Roy, R., Davis, D., Poli, R., Balakrishnan, K., Honavar, V., Rudolph, G., Wegener, J., Bull, L., Potter, M., Schu...
2002
-
[15]
Bischl, B., Binder, M., Lang, M., Pielok, T., Richter, J., Coors, S., Thomas, J., Ullmann, T., Becker, M., Boulesteix, A., Deng, D., and Lindauer, M. (2023). Hyperparameter optimization: Foundations, algorithms, best practices, and open challenges. Wiley Interdisciplinary Revi...
2023
-
[16]
and Hardt, M
Blum, A. and Hardt, M. (2015). The ladder: A reliable leaderboard for machine learning competitions. In Bach, F. and Blei, D., editors, Proceedings of the 32nd International Conference on Machine Learning ( ICML '15) , volume 37, pages 1006--1014. Omnipress
2015
-
[17]
Breiman, L. (1984). Classification and regression trees . Routledge
1984
-
[18]
Buczak, P., Groll, A., Pauly, M., Rehof, J., and Horn, D. (2024). Using sequential statistical tests for efficient hyperparameter tuning. AStA Advances in Statistical Analysis , 108(2):441--460
2024
-
[19]
and Talbot, N
Cawley, G. and Talbot, N. (2010). On Over fitting in Model Selection and Subsequent Selection Bias in Performance Evaluation . Journal of Machine Learning Research , 11:2079--2107
2010
-
[20]
Cawley, G. C. and Talbot, N. L. C. (2007). Preventing over-fitting during model selection via B ayesian regularisation of the hyper-parameters. Journal of Machine Learning Research , 8(31):841--861
2007
-
[21]
and Guestrin, C
Chen, T. and Guestrin, C. (2016). XGBoost : A scalable tree boosting system. In Krishnapuram, B., Shah, M., Smola, A., Aggarwal, C., Shen, D., and Rastogi, R., editors, Proceedings of the 22nd ACM SIGKDD International Conference on Knowledge Discovery and Data Mining ( KDD '16...
2016
-
[22]
Chen, X., Liang, C., Huang, D., Real, E., Wang, K., Pham, H., Dong, X., Luong, T., Hsieh, C.-J., Lu, Y., and Le, Q. V. (2023). Symbolic discovery of optimization algorithms. In neurips23
2023
-
[23]
Cowen-Rivers, A., Lyu, W., Tutunov, R., Wang, Z., Grosnit, A., Griffiths, R., Maraval, A., Jianye, H., Wang, J., Peters, J., and Ammar, H. (2022). HEBO : Pushing the limits of sample-efficient hyper-parameter optimisation. Journal of Artificial Intelligence Research , 74:1269--1349
2022
-
[24]
M., Sabourin, R., and Maupin, P
Dos Santos, E. M., Sabourin, R., and Maupin, P. (2009). Overfitting cautious selection of classifier ensembles with genetic algorithms. Information Fusion , 10(2):150--162
2009
-
[25]
S., van Calster, B., Timmerman, D., Boulesteix, A.-L., and van Smeden, M
Dunias, Z. S., van Calster, B., Timmerman, D., Boulesteix, A.-L., and van Smeden, M. (2024). A comparison of hyperparameter tuning procedures for clinical prediction models: A simulation study. Statistics in Medicine , 43(6):1119--1134
2024
-
[26]
Dwork, C., Feldman, V., Hardt, M., Pitassi, T., Reingold, O., and Roth, A. (2015). Generalization in adaptive data analysis and holdout reuse. In Cortes, C., Lawrence, N., Lee, D., Sugiyama, M., and Garnett, R., editors, Advances in Neural Information Processing Systems , volume 28
2015
-
[27]
and Tibshirani, R
Efron, B. and Tibshirani, R. (1997). Improvements on cross-validation: The 632+ bootstrap method. Journal of the American Statistical Association , 92(438):548--560
1997
-
[28]
Eggensperger, K., Lindauer, M., and Hutter, F. (2019). Pitfalls and best practices in algorithm configuration. Journal of Artificial Intelligence Research , pages 861--893
2019
-
[29]
Eimer, T., Lindauer, M., and Raileanu, R. (2023). Hyperparameters in reinforcement learning and how to tune them. In Krause, A., Brunskill, E., Cho, K., Engelhardt, B., Sabato, S., and Scarlett, J., editors, Proceedings of the 40th International Conference on Machine Learning ...
2023
-
[30]
Escalante, H., Montes, M., and Sucar, E. (2009). Particle Swarm Model Selection . Journal of Machine Learning Research , 10:405--440
2009
-
[31]
and Freitas, A
Fabris, F. and Freitas, A. (2019). Analysing the overfit of the auto-sklearn automated machine learning tool. In Nicosia, G., Pardalos, P., Umeton, R., Giuffrida, G., and Sciacca, V., editors, Machine Learning, Optimization, and Data Science , volume 11943 of Lecture Notes in ...
2019
-
[32]
Feldman, V., Frostig, R., and Hardt, M. (2019). The advantages of multiple classes for reducing overfitting from test set reuse. In Chaudhuri, K. and Salakhutdinov, R., editors, Proceedings of the 36th International Conference on Machine Learning ( ICML '19) , volume 97, pages...
2019
-
[33]
Feurer, M., Eggensperger, K., Falkner, S., Lindauer, M., and Hutter, F. (2022). Auto-Sklearn 2.0: Hands-free automl via meta-learning. Journal of Machine Learning Research , 23(261):1--61
2022
-
[34]
and Hutter, F
Feurer, M. and Hutter, F. (2019). Hyperparameter O ptimization. In Hutter, F., Kotthoff, L., and Vanschoren, J., editors, Automated Machine Learning: Methods, Systems, Challenges , chapter 1, pages 3 -- 38. Springer. Available for free at http://automl.org/book
2019
-
[35]
Feurer, M., Klein, A., Eggensperger, K., Springenberg, J., Blum, M., and Hutter, F. (2015). Efficient and robust automated machine learning. In Cortes, C., Lawrence, N., Lee, D., Sugiyama, M., and Garnett, R., editors, Proceedings of the 29th International Conference on Advanc...
2015
-
[36]
Garnett, R. (2023). Bayesian Optimization . Cambridge University Press. Available for free at https://bayesoptbook.com/
2023
-
[37]
Grinsztajn, L., Oyallon, E., and Varoquaux, G. (2022). Why do tree-based models still outperform deep learning on typical tabular data? In Koyejo, S., Mohamed, S., Agarwal, A., Belgrave, D., Cho, K., and Oh, A., editors, Proceedings of the 35th International Conference on Adva...
2022
-
[38]
J., Escalera, S., Ho, T
Guyon, I., Bennett, K., Cawley, G., Escalante, H. J., Escalera, S., Ho, T. K., Macià, N., Ray, B., Saeed, M., Statnikov, A., and Viegas, E. (2015). Design of the 2015 ChaLearn AutoML challenge. In 2015 International Joint Conference on Neural Networks ( IJCNN'15 ) , pages 1--8...
2015
-
[39]
Guyon, I., Saffari, A., Dror, G., and Cawley, G. (2010). Model selection: Beyond the B ayesian/ F requentist divide. Journal of Machine Learning Research , 11:61--87
2010
-
[40]
Hardt, M. (2017). Climbing a shaky ladder: Better adaptive risk estimation. arXiv:1706.02733 [cs.LG]
2017 arXiv
-
[41]
and Recht, B
Hardt, M. and Recht, B. (2022). Patterns, Predictions, and Actions: Foundations of Machine Learning . Princeton University Press
2022
-
[42]
u gamer, D., H\
Herrmann, M., Lange, F., Eggensperger, K., Casalicchio, G., Wever, M., Feurer, M., R\" u gamer, D., H\" u llermeier, E., Boulesteix, A.-L., and Bischl, B. (2024). Position: Why we must rethink empirical research in machine learning. In icml24 , pages 18228--18247
2024
-
[43]
Hospedales, T., Antoniou, A., Micaelli, P., and Storkey, A. (2021). Meta-learning in neural networks: A survey. In Lee, K. M., editor, IEEE Transactions on Pattern Analysis and Machine Intelligence'21) . IEEE Computer Society
2021
-
[44]
Huisman, M., van Rijn, J., and Plaat, A. (2021). A survey of deep meta-learning. Artificial Intelligence Review , 54:4483--4541
2021
-
[45]
Hutter, F., Hoos, H., and Leyton-Brown, K. (2011). Sequential model-based optimization for general algorithm configuration. In Coello, C., editor, Proceedings of the Fifth International Conference on Learning and Intelligent Optimization ( LION '11) , volume 6683 of Lecture No...
2011
-
[46]
Hutter, F., Hoos, H., Leyton-Brown, K., and St \"u tzle, T. (2009). Param ILS : An automatic algorithm configuration framework. Journal of Artificial Intelligence Research , 36:267--306
2009
-
[47]
Hutter, F., Hoos, H., and St\"utzle, T. (2007). Automatic algorithm configuration based on local search. In Holte, R. and Howe, A., editors, Proceedings of the Twenty-second AAAI Conference on Artificial Intelligence ( AAAI '07) , pages 1152--1157. AAAI Press
2007
-
[48]
Igel, C. (2013). A note on generalization loss when evolving adaptive pattern recognition systems. IEEE Transactions on Evolutionary Computation , 17(3):345--352
2013
-
[49]
Ishibashi, H., Karasuyama, M., Takeuchi, I., and Hino, H. (2023). A stopping criterion for B ayesian optimization by the gap of expected minimum simple regrets. In Ruiz, F., Dy, J., and van de Meent, J.-W., editors, Proceedings of The 26th International Conference on Artificia...
2023
-
[50]
and Hutter, F
Klein, A. and Hutter, F. (2019). Tabular benchmarks for J oint A rchitecture and H yperparameter optimization. arXiv:1905.04970 [cs.LG]
2019 arXiv
-
[51]
Koch, P., Konen, W., Flasch, O., and Bartz-Beielstein, T. (2010). Optimizing support vector machines for stormwater prediction. Technical Report TR10-2-007, Technische Universität Dortmund. Proceedings of Workshop on Experimental Methods for the Assessment of Computational Sys...
2010
-
[52]
Lang, M., Kotthaus, H., Marwedel, P., Weihs, C., Rahnenführer, J., and Bischl, B. (2015). Automatic model selection for high-dimensional survival analysis. Journal of Statistical Computation and Simulation , 85:62--76
2015
-
[53]
and Barbosa, H
Larcher, C. and Barbosa, H. (2022). Evaluating models with dynamic sampling holdout in auto-ml. SN Computer Science , 3(506)
2022
-
[54]
Li, S., Li, K., and Li, W. (2023). W hy not looking backward? A robust two-step method to automatically terminate B ayesian optimization. In Oh, A., Naumann, T., Globerson, A., Saenko, K., Hardt, M., and Levine, S., editors, Advances in Neural Information Processing Systems , ...
2023
-
[55]
Lindauer, M., Eggensperger, K., Feurer, M., Biedenkapp, A., Deng, D., Benjamins, C., Ruhkopf, T., Sass, R., and Hutter, F. (2022). SMAC3 : A versatile bayesian optimization package for H yperparameter O ptimization. Journal of Machine Learning Research , 23(54):1--9
2022
-
[56]
Proceedings of the Third International Conference on Automated Machine Learning
Lindauer, M., Eggensperger, K., Garnett, R., Vanschoren, J., and Gardner, J., editors (2024). Proceedings of the Third International Conference on Automated Machine Learning . Proceedings of Machine Learning Research
2024
-
[57]
P., Violante, I
Lorenz, R., Monti, R. P., Violante, I. R., Faisal, A. A., Anagnostopoulos, C., Leech, R., and Montana, G. (2016). Stopping criteria for boosting automatic experimental design using real-time fMRI with B ayesian optimization. arXiv:1511.07827 [q-bio.NC]
2016 arXiv
-
[58]
and Cunningham, P
Loughrey, J. and Cunningham, P. (2005). Overfitting in wrapper-based feature subset selection: The harder you try the worse it gets. In Bramer, M., Coenen, F., and Allen, T., editors, Research and Development in Intelligent Systems XXI , pages 33--43, London. Springer London
2005
-
[59]
D., and Wen, H
Loya, H., Łukasz Dudziak, Mehrotra, A., Lee, R., Fernandez-Marques, J., Lane, N. D., and Wen, H. (2023). How much is hidden in the NAS benchmarks? few-shot adaptation of a NAS predictor. arXiv:2311.18451 [cs.LG]
2023 arXiv
-
[60]
Lévesque, J. (2018). Bayesian Hyperparameter Optimization : Overfitting , Ensembles and Conditional Spaces . PhD thesis, Université Laval
2018
-
[61]
Makarova, A., Shen, H., Perrone, V., Klein, A., Faddoul, J., Krause, A., Seeger, M., and Archambeau, C. (2021). Overfitting in Bayesian Optimization : An empirical study and early-stopping solution. In ICLR 2021 Workshop on Neural Architecture Search
2021
-
[62]
Makarova, A., Shen, H., Perrone, V., Klein, A., Faddoul, J., Krause, A., Seeger, M., and Archambeau, C. (2022). Automatic termination for hyperparameter optimization. In Guyon, I., Lindauer, M., van der Schaar, M., Hutter, F., and Garnett, R., editors, Proceedings of the First...
2022
-
[63]
E., Searle, S
McCulloch, C. E., Searle, S. R., and Neuhaus, J. M. (2008). Generalized, Linear, and Mixed Models . Wiley Series in Probability and Statistics. Wiley, Hoboken, NJ, 2 edition
2008
-
[64]
McElfresh, D., Khandagale, S., Valverde, J., Prasad C , V., Ramakrishnan, G., Goldblum, M., and White, C. (2023). When do neural nets outperform boosted trees on tabular data? In neurips23 , pages 76336--76369
2023
-
[65]
Mohr, F., Wever, M., and Hüllermeier, E. (2018). ML - Plan : Automated machine learning via hierarchical planning. Machine Learning , 107(8-10):1495--1515
2018
-
[66]
M., Simon, R., and Pfeiffer, R
Molinaro, A. M., Simon, R., and Pfeiffer, R. M. (2005). Prediction error estimation: A comparison of resampling methods. Bioinformatics , 21(15):3301--3307
2005
-
[67]
Nagler, T., Schneider, L., Bischl, B., and Feurer, M. (2024). Reshuffling resampling splits can improve generalization of hyperparameter optimization. In Globerson, A., Mackey, L., Belgrave, D., Fan, A., Paquet, U., Tomczak, J., and Zhang, C., editors, Proceedings of the 37th ...
2024
-
[68]
C., Hoff, B
Neto, E. C., Hoff, B. R., Bare, C., Bot, B. M., Yu, T., Magravite, L., Trister, A. D., Norman, T., Meyer, P., Saez-Rodrigues, J., Costello, J. C., Guinney, J., and Stolovitzky, G. (2016). Reducing overfitting in challenge-based competitions. arXiv:1607.00091 [stat.AP]
2016 arXiv
-
[69]
Ng, A. (1997). Preventing ``overfitting''' of cross-validation data. In Fisher, D., editor, Proceedings of the Fourteenth International Conference on Machine Learning ( ICML '97) , pages 245--253. Morgan Kaufmann Publishers
1997
-
[70]
Nguyen, T., Gupta, S., Rana, S., and Venkatesh, S. (2018). Stable bayesian optimization. International Journal of Data Science and Analytics , 6:327--339
2018
-
[71]
Nguyen, V., Gupta, S., Rana, S., Li, C., and Venkatesh, S. (2017). Regret for expected improvement over the best-observed value and stopping condition. In Zhang, M.-L. and Noh, Y.-K., editors, Proceedings of the Ninth Asian Conference on Machine Learning , volume 77, pages 279--294
2017
-
[72]
Proceedings of the 36th International Conference on Advances in Neural Information Processing Systems ( N eur IPS '23)
Oh, A., Naumann, T., Globerson, A., Saenko, K., Hardt, M., and Levine, S., editors (2023). Proceedings of the 36th International Conference on Advances in Neural Information Processing Systems ( N eur IPS '23) . Curran Associates
2023
-
[73]
Paraschakis, K., Castellani, A., Borboudakis, G., and Tsamardinos, I. (2024). Confidence interval estimation of predictive performance in the context of AutoML . In Eggensperger, K., Garnett, R., Vanschoren, J., Lindauer, M., and Gardner, J. R., editors, Proceedings of the Thi...
2024
-
[74]
Picheny, V., Wagner, T., and Ginsbourger, D. (2013). A benchmark of K riging-based infill criteria for noisy optimization. Structural and Multidisciplinary Optimization , 48:607--626
2013
-
[75]
Probst, P., Boulesteix, A., and Bischl, B. (2019). Tunability: Importance of hyperparameters of machine learning algorithms. Journal of Machine Learning Research , 20(53):1--32
2019
-
[76]
Prokhorenkova, L., Gusev, G., Vorobev, A., Dorogush, A., and Gulin, A. (2018). Catboost: Unbiased boosting with categorical features. In Bengio, S., Wallach, H., Larochelle, H., Grauman, K., Cesa - Bianchi, N., and Garnett, R., editors, Proceedings of the 31st International Co...
2018
-
[77]
and Cameron-Jones, R
Quinlan, J. and Cameron-Jones, R. (1995). Oversearching and layered search in empirical learning. In Mellish, C., editor, Proceedings of the 14th International Joint Conference on Artificial Intelligence ( IJCAI '95) , page 1019–1024. Morgan Kaufmann Publishers
1995
-
[78]
Reunanen, J. (2003). Overfitting in making comparisons between variable selection methods. Journal of Machine Learning Research , 3:1371--1382
2003
-
[79]
Reunanen, J. (2007). Model selection and assessment using cross-indexing. In Proceedings of the 2007 International Joint Conference on Neural Networks , pages 2581--2585
2007
-
[80]
D., Snell, K
Riley, R. D., Snell, K. I. E., Martin, G. P., Whittle, R., Archer, L., Sperrin, M., and Collins, G. S. (2021). Penalization and shrinkage methods produced unreliable clinical prediction models especially when sample size was small. Journal of Clinical Epidemiology , 132:88--96
2021
-
[81]
Roelofs, R., Shankar, V., Recht, B., Fridovich-Keil, S., Hardt, M., Miller, J., and Schmidt, L. (2019). A meta-analysis of overfitting in machine learning. In Wallach, H., Larochelle, H., Beygelzimer, A., d'Alche Buc, F., Fox, E., and Garnett, R., editors, Proceedings of the 3...
2019
-
[82]
Russakovsky, O., Deng, J., Su, H., Krause, J., Satheesh, S., Ma, S., Huang, Z., Karpathy, A., Khosla, A., Bernstein, M., Berg, A., and Fei-Fei, L. (2015). I magenet large scale visual recognition challenge. International Journal of Computer Vision , 115(3):211--252
2015
-
[83]
Proceedings of the 41st International Conference on Machine Learning ( ICML '24) , volume 251 of Proceedings of Machine Learning Research
Salakhutdinov, R., Kolter, Z., Heller, K., Weller, A., Oliver, N., Scarlett, J., and Berkenkamp, F., editors (2024). Proceedings of the 41st International Conference on Machine Learning ( ICML '24) , volume 251 of Proceedings of Machine Learning Research . PMLR
2024
-
[84]
and Erickson, N
Salinas, D. and Erickson, N. (2024). TabRepo : A large scale repository of tabular model evaluations and its AutoML applications. In automlconf24 , pages 19/1--30
2024
-
[85]
o der, S., Baratchi, M., and van Rijn, J. N. (2025). Overfitting in combined algorithm selection and hyperparameter optimization. In Krempl, G., Puolam \
Schr \"o der, S., Baratchi, M., and van Rijn, J. N. (2025). Overfitting in combined algorithm selection and hyperparameter optimization. In Krempl, G., Puolam \"a ki, K., and Miliou, I., editors, Advances in Intelligent Data Analysis XXIII , pages 181--194
2025
-
[86]
Schulz-Kümpel, H., Fischer, S., Hornung, R., Boulesteix, A.-L., Nagler, T., and Bischl, B. (2025). Constructing confidence intervals for 'the' generalization error -- a comprehensive benchmark study. arXiv:2409.18836 [stat.ML]
2025 arXiv
-
[87]
T., Lee, C., Tang, Y., and Chen, Y
Song, X., Tian, Y., Lange, R. T., Lee, C., Tang, Y., and Chen, Y. (2024). Position: Leverage foundational models for black-box optimization. In icml24 , pages 46168--46180
2024
-
[88]
Stone, M. (1974). Cross-validatory choice and assessment of statistical predictions. Journal of the Royal Statistical Society: Series B (Methodological) , 36(2):111--133
1974
-
[89]
Thornton, C., Hutter, F., Hoos, H., and Leyton-Brown, K. (2013). A uto- WEKA : combined selection and H yperparameter O ptimization of classification algorithms. In Dhillon, I., Koren, Y., Ghani, R., Senator, T., Bradley, P., Parekh, R., He, J., Grossman, R., and Uthurusamy, R...
2013
-
[90]
Tschalzev, A., Purucker, L., Lüdtke, S., Hutter, F., Bartelt, C., and Stuckenschmidt, H. (2025). Unreflected use of tabular data repositories can undermine research quality. arXiv:2503.09159 [cs.LG]
2025 arXiv
-
[91]
van Calster, B., van Smeden, M., De Cock, B., and Steyerberg, E. W. (2020). Regression shrinkage methods for clinical prediction models do not guarantee improved performance: Simulation study. Statistical Methods in Medical Research , 29(11):3166--3178
2020
-
[92]
and Hutter, F
van Rijn, J. and Hutter, F. (2018). Hyperparameter importance across datasets. In Guo, Y. and Farooq, F., editors, Proceedings of the 24th ACM SIGKDD International Conference on Knowledge Discovery and Data Mining ( KDD '18) , pages 2367--2376. ACM Press
2018
-
[93]
and Cawley, G
Wainer, J. and Cawley, G. (2017). Empirical Evaluation of Resampling Procedures for Optimising SVM Hyperparameters . Journal of Machine Learning Research , 18:1--35
2017
-
[94]
E., Swersky, K., Lee, C., Nado, Z., Gilmer, J., Snoek, J., and Ghahramani, Z
Wang, Z., Dahl, G. E., Swersky, K., Lee, C., Nado, Z., Gilmer, J., Snoek, J., and Ghahramani, Z. (2024). Pre-trained G aussian processes for B ayesian optimization. Journal of Machine Learning Research , 25(212):1--83
2024
-
[95]
Williams, C. K. I. and Barber, D. (1998). B ayesian classification with G aussian processes. IEEE Transactions on Pattern Analysis and Machine Intelligence , 20(12):13420--1351
1998
-
[96]
Wilson, J. T. (2024). Stopping B ayesian optimization with probabilistic regret bounds. In Globerson, A., Mackey, L., Belgrave, D., Fan, A., Paquet, U., Tomczak, J., and Zhang, C., editors, Advances in Neural Information Processing Systems , volume 37, pages 98264--98296
2024
-
[97]
Yang, C., Akimoto, J., Kim, D., and Udell, M. (2019). OBOE : Collaborative filtering for AutoML model selection. In Teredesai, A., Kumar, V., Li, Y., Rosales, R., Terzi, E., and Karypis, G., editors, Proceedings of the 25th ACM SIGKDD International Conference on Knowledge Disc...
2019
-
[98]
Yang, C., Fan, J., Wu, Z., and Udell, M. (2020). AutoML pipeline selection: Efficiently navigating the combinatorial space. In Tang, J. and Prakash, B., editors, Proceedings of the 26th ACM SIGKDD International Conference on Knowledge Discovery and Data Mining ( KDD '20) . ACM Press
2020
-
[99]
Yao, H., Huang, L.-K., Zhang, L., Wei, Y., Tian, L., Zou, J., Huang, J., and Li, Z. . (2021). Improving generalization in meta-learning via task augmentation. In Meila, M. and Zhang, T., editors, Proceedings of the 38th International Conference on Machine Learning ( ICML '21) ...
2021
-
[100]
and Bilenko, M
Zheng, A. and Bilenko, M. (2013). Lazy paired hyper-parameter tuning. In Rossi, F., editor, Proceedings of the 23rd International Joint Conference on Artificial Intelligence ( IJCAI '13) , pages 1924--1931
2013
-
[101]
Zimmer, L., Lindauer, M., and Hutter, F. (2021). Auto-Pytorch : Multi-fidelity metalearning for efficient and robust AutoDL . IEEE Transactions on Pattern Analysis and Machine Intelligence , 43:3079--3090
2021
-
[102]
and Hastie, T
Zou, H. and Hastie, T. (2005). Regularization and variable selection via the elastic net. Journal of the Royal Statistical Society Series B: Statistical Methodology , 67(2):301--320
2005
-
[103]
Šinkovec, H., Heinze, G., Blagus, R., and Geroldinger, A. (2021). To tune or not to tune, a case study of ridge logistic regression in small or sparse datasets. BMC Medical Research Methodology , 21(1):199
2021
Reviewed August 6, 2026 · model on record in the stance chip above.
Discussion (0). Continue with ORCID to comment.