REVIEW 4 major objections 6 minor 32 references
Towards Interpretable and Efficient Feature Selection in Trajectory Datasets: A Taxonomic Approach
T0 review · 4 major / 6 minor · reviewed 2026-08-06 · deepseek-v4-flash
Pith's one-line read This paper claims that a taxonomy-based feature selection method, which groups trajectory features into curvature, indentation, speed, and acceleration, matches or beats greedy forward/backward selection while drastically cutting…
desk verdict The core idea—using a predefined trajectory taxonomy as the search space for feature selection—is genuinely new and worth discussing, but the evaluation lets the method cherry-pick its best category combination from test results, so the headline performance claim is not supported. read the letter →
The pith
A machine-rendered reading of the paper's core claim, the machinery that carries it, and where it could break.
The reading
What carries the argument
The central machinery is the four-leaf taxonomy of trajectory features, taken from prior work: curvature (distance-geometry signatures measuring straightness), indentation (statistical summaries of turn angles), speed (statistical summaries of speed magnitudes), and acceleration (statistical summaries of acceleration magnitudes). The method performs feature selection by choosing one of the 15 nonempty subsets of these four category leaves, so the selected 'feature set' is a category combination, not a list of individual variables. This collapses the combinatorial search space and makes the output interpretable as a statement about which movement properties matter; the paper uses frequency counts over the best category combinations across models and seeds to read each dataset's sensitivity.
What would settle it
Run the same pipeline on a trajectory dataset where a known single feature within one category carries nearly all predictive signal while the rest of the category is noise. If the best individual-feature selection beats every one of the 15 category combinations by a margin beyond random variation, the claim that taxonomy-based selection achieves comparable or superior predictive performance would be falsified.
Extended reading notes
Core claim
The central claim is that a taxonomy-based feature selection method, one that groups trajectory features into geometric and kinematic categories and selects whole categories rather than individual features, consistently achieves predictive performance comparable to or better than classical greedy wrapper methods. Because the lowest taxonomic level has four categories, the search is over $2^4-1=15$ combinations, a drastic reduction of combinatorial space relative to individual feature subsets; this is claimed to account for the large reduction in selection time. The authors also claim that the taxonomy adds a layer of interpretability: frequency analysis over the best category combinations reveals which movement aspects (curvature, indentation, speed, acceleration) each dataset is sensitive to. They note that the numerical improvements over baselines were not statistically significant, and frame the contribution as a step toward explainable and efficient feature selection for trajectory data rather than a categorical win over all baselines.
Load-bearing premise
The load-bearing premise is that the four predefined categories, curvature, indentation, speed, and acceleration, are internally coherent groupings for feature selection; if a category mixes highly predictive and useless features, restricting the search to the 15 category combinations can never find the better individual subset.
Editorial extensions
If this is right
- On trajectory datasets with many derived features, practitioners can replace per-feature greedy search with category-level search and expect selection time to drop sharply while keeping accuracy within the same range.
- The best category combination per dataset can act as a diagnostic: for instance, the arctic fox results point to curvature, indentation, and acceleration as the informative movement aspects, with speed rarely selected.
- Because the improvements over baselines were not statistically significant, the method's practical advantage is primarily computational and interpretive rather than a guaranteed accuracy gain.
- The method's success on the small arctic fox dataset suggests category-level selection may be especially useful when sample sizes are too small for per-feature wrappers to generalize.
Reading between the lines
- If within-category feature redundancy is low, the same category-level trick should scale to larger taxonomies than four leaves; any hierarchical feature organization for movement data could be searched in $2^k-1$ combinations for $k$ categories, growing only exponentially in the number of categories rather than in the number of features.
- The frequency-analysis idea suggests a testable extension: for a new trajectory dataset, pre-screening categories by which ones appear in the best subsets could tell analysts which feature families to collect or discard before expensive data processing.
- The paper's admitted lack of statistical significance implies a sharper experiment would compare category-level selection against within-category greedy selection on the same training folds; if within-category selection consistently wins, the taxonomy's groupings would need per-dataset refinement.
- One could use the taxonomy as a structured regularizer in embedded or deep models, constraining feature importance to be uniform within categories, rather than as a discrete subset selector.
Signed reviews
Editorial analysis
A structured set of objections, weighed in public.
Referee Report
Summary. This Bachelor's thesis proposes a taxonomy-based feature selection method for trajectory data, grouping low-level movement features into geometric (curvature, indentation) and kinematic (speed, acceleration) categories and evaluating all 15 non-empty category combinations against forward and backward selection on three datasets (Arctic Fox, AIS, Tropical Cyclone) and four classifiers. The paper reports that the taxonomy method wins 16 of 24 model-dataset comparisons, provides frequency analyses of preferred categories, and claims reduced computational time and improved interpretability, but it also concedes in Section 5.1 that the performance improvements were not statistically significant and that the results are inconclusive.
Significance. The underlying research question is worthwhile: category-level feature selection could reduce the combinatorial search space and provide a more interpretable selection process than greedy wrappers, which is relevant for explainable AI and trajectory analysis. The frequency analyses in Figures 4.8, 4.13, and 4.18 are an interesting way to connect selected feature sets to dataset sensitivity, and the authors are transparent in their own discussion about the lack of statistical significance. However, the current experimental design contains a likely selection-on-the-test-set problem, and the central performance claims in the abstract are not supported by the reported evidence. If the comparison were redone with a principled rule for choosing among the 15 taxonomy combinations and with significance testing, the study could make a modest but useful empirical contribution.
major comments (4)
- [§3.5–3.6, §4] The methodology never specifies how the best taxonomy combination is chosen among the 15 candidates. Section 3.6 states that each combination produces twenty sets of results, and Section 4 reports 'the best feature subset result from our taxonomy method' (e.g., before Figure 4.4). Tables 4.8, 4.10, and 4.12 list the best-performing combination per model and dataset. If, as the natural reading suggests, these combinations are selected by their test-set median Weighted-F1 after the fact, the taxonomy method is allowed to pick the maximum over 15 candidate feature sets on the test set, whereas the forward/backward baselines must commit to a subset during training. The 16/24 win count in Tables 4.13 and 4.14 is then a multiple-comparisons artifact rather than evidence for the taxonomy. The authors must specify a data-independent rule for selecting among the 15 combinations (e.g., selection on validation folds within the training split) or treat the comparison as exploratory.
- [Abstract; §5.1] The abstract's claim of 'robust evidence' and 'consistently achieved comparable or superior predictive performance' is directly contradicted by Section 5.1, which states that 'the improvements were not statistically significant' and that 'overall the results of this experiment is inconclusive on which feature selection method performs better.' The empirical section should be rewritten to match this admitted inconclusiveness; at most the paper can claim that taxonomy-based selection is competitive in some settings and faster, pending the timing evidence.
- [§4.4–4.5, §5.1] No statistical significance testing is reported for the win counts in Tables 4.13 and 4.14. The medians in Tables 4.7, 4.9, and 4.11 differ by small amounts (e.g., AIS Random Forest non-tuned: 0.7598 versus 0.7516), and with only 20 runs per condition the 16/24 preference counts are not established as real differences. Report paired tests across the 20 seed/CV iterations (e.g., Wilcoxon signed-rank) or confidence intervals for the median differences, for each model-dataset pair and both tuned and non-tuned settings.
- [§5.1; Abstract] The claim that 'the time taken to select features was drastically reduced' is not supported by any reported measurement. Section 5.1 only says speed was observed qualitatively, and no wall-clock times or complexity analysis are given. Provide actual runtime measurements for the three feature selection methods, or at least a formal complexity comparison (e.g., number of model fits: 15 taxonomy combinations versus the number of evaluations in forward/backward selection).
minor comments (6)
- [§3.6] The text says 'using five decimal places of π: 14159, 26535, 89793, 23846'; these are four 5-digit blocks of the decimal expansion, so the phrase 'five decimal places' is inaccurate.
- [§3.8] The preprocessing class is called 'Standard Scalar' in the text; the correct scikit-learn name is StandardScaler.
- [Figure 3.3] The text refers to a Venn diagram that 'visualizes the expected combinations,' but the figure caption and surrounding text do not explain what the overlaps represent; please clarify or remove the reference.
- [Tables 4.13–4.14] The tables are titled 'Preferred Feature Selection Method,' but it is not stated that 'preferred' means the highest median Weighted-F1; please state the criterion explicitly.
- [§4.1] The sentence 'That too in two instances as such we can conclude in this case of the Arctic Fox dataset taxonomy-based feature selection was able to produce the better predictor' has grammar and punctuation issues and should be revised.
- [References] Reference [27] is an API documentation page; the original source of the AIS dataset should be cited instead.
Circularity Check
Taxonomy 'wins' are the post-hoc maximum over 15 test-set combinations, not the performance of a single feature-selection method.
-
fitted input called prediction
[Section 3.5, Section 3.6, Section 4 opening, Section 4.1, Tables 4.8/4.10/4.12]
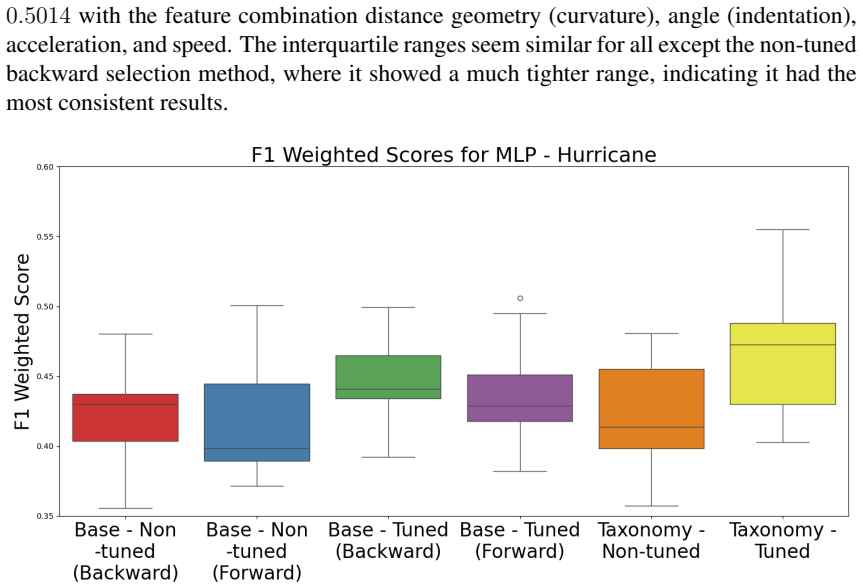
"Therefore, this taxonomy produces 15 different combinations of feature sets to train the models [...] Next, for the taxonomy approach, the same pipeline is used for each of its produced combinations, producing twenty sets of results for each combination. [...] The box plots presented contain the baseline results for both forward and backward selection and the best feature subset result from our taxonomy method. [...] This result was achieved through distance geometry (curvature), angles (indentation) from the taxonomy as its feature combination."
By reporting only the 'best feature subset result' and then identifying the combination that produced it (Tables 4.8/4.10/4.12), the paper defines the taxonomy method's reported score as the maximum over all 15 enumerated combinations of test-fold Weighted-F1 outcomes. The methodology states no rule for fixing a combination on training or validation data before test evaluation, and the forward/backward baselines are given no analogous 15-way choice. Hence the claimed 'comparable or superior predictive performance' is not the performance of a single feature-selection method; it is the maximum of a test-set selection, so the reported performance is forced by the selection criterion rather than derived from the taxonomy's semantic grouping.
full rationale
None of the paper's computational steps reduce to fitted values, and the taxonomy itself is an external input from Yashar et al. [3], so the derivation chain is not circular on those grounds. However, the headline performance comparison is affected by a post-hoc selection step: Section 3.5 defines 15 taxonomy combinations, Section 3.6 runs every combination, and Section 4 reports only the 'best feature subset result.' The text never states that the best combination is chosen on training or validation folds; the results tables list the combination that achieved the best median test Weighted-F1. Thus the reported taxonomy performance is by construction the maximum over 15 test-score draws, while each forward/backward baseline is a single training-time selection. This makes the 'consistently comparable or superior' claim a test-set maximum, not an unbiased estimate of a defined algorithm's predictive performance. The paper's own Section 5.1 concedes that the improvements 'were not statistically significant' and that 'Overall the results of this experiment is inconclusive,' consistent with this concern. Apart from this oracle-selection step, no self-definitional or self-citation circularity is present; the Yashar et al. citation is a same-group input, but the categories are not fitted to the present results.
Assumptions & free parameters
free parameters (2)
- Best taxonomy feature combination per model and dataset =
e.g., distance_geometry + indentation for Arctic Fox Logistic Regression; acceleration for Random Forest
- Hurricane dataset sampling seed =
random_state=42, 200 samples per class, 1000 total
assumptions (3)
- domain assumption The four-category taxonomy (curvature, indentation, speed, acceleration) from Yashar et al. (2025) is a valid grouping for feature selection.
- standard math The sequential feature selector from scikit-learn correctly implements forward and backward selection as described.
- domain assumption Weighted-F1 is an appropriate evaluation metric for these trajectory classification tasks.
Cite this review
Pith. "Pith review of Towards Interpretable and Efficient Feature Selection in Trajectory Datasets: A Taxonomic Approach." pith.science (2026). https://pith.science/paper/MZRSUWM4
@misc{pith2026250620359,
  author       = {Pith},
  title        = {Pith review of: Towards Interpretable and Efficient Feature Selection in Trajectory Datasets: A Taxonomic Approach},
  year         = {2026},
  howpublished = {\url{https://pith.science/paper/MZRSUWM4}},
  note         = {Machine review of arXiv:2506.20359}
}
read the original abstract
Trajectory analysis is not only about obtaining movement data, but it is also of paramount importance in understanding the pattern in which an object moves through space and time, as well as in predicting its next move. Due to the significant interest in the area, data collection has improved substantially, resulting in a large number of features becoming available for training and predicting models. However, this introduces a high-dimensionality-induced feature explosion problem, which reduces the efficiency and interpretability of the data, thereby reducing the accuracy of machine learning models. To overcome this issue, feature selection has become one of the most prevalent tools. Thus, the objective of this paper was to introduce a taxonomy-based feature selection method that categorizes features based on their internal structure. This approach classifies the data into geometric and kinematic features, further categorizing them into curvature, indentation, speed, and acceleration. The comparative analysis indicated that a taxonomy-based approach consistently achieved comparable or superior predictive performance. Furthermore, due to the taxonomic grouping, which reduces combinatorial space, the time taken to select features was drastically reduced. The taxonomy was also used to gain insights into what feature sets each dataset was more sensitive to. Overall, this study provides robust evidence that a taxonomy-based feature selection method can add a layer of interpretability, reduce dimensionality and computational complexity, and contribute to high-level decision-making. It serves as a step toward providing a methodological framework for researchers and practitioners dealing with trajectory datasets and contributing to the broader field of explainable artificial intelligence.
Figures


Figures from the paper (15 more)



Reference graph
Works this paper leans on
-
[1]
Trajectory analysis: An overview,
M. D. Rintoul and A. T. Wilson, “Trajectory analysis: An overview,” Statistical Analysis and Data Mining: The ASA Data Science Journal , vol. 8, no. 5-6, pp. 255–270, 2015. [Online]. Available: https://doi.org/10.1002/sam.11287
-
[2]
Ptrail — a python package for parallel trajectory data preprocessing,
S. Haidri, Y . J. Haranwala, V . Bogorny, C. Renso, V . P. da Fonseca, and A. Soares, “Ptrail — a python package for parallel trajectory data preprocessing,” SoftwareX, vol. 19, p. 101176, 2022. [Online]. Available: https://doi.org/10.1016/j.softx.2022.101176
arXiv 2022
-
[3]
A novel multilevel taxonomical approach for describing high-dimensional unlabeled movement data,
Y . Tavakoli, L. Pena-Castillo, and A. Soares, “A novel multilevel taxonomical approach for describing high-dimensional unlabeled movement data,” 2025, unpublished. [Online]. Available: https://arxiv.org/abs/2504.20174
arXiv 2025
-
[4]
A review of feature selection methods based on meta-heuristic algorithms,
Z. Sadeghian, E. Akbari, H. Nematzadeh, and H. Motameni, “A review of feature selection methods based on meta-heuristic algorithms,” Journal of Experimental & Theoretical Artificial Intelligence, vol. 37, no. 1, pp. 1–51, 2025
work page 2025
-
[5]
Feature selection in machine learning: Methods and comparison,
N. K. Singh and P. S. Sandhu, “Feature selection in machine learning: Methods and comparison,” in 2021 International Conference on Advance Computing and Innovative Technologies in Engineering (ICACITE) , 2021, pp. 563–569. [Online]. Available: https://doi.org/10.1109/ICACITE51222.2021.9404623
arXiv 2021
-
[6]
A survey on big data for trajectory analytics,
D. Ribeiro de Almeida, C. de Souza Baptista, F. Gomes de Andrade, and A. Soares, “A survey on big data for trajectory analytics,”ISPRS International Journal of Geo- Information, vol. 9, no. 2, p. 88, 2020
work page 2020
-
[7]
Enhancing global mar- itime traffic network forecasting with gravity-inspired deep learning models,
R. Song, G. Spadon, R. Pelot, S. Matwin, and A. Soares, “Enhancing global mar- itime traffic network forecasting with gravity-inspired deep learning models,” Sci- entific reports, vol. 14, no. 1, p. 16665, 2024
2024
-
[8]
Multi-path long-term vessel trajectories forecasting with probabilistic feature fusion for problem shifting,
G. Spadon, J. Kumar, D. Eden, J. van Berkel, T. Foster, A. Soares, R. Fablet, S. Matwin, and R. Pelot, “Multi-path long-term vessel trajectories forecasting with probabilistic feature fusion for problem shifting,” Ocean Engineering, vol. 312, p. 119138, 2024
2024
Show all 32 references
-
[9]
A semi-supervised method- ology for fishing activity detection using the geometry behind the trajectory of mul- tiple vessels,
M. D. Ferreira, G. Spadon, A. Soares, and S. Matwin, “A semi-supervised method- ology for fishing activity detection using the geometry behind the trajectory of mul- tiple vessels,” Sensors, vol. 22, no. 16, p. 6063, 2022
2022
-
[10]
A study on the geometric and kine- matic descriptors of trajectories in the classification of ship types,
Y . Tavakoli, L. Peña-Castillo, and A. Soares, “A study on the geometric and kine- matic descriptors of trajectories in the classification of ship types,” Sensors, vol. 22, no. 15, p. 5588, 2022
2022
-
[11]
Assessing com- pression algorithms to improve the efficiency of clustering analysis on ais vessel trajectories,
M. D. Ferreira, J. Campbell, E. Purney, A. Soares, and S. Matwin, “Assessing com- pression algorithms to improve the efficiency of clustering analysis on ais vessel trajectories,” International Journal of Geographical Information Science , vol. 37, no. 3, pp. 660–683, 2023
2023
-
[12]
Uncovering vessel movement patterns from ais data with graph evolution analysis,
E. Carlini, V . M. de Lira, A. Soares, M. Etemad, B. B. Machado, and S. Matwin, “Uncovering vessel movement patterns from ais data with graph evolution analysis,” in EDBT/ICDT Workshops, 2020. 33
2020
-
[13]
Un- derstanding evolution of maritime networks from automatic identification system data,
E. Carlini, V . M. de Lira, A. Soares, M. Etemad, B. Brandoli, and S. Matwin, “Un- derstanding evolution of maritime networks from automatic identification system data,” GeoInformatica, pp. 1–25
-
[14]
Challenges in vessel behavior and anomaly detection: From classical machine learning to deep learning,
L. May Petry, A. Soares, V . Bogorny, B. Brandoli, and S. Matwin, “Challenges in vessel behavior and anomaly detection: From classical machine learning to deep learning,” in Advances in Artificial Intelligence: 33rd Canadian Conference on Ar- tificial Intelligence, Canadian AI...
2020
-
[15]
A trajectory scoring tool for local anomaly detection in maritime traffic using visual analytics,
F. H. Abreu, A. Soares, F. V . Paulovich, and S. Matwin, “A trajectory scoring tool for local anomaly detection in maritime traffic using visual analytics,” ISPRS Inter- national Journal of Geo-Information, vol. 10, no. 6, p. 412, 2021
2021
-
[16]
A dash- board tool for mobility data mining preprocessing tasks,
Y . J. Haranwala, S. Haidri, T. S. Tricco, V . P. da Fonseca, and A. Soares, “A dash- board tool for mobility data mining preprocessing tasks,” in 2022 23rd IEEE In- ternational Conference on Mobile Data Management (MDM) . IEEE, 2022, pp. 278–281
2022
-
[17]
Vessel pattern recognition using trajectory shape feature,
J. Li, H. Liu, X. Chen, J. Li, and J. Xiang, “Vessel pattern recognition using trajectory shape feature,” in Proceedings of the 2021 5th International Conference on Computer Science and Artificial Intelligence, 2021, pp. 1–5. [Online]. Available: https://doi.org/10.1145/350754...
2021
-
[18]
Deep learning for spatio-temporal data mining: A survey,
L. Zhao, D. Wang, X. Li et al., “Deep learning for spatio-temporal data mining: A survey,”IEEE Transactions on Knowledge and Data Engineering, vol. 34, no. 8, pp. 3549–3577, 2022. [Online]. Available: https://doi.org/10.48550/arXiv.1906.04928
-
[19]
Fréchet kernel for trajectory data analysis,
K. Takeuchi, M. Imaizumi, S. Kanda, Y . Tabei, K. Fujii, K. Yoda, M. Ishihata, and T. Maekawa, “Fréchet kernel for trajectory data analysis,” in 29th International Conference on Advances in Geographic Information Systems (SIGSPATIAL ’21) . ACM, 2021, pp. 1–4. [Online]. Availab...
2021
-
[20]
Forward-backward selection with early dropping,
G. Borboudakis and I. Tsamardinos, “Forward-backward selection with early dropping,” Journal of Machine Learning Research , vol. 20, pp. 1–39, 2019. [Online]. Available: http://jmlr.org/papers/v20/17-334.html
2019
-
[21]
A feature selection method for multi-dimension time-series data,
B. Kathirgamanathan and P. Cunningham, “A feature selection method for multi-dimension time-series data,” in Machine Learning and Knowledge Discovery in Databases. Research Track , ser. Lecture Notes in Computer Science, 2021, vol. 12457, pp. 206–221. [Online]. Available: http...
2021
-
[22]
An introduction to variable and feature selection,
I. Guyon and A. Elisseeff, “An introduction to variable and feature selection,” Journal of Machine Learning Research , vol. 3, pp. 1157–1182, 2003. [Online]. Available: http://www.jmlr.org/papers/volume3/guyon03a/guyon03a.pdf
2003
-
[23]
Evolving feature selection: Syner- gistic backward and forward deletion method utilizing global feature importance,
T. Nakanishi, P. Chophuk, and K. Chinnasarn, “Evolving feature selection: Syner- gistic backward and forward deletion method utilizing global feature importance,” IEEE Access, vol. 12, pp. 88 696–88 709, 2024. 34
2024
-
[24]
Multi-dimensional feature selection and com- bination method of aerospace target based on k-means clustering and information entropy,
Y . Gao, J. Wu, C. Sun, and J. Cui, “Multi-dimensional feature selection and com- bination method of aerospace target based on k-means clustering and information entropy,” in 2023 3rd International Conference on Computer, Communication and Artificial Intelligence (CCAI), 2023,...
2023
-
[25]
Cost-sensitive feature selection by optimizing f-measures,
M. Liu, C. Xu, Y . Luo, C. Xu, Y . Wen, and D. Tao, “Cost-sensitive feature selection by optimizing f-measures,”IEEE Transactions on Image Processing, vol. XX, no. X, pp. 1–13, Apr. 2019, [Online]. Available: arXiv:1904.02301
2019 arXiv
-
[26]
Data from: Movement tactics of a mobile predator in a meta-ecosystem with fluctuating resources: the arctic fox in the high arctic,
S. Lai, J. Bêty, and D. Berteaux, “Data from: Movement tactics of a mobile predator in a meta-ecosystem with fluctuating resources: the arctic fox in the high arctic,” 2016
2016
-
[27]
Ais ship type codes reference,
VT Explorer, “Ais ship type codes reference,” 2025, accessed: 2025-05-25. [Online]. Available: https://api.vtexplorer.com/docs/ref-aistypes.html
2025
-
[28]
Interna- tional best track archive for climate stewardship (ibtracs) project, version 4,
K. R. Knapp, H. J. Diamond, J. P. Kossin, M. C. Kruk, and C. J. Schreck, “Interna- tional best track archive for climate stewardship (ibtracs) project, version 4,” 2018
2018
-
[29]
Tabular data: Deep learning is not all you need,
R. Shwartz-Ziv and A. Armon, “Tabular data: Deep learning is not all you need,” Information Fusion , vol. 81, pp. 84–90, 2022. [Online]. Available: https://doi.org/10.1016/j.inffus.2022.01.011
2022 doi
-
[30]
Random forests,
L. Breiman, “Random forests,” Machine Learning, vol. 45, no. 1, pp. 5–32, 2001. [Online]. Available: https://doi.org/10.1023/A:1010933404324
2001 doi
-
[31]
Xgboost: A scalable tree boosting system,
T. Chen and C. Guestrin, “Xgboost: A scalable tree boosting system,” in Proceedings of the 22nd ACM SIGKDD International Conference on Knowledge Discovery and Data Mining , 2016, pp. 785–794. [Online]. Available: https://doi.org/10.1145/2939672.2939785
2016
-
[32]
Learning representations by back-propagating errors,
D. E. Rumelhart, G. E. Hinton, and R. J. Williams, “Learning representations by back-propagating errors,” Nature, vol. 323, no. 6088, pp. 533–536, 1986. 35
1986
Reviewed August 6, 2026 · model on record in the stance chip above.
Discussion (0). Continue with ORCID to comment.