REVIEW 3 major objections 4 minor 16 references
On the Impact of Sybil-based Attacks on Mobile Crowdsensing for Transportation
T0 review · 3 major / 4 minor · reviewed 2026-08-06 · deepseek-v4-flash
Pith's one-line read A coordinated Sybil attack controlling roughly 3% of the user accounts in a navigation crowdsensing system can, under the modeled conditions, raise the average travel time of rerouted benign users by about 20%.
desk verdict Genuine first simulation measurement of Sybil impact on N-MCS travel times, but the headline 20% and 3% figures both overstate the evidence as written. read the letter →
The pith
A machine-rendered reading of the paper's core claim, the machinery that carries it, and where it could break.
The reading
What carries the argument
The load-bearing machinery is a time-based streaming window on the N-MCS server: every second each user reports (id, lane, speed), the server averages the speeds reported for each road in the current window and divides by road length to get a travel-time estimate, and shortest paths are recomputed with Dijkstra's algorithm on that live graph. The adversary's targeting uses betweenness centrality, defined as the fraction of all shortest paths between pairs of nodes that pass through a given node; this identifies vital segments such as bottlenecks and roads with high connectivity. Attacks are simulated by injecting Sybil vehicles that drive at a chosen low speed on the target roads, and the outcome is measured by comparing rerouted users' routes and travel times against a no-attack baseline.
What would settle it
Run the same 54-attack experiment on an N-MCS variant that uses a historical or predicted speed baseline instead of the raw windowed mean, or that filters reports whose trajectories are implausible, and check whether a 3% Sybil population still raises average travel time by about 20%. Alternatively, recompute the paper's headline number as a mean over all affected users (Did Enter plus Did Not Enter) rather than only the rerouted subset; if the increase falls well below 20%, the impact is an effect on rerouted users, not the population.
Extended reading notes
Core claim
On the paper's own terms, the discovery is a quantified cause-and-effect chain: fake low-speed reports on carefully chosen roads propagate through a windowed speed-estimation server into inflated expected travel times, Dijkstra-based routing then avoids those roads, and the resulting detours cost benign users time. The attack's strength is set by Sybil speed when no benign users are on the target road, and by both Sybil count and speed when benign traffic is present, because genuine reports dilute the fake ones. For the population experiments, the authors compare each user's route in the baseline and attack trace, split affected users into those who still entered the target roads ('Did Enter') and those who avoided them ('Did Not Enter'), and compute the mean travel-time difference across 54 attacks weighted by each 'Did Not Enter' sample size; that calculation yields the headline 20% average increase. They also find that attacking roads on several efficient routes at once is more reliably damaging than attacking a cluster of roads, and that attacks in light evening traffic need longer duration to reroute a majority.
Load-bearing premise
The load-bearing assumption is that the emulated N-MCS—a windowed mean of per-second speed reports with Dijkstra routing and no historical data, outlier rejection, or Sybil filtering—is representative enough of real navigation crowdsensing that the measured 20% travel-time impact transfers to practice.
Editorial extensions
If this is right
- A single coordinated attacker with no physical presence on the target road can force an N-MCS user to abandon the fastest route.
- The resources needed to trigger a re-route are set by the gap between the original route's expected travel time and the second-best route's; denser benign traffic on the target raises the required Sybil count.
- Targeting multiple efficient routes simultaneously is the more damaging strategy, because detours from one road push users into other targeted roads.
- Short attacks in calm evening traffic are the least effective; longer attacks reroute a larger majority of affected users.
- If live-only windowed speed estimation is used, the modeled system shows a 3% Sybil population can raise affected users' average travel time by about 20%, motivating Sybil-resilient design.
Reading between the lines
- The reported 20% is an average over the affected users who avoided the target roads, not over the whole N-MCS population; the population-wide average impact would be smaller and depends on how many users are rerouted.
- Real systems that blend historical baselines or learned traffic predictors into their estimates would dilute or mask the fake reports, so the 20% figure is likely an upper bound for such systems rather than a universal expectation.
- The same betweenness-centrality computation that selects attack targets could be used by a defender to prioritize monitoring and plausibility checks on the most vital roads.
- A testable design rule follows: adding any form of Sybil filtering or outlier rejection to the window should reduce both the reroute ratio and the travel-time increase; the paper's setup can be rerun with such filters to measure the reduction.
Editorial analysis
A structured set of objections, weighed in public.
Referee Report
Summary. The paper studies Sybil attacks on navigation MCS (N-MCS) systems. The authors build an N-MCS emulation on top of the SUMO simulator using the InTAS road network, with windowed mean speed estimation and Dijkstra routing, and select adversary targets using betweenness centrality. They mount attacks with varying numbers of Sybils, attack speeds, durations, target road sets, and times of day, measuring effects on an individual victim and on a population subset. The headline result is that Sybil attacks can reroute users and, with Sybils amounting to about 3% of the N-MCS population, increase average travel time by 20%.
Significance. The work addresses a relevant and under-quantified threat to crowdsourced navigation services. Its strengths include use of a realistic SUMO/InTAS traffic scenario, an explicit adversary model, systematic parameter sweeps, and comparison of the emulated N-MCS against the InTAS DTA baseline. The observation that a modest number of Sybil reports can cause substantial delays for rerouted users in a naive N-MCS design is interesting and worth communicating. However, as stated, the headline 20% figure applies only to a selected subset of users and to a limited route segment, and the N-MCS emulation is much simpler than commercial systems; the quantitative generality of the claim is therefore not established.
major comments (3)
- [Section VI.B, Abstract, Conclusion] The claim that 'Sybil attacks ... increased travel time by 20% on average' is computed only over the Did Not Enter set, i.e., users who avoided the target roads, and only over the route segment between the first common starting road and first common ending road around the target. The Did Enter set is excluded with the statement that 'no noticeable metric trends' were seen, but no summary statistics are provided; including those users with their actual, possibly small or negative, deltas would change the population-level average. Moreover, the aggregation weights by the size of each Did Not Enter set but not by the baseline travel time of the affected segment, so the percentage change is not a properly trip-weighted population average. The abstract and conclusion should rephrase the result as applying to rerouted users on the diverged segment, and the paper should report the Did Enter deltas and a clear weighting formula.
- [Section V-B] The N-MCS emulation uses a windowed mean of per-second speed reports, Dijkstra routing, no historical data, and no Sybil filtering. The window slide is selected on the baseline (Fig. 1), which is transparent and not circular. However, the quantitative conclusion is phrased for 'N-MCS' generally, while real systems, as the paper itself notes in Section II, use GNN-based prediction, historical baselines, or outlier detection; such mechanisms would likely attenuate the effect of a naive congestion injection. The paper should either restrict the 20% claim to the emulated system or test the attack against a more realistic N-MCS baseline; otherwise the quantitative headline is not supported for real deployments.
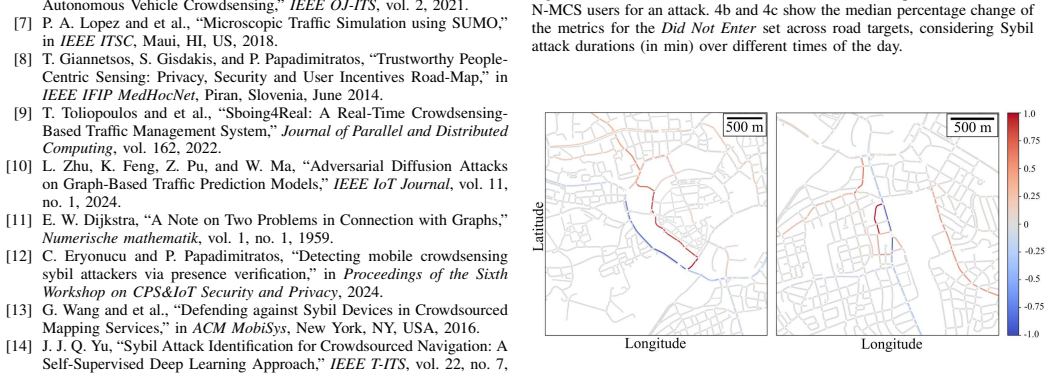
- [Section VI.B, Fig. 4b] The travel-time percentage changes for the Did Not Enter set range from -11% to +504% across the 54 attacks. Reporting a single mean of 20% masks strong heterogeneity and sign differences; in some attacks travel time decreases for the measured segment. The paper should present the distribution (e.g., median and quartiles) and discuss why some attacks reduce travel time for the affected segment. This is especially important because Fig. 4c shows negative time loss for some targets, indicating that the attack is not uniformly harmful.
minor comments (4)
- [Fig. 2 and Table I] The captions for Fig. 2a-2c state '1 Sybil,' whereas Table I lists the number of Sybils as starting at 2. Please clarify whether single-Sybil experiments were performed and update the table or the captions accordingly.
- [Section VI.B] The statement that the Did Enter set showed 'no noticeable metric trends' should be supported by summary statistics (e.g., mean and confidence intervals of travel-time and time-loss changes). An absence of a visible trend in a plot is not a quantitative result.
- [Section VI.B] The phrase 'taking into account the sample size of each set Did Not Enter' is vague. Please specify the exact formula used to aggregate percentage changes across the 54 attacks, including how the route-segment travel-time difference is normalized.
- [Eq. (3)] The denominator in Eq. (3) is described as 'all affected N-MCS users,' but the definition of 'affected' is not precise. Please clarify whether this means users whose baseline route used the target roads during the attack period, and whether users whose route changed before reaching the target are included.
Circularity Check
No circular derivation; the 20% figure is a measured statistic over the rerouted subset, and the only caveats are reporting precision and non-load-bearing self-citations.
full rationale
This is an experimental measurement study, not a derivation. The N-MCS configuration (w.slide=30s) is selected by baseline routing efficiency against InTAS DTA (Sec. VI, Fig. 1), before attacks are run, so it does not encode attack outcomes. Attack parameters (Sybil counts, speeds, durations, targets) are varied independently and summarized in Tables I-II. The claimed 20% average travel-time increase is computed in Sec. VI.B by averaging per-attack differences over the 'Did Not Enter' sets only; the paper itself defines that set and reports 'no noticeable metric trends' for 'Did Enter'. This makes the headline number a genuine measurement for rerouted users, though the abstract's unqualified 'N-MCS users' wording overstates the population scope. That overstatement is a statistical reporting matter, not circularity: there is no fitted parameter renamed as a prediction, no quantity defined in terms of the claim, and no uniqueness theorem imported from the authors' prior work. Self-citations ([2], [5], [6], [12]) motivate the threat model and simulation approach but are not load-bearing for the measured impact; the experimental result is self-contained against the SUMO/InTAS baseline. Therefore no circular step is present; score 2 reflects the minor, non-load-bearing self-citations rather than any circular reduction.
Assumptions & free parameters
free parameters (5)
- N-MCS window slide (w.slide) =
30 s
- N-MCS window size (w.size) =
300 s
- N-MCS user penetration rate =
50%
- Sybil attack speed =
0.5 m/s
- Number of Sybils per target and duration =
Varies, see Table II
assumptions (4)
- domain assumption The InTAS SUMO simulation with DTA provides a realistic urban traffic baseline.
- ad hoc to paper The simplified N-MCS emulation (windowed mean speed, Dijkstra, no historical data, no outlier detection) captures the essential behavior of real N-MCS for the purpose of impact quantification.
- domain assumption The adversary can register and coordinate a large number of authenticated accounts that report arbitrary positions and speeds, without detection by the N-MCS.
- domain assumption Betweenness centrality over the road graph, plus visual inspection, identifies effective attack targets.
Cite this review
Pith. "Pith review of On the Impact of Sybil-based Attacks on Mobile Crowdsensing for Transportation." pith.science (2026). https://pith.science/paper/2FR6E74D
@misc{pith2026250620585,
  author       = {Pith},
  title        = {Pith review of: On the Impact of Sybil-based Attacks on Mobile Crowdsensing for Transportation},
  year         = {2026},
  howpublished = {\url{https://pith.science/paper/2FR6E74D}},
  note         = {Machine review of arXiv:2506.20585}
}
read the original abstract
Mobile Crowd-Sensing (MCS) enables users with personal mobile devices (PMDs) to gain information on their surroundings. Users collect and contribute data on different phenomena using their PMD sensors, and the MCS system processes this data to extract valuable information for end users. Navigation MCS-based applications (N-MCS) are prevalent and important for transportation: users share their location and speed while driving and, in return, find efficient routes to their destinations. However, N-MCS are currently vulnerable to malicious contributors, often termed Sybils: submitting falsified data, seemingly from many devices that are not truly present on target roads, falsely reporting congestion when there is none, thus changing the road status the N-MCS infers. The attack effect is that the N-MCS returns suboptimal routes to users, causing late arrival and, overall, deteriorating road traffic flow. We investigate exactly the impact of Sybil-based attacks on N-MCS: we design an N-MCS system that offers efficient routing on top of the vehicular simulator SUMO, using the InTAS road network as our scenario. We design experiments attacking an individual N-MCS user as well as a larger population of users, selecting the adversary targets based on graph-theoretical arguments. Our experiments show that the resources required for a successful attack depend on the location of the attack (i.e., the surrounding road network and traffic) and the extent of Sybil contributed data for the targeted road(s). We demonstrate that Sybil attacks can alter the route of N-MCS users, increasing average travel time by 20% with Sybils 3% of the N-MCS user population.
Figures


Figures from the paper (2 more)

Reference graph
Works this paper leans on
-
[1]
ETA Prediction with Graph Neural Networks in Google Maps,
A. Derrow-Pinion and et al., “ETA Prediction with Graph Neural Networks in Google Maps,” in ACM CIKM , Virtual Event Queensland Australia, 2021. TABLE II TOTAL (MAXIMUM ACTIVE ) S YBIL ATTACK STRENGTH PER DURATION WHEN TARGETING AN N-MCS POPULATION SUBSET . Duration (min) Target IV V VI VII VIII IX 20 67 (37) 144 (69) 208 (112) 14 (14) 36 (36) 67 (59) 40 ...
work page 2021
-
[2]
Sybil-Based Attacks on Google Maps or How to Forge the Image of City Life,
C. Eryonucu and P. Papadimitratos, “Sybil-Based Attacks on Google Maps or How to Forge the Image of City Life,” in ACM WiSec , San Antonio, TX, USA, May 2022
work page 2022
-
[3]
Ghost Riders: Sybil Attacks on Crowdsourced Mobile Mapping Services,
G. Wang and et al., “Ghost Riders: Sybil Attacks on Crowdsourced Mobile Mapping Services,” IEEE/ACM ToN, vol. 26, no. 3, 2018
work page 2018
-
[4]
M. B. Sinai, N. Partush, S. Yadid, and E. Yahav, “Exploiting Social Navigation,” 2014. [Online]. Available: https://arxiv.org/abs/1410.0151
arXiv 2014
-
[5]
SHIELD: A Data Verification Framework for Participatory Sensing Systems,
S. Gisdakis, T. Giannetsos, and P. Papadimitratos, “SHIELD: A Data Verification Framework for Participatory Sensing Systems,” in ACM WiSec, New York, NY , USA, 2015
work page 2015
-
[6]
A Platform-Based Incentive Mechanism for Autonomous Vehicle Crowdsensing,
A. Chakeri and et al., “A Platform-Based Incentive Mechanism for Autonomous Vehicle Crowdsensing,” IEEE OJ-ITS , vol. 2, 2021
work page 2021
-
[7]
Microscopic Traffic Simulation using SUMO,
P. A. Lopez and et al., “Microscopic Traffic Simulation using SUMO,” in IEEE ITSC , Maui, HI, US, 2018
work page 2018
-
[8]
Trustworthy People- Centric Sensing: Privacy, Security and User Incentives Road-Map,
T. Giannetsos, S. Gisdakis, and P. Papadimitratos, “Trustworthy People- Centric Sensing: Privacy, Security and User Incentives Road-Map,” in IEEE IFIP MedHocNet , Piran, Slovenia, June 2014
work page 2014
Show all 16 references
-
[9]
Sboing4Real: A Real-Time Crowdsensing- Based Traffic Management System,
T. Toliopoulos and et al., “Sboing4Real: A Real-Time Crowdsensing- Based Traffic Management System,” Journal of Parallel and Distributed Computing, vol. 162, 2022
2022
-
[10]
Adversarial Diffusion Attacks on Graph-Based Traffic Prediction Models,
L. Zhu, K. Feng, Z. Pu, and W. Ma, “Adversarial Diffusion Attacks on Graph-Based Traffic Prediction Models,” IEEE IoT Journal , vol. 11, no. 1, 2024
2024
-
[11]
A Note on Two Problems in Connection with Graphs,
E. W. Dijkstra, “A Note on Two Problems in Connection with Graphs,” Numerische mathematik , vol. 1, no. 1, 1959
1959
-
[12]
Detecting mobile crowdsensing sybil attackers via presence verification,
C. Eryonucu and P. Papadimitratos, “Detecting mobile crowdsensing sybil attackers via presence verification,” in Proceedings of the Sixth Workshop on CPS&IoT Security and Privacy , 2024
2024
-
[13]
Defending against Sybil Devices in Crowdsourced Mapping Services,
G. Wang and et al., “Defending against Sybil Devices in Crowdsourced Mapping Services,” in ACM MobiSys, New York, NY , USA, 2016
2016
-
[14]
Sybil Attack Identification for Crowdsourced Navigation: A Self-Supervised Deep Learning Approach,
J. J. Q. Yu, “Sybil Attack Identification for Crowdsourced Navigation: A Self-Supervised Deep Learning Approach,” IEEE T-ITS, vol. 22, no. 7, 2021
2021
-
[15]
InTAS – The Ingol- stadt Traffic Scenario for SUMO,
S. Lobo, S. Neumeier, E. Fernández, and C. Facchi, “InTAS – The Ingol- stadt Traffic Scenario for SUMO,” SUMO User Conference Proceedings, November 2020
2020
-
[16]
On Variants of Shortest-path Betweenness Centrality and their Generic Computation,
U. Brandes, “On Variants of Shortest-path Betweenness Centrality and their Generic Computation,” Social Networks , vol. 30, no. 2, 2008. Morning Afternoon Evening 20 40 60 20 40 60 20 40 60 20 40 60 20 40 60 20 40 60 Target IV Target V Target VI Target VII Target VIII Target I...
2008
Reviewed August 6, 2026 · model on record in the stance chip above.
Discussion (0). Continue with ORCID to comment.