REVIEW 4 major objections 5 minor 28 references
GRASP-PsONet: Gradient-based Removal of Spurious Patterns for PsOriasis Severity Classification
T0 review · 4 major / 5 minor · reviewed 2026-08-06 · deepseek-v4-flash
Pith's one-line read Removing the 8.2% of training images that a gradient-tracing influence score flags as most responsible for misclassified psoriasis severity cases lifts held-out AUC from 85% to 90%.
desk verdict Legitimate application of TracIn/self-influence to a real clinical dataset, but the AUC gain is unproven without a random-removal baseline; the annotation-discrepancy finding is the most valuable part. read the letter →
The pith
A machine-rendered reading of the paper's core claim, the machinery that carries it, and where it could break.
The reading
What carries the argument
The engine is the TracIn influence score, computed as a sum over training checkpoints of the Adam-normalized gradient of the loss on the training image dotted with the gradient of the loss on the misclassified validation image; high positive scores mark training images whose presence most raised validation loss. In the weakly supervised multi-instance framework the unit of scoring is a single image, not a patient visit, so flagged images can be dropped individually while keeping the visit's other 45 images. A second mechanism, self-influence (the TracIn score of a training image against itself), is used as a label-noise detector, with high self-influence assumed to flag mislabeled or atypical images.
What would settle it
Retrain the same ConvNeXT MIL model after removing an equal number of training images chosen at random, matched to the top-300 removal count (2,292 images); if random removal reproduces the 85% to 90% AUC gain, then the TracIn-based selection is not the operative cause of the improvement.
Extended reading notes
Core claim
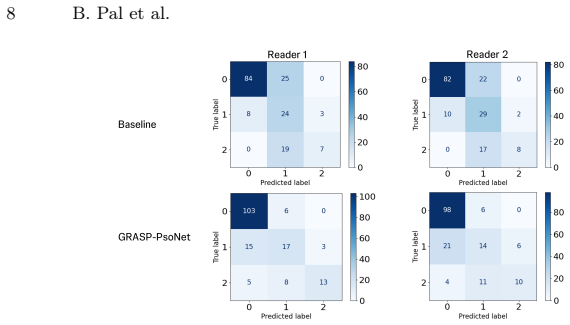
The central claim is that the training samples most responsible for validation misclassifications, identified by summing gradient-dot-product terms over training checkpoints (the TracIn score), are disproportionately the samples carrying annotation inconsistencies or non-clinical artifacts, and that pruning them is what unlocks generalization. The paper demonstrates this on the GRASP-PsONet pipeline: a ConvNeXT (or ViT) encoder feeding an attention-based MIL aggregator over 46 images per patient visit. On the held-out test set, removing the top-300 influential training images per misclassified validation visit improves Reader 1 AUC from 0.85 to 0.90 and Reader 2 AUC from 0.86 to 0.89, with a convex effect: removing too few (top-100) buys little and removing too many (top-500, 13.3%) hurts, dropping AUC to 0.83 and 0.80. The paper further claims that self-influence scores, a sample's influence on its own prediction, identify inter-rater label disagreement: over 90% of the disagreements in a 100-visit doubly rated subset sit in the top 30% of the self-influence ranking.
Load-bearing premise
The claim that the removed images are the harmful ones rests on a before-and-after comparison only: the paper does not test whether deleting the same number of images at random produces the same AUC gain, so the improvement could come from shrinking the training set rather than from what the gradient tracing identified.
Editorial extensions
If this is right
- Removing the top-300 flagged images per misclassified validation visit (8.2% of training data) raises held-out test AUC by about 5 points for ConvNeXT, and the ViT encoder's best-row AUC rises from 0.72 to 0.89 under the same procedure, so the pruning effect is not tied to one architecture.
- There is a sweet spot in how many images to remove: top-100 and top-200 buy little, top-300 is best for ConvNeXT, and top-500 (13.3%) overshoots and degrades performance, so the method needs a tuning knob per task.
- The self-influence ranking concentrates label disagreements in a small, reviewable fraction of the data, so annotation audits can be targeted rather than exhaustive.
- Because images are scored individually, a visit with ambiguous labels is not discarded wholesale; only the offending images go, preserving most of the training signal.
- Cohen's Kappa improves alongside AUC for the best ConvNeXT setting (0.53 to 0.62 for Reader 1), suggesting the pruned model's severity calls align more closely with human raters.
Reading between the lines
- The paper's causal reading, that gradient-traced images are the harmful ones, is not yet separated from the alternative that any modest targeted data cut helps; a random-removal control at the same removal count would settle that.
- The same TracIn sieve should transfer to other weakly supervised medical settings with per-subject labels and artifact-prone acquisition, such as whole-slide pathology or multi-field fundus photography, where per-image influence can be computed the same way.
- A natural extension the authors gesture at is to re-score flagged images instead of deleting them; if re-scored images are re-introduced, the pipeline becomes a data-cleaning loop rather than a data-loss procedure.
- Because the inter-rater experiment uses only 100 randomly chosen visits with a maintained 84:16 label-agreement split, the 90.3% recall figure is a small-sample estimate whose precision depends on that ratio and on the specific rater pair.
Signed reviews
Editorial analysis
A structured set of objections, weighed in public.
Referee Report
Summary. The paper proposes GRASP-PsONet, a data-pruning framework for psoriasis severity classification from patient-captured mobile images. The method uses TracIn-style gradient tracing from misclassified validation visits to rank and remove influential training images, then retrains a ConvNeXT- or ViT-based multi-instance learning classifier. On a held-out test set, removing 8.2% of flagged training images improves ConvNeXT AUC-ROC from 0.85 to 0.90 (Reader 1) and from 0.86 to 0.89 (Reader 2); the ViT encoder also improves when 13.3% are removed. In a separate experiment, self-influence scores are reported to identify 90.3% of inter-rater label disagreements within the top 30% of a 100-visit doubly rated subset. The central claims are that gradient-traced images are the harmful ones and that self-influence can flag annotation inconsistencies.
Significance. If the causal claim is established, the work would provide a practical data-curation tool for medical imaging with noisy labels, and the annotation-consistency detection result could reduce manual review burden. The use of published TracIn and self-influence methods is appropriate, and the application to real-world patient photos with two independent dermatologist raters is clinically relevant. However, the experimental design does not yet support the causal attribution: the removal effect is not compared against random removal, the pruning amount is selected using the test set, and no repeated-seed variability is reported. The self-influence result is promising but is demonstrated on a small, stratified subset without a random-ordering baseline or confidence intervals. The strengths are the real-data setting, the two-reader evaluation, and the explicit connection to gradient-based influence estimation; the weaknesses are the missing controls and selection procedure.
major comments (4)
- [Section 4, Table 1] The causal claim that TracIn-flagged images are the harmful ones is not supported because the only ablation is the number of removed images, not the selection mechanism. Removing 2,292 of 28,060 images (8.2%) could improve test AUC through generic data shrinkage, altered training dynamics, or retraining with a different seed. A matched random-removal control, with the same number of images removed at each k and repeated over multiple seeds, is essential to attribute the improvement to TracIn selection.
- [Section 3.3, Table 1] The hyperparameter k is selected using test-set AUC: the paper reports the best-k results for ConvNeXT (k=300) and ViT (k=500) after inspecting Table 1, which lists test-set performance for multiple k values. This is an optimistic selection procedure and invites overfitting to the test set. The authors should either fix k a priori on clinical or computational grounds, or select k on the validation set and report test performance only for the chosen k, ideally with the full k-sweep clearly labeled as exploratory.
- [Section 3.3, Table 1] All reported numbers come from single training runs without error bars, confidence intervals, or multiple seeds. Given that only 9 of 64 validation visits are misclassified and that training is stochastic, the observed AUC gains of 0.02–0.05 may be within run-to-run variability. Repeated-seed experiments with mean and standard deviation (or bootstrap confidence intervals) are needed to establish that the improvements are reliable.
- [Section 3.4, Figure 3] The claim that self-influence identifies 90.3% of inter-rater disagreements within the top 30% of a 100-visit subset needs a random-ordering baseline and an uncertainty estimate. With only 100 visits and an enforced 84:16 same/different-label ratio, the result corresponds to roughly 14–15 of about 16 disagreements, so the precision of the 90.3% figure is low. The authors should also clarify whether disagreement is defined at the PASI severity-class level (mild/moderate/severe) or at the numeric PASI level, and report recall at other operating points with a random baseline.
minor comments (5)
- [Section 2.3, Eq. (TracIn)] The displayed TracIn formula omits the dot product with the training gradient and appears to define the score using only the validation gradient; this is inconsistent with Algorithm 1, which includes the dot product ∇L(wt,z')·∇L(wt,z). The text should be corrected to match the algorithm.
- [Section 3.3] The text says the top-100 to top-500 removals represent 3–16% of the training dataset (900–4,500 images), but Table 1 shows actual unique removal counts of 794–3,734 images, corresponding to 2.8–13.3%. The percentages should be harmonized.
- [Abstract and Contributions] The contribution statement says the method improves AUC by approximately 5% and 10% for ConvNeXT and ViT, respectively. For ViT, Table 1 shows AUC improvements of 17 points (0.72 to 0.89) for Reader 1 and 12 points (0.72 to 0.84) for Reader 2; the stated 10% figure is unclear and should be revised or defined as a relative improvement.
- [Section 3.4] The sentence about reconstructing the dataset to include test data independently scored by two readers, yielding 780 patient visits, is confusing because the test set is already part of the original 844-visit split. The authors should clarify what dataset is used for the self-influence experiment and how the 780-visit number is derived.
- [Table 1] The ViT rows list only k=100, 300, and 500, while the ConvNeXT rows include k=100, 200, 300, 400, and 500. Please either report the full k-sweep for ViT or state why intermediate values are omitted.
Circularity Check
No circular derivation; the reported AUC gains and disagreement-detection results are empirical evaluations against held-out targets, not outputs of the method's definitions.
full rationale
I walked the derivation chain and found no step in which a claimed result is defined in terms of its own input. The central empirical claim is that removing the top-k TracIn-ranked training images and retraining improves test AUC-ROC (Table 1). TracIn is adopted from Pruthi et al. [20] as an external method, and the paper's Algorithm 1 implements the standard gradient-dot-product approximation; no equation in the paper defines the test AUC or the inter-rater agreement rate in terms of TracIn scores. The self-influence experiment in Section 3.4 is an evaluation: self-influence scores are computed from Reader 1 training labels, while the target is independently measured Reader 1/Reader 2 disagreement on a held-out subset, so the target is not used to construct the scores. The only author-overlapping citation is the PSO-Net MIL backbone [9], which is used as the architecture and baseline, not as a theorem or a uniqueness argument that forces the data-removal conclusion. The TracIn equation in Section 2.3 omits the dot product with the training gradient present in Algorithm 1, but this is an internal presentation inconsistency, not circular reasoning. The strongest soundness concerns are not circularity: the paper lacks a random-removal control, reports no repeated-seed variance, and selects the reported best k from the test set, so the causal role of TracIn-selected images is not fully established. Those are statistical-control and generalizability limitations, not cases of a fitted parameter being renamed as a prediction or of a self-citation chain carrying the argument. Accordingly, the circularity score is 0.
Assumptions & free parameters
free parameters (1)
- k (number of top influential images removed per misclassified validation visit) =
300 for ConvNeXT, 500 for ViT
assumptions (6)
- standard math Taylor expansion L(wt+1,z') is approximately L(wt,z') plus the first-order gradient term, ignoring higher-order terms
- domain assumption The most-attended image per misclassified patient visit faithfully represents the visit-level error
- domain assumption High TracIn influence on a misclassified validation image identifies training images that are harmful to generalization
- domain assumption ImageNet-pretrained encoder features transfer to patient-captured psoriasis photos
- domain assumption High self-influence flags mislabeled or atypical training samples
- domain assumption The 84:16 same/different label ratio in the 100-visit subset matches the full doubly-rated dataset
Cite this review
Pith. "Pith review of GRASP-PsONet: Gradient-based Removal of Spurious Patterns for PsOriasis Severity Classification." pith.science (2026). https://pith.science/paper/4T7KQRV6
@misc{pith2026250621883,
  author       = {Pith},
  title        = {Pith review of: GRASP-PsONet: Gradient-based Removal of Spurious Patterns for PsOriasis Severity Classification},
  year         = {2026},
  howpublished = {\url{https://pith.science/paper/4T7KQRV6}},
  note         = {Machine review of arXiv:2506.21883}
}
read the original abstract
Psoriasis (PsO) severity scoring is important for clinical trials but is hindered by inter-rater variability and the burden of in person clinical evaluation. Remote imaging using patient captured mobile photos offers scalability but introduces challenges, such as variation in lighting, background, and device quality that are often imperceptible to humans but can impact model performance. These factors, along with inconsistencies in dermatologist annotations, reduce the reliability of automated severity scoring. We propose a framework to automatically flag problematic training images that introduce spurious correlations which degrade model generalization, using a gradient based interpretability approach. By tracing the gradients of misclassified validation images, we detect training samples where model errors align with inconsistently rated examples or are affected by subtle, nonclinical artifacts. We apply this method to a ConvNeXT based weakly supervised model designed to classify PsO severity from phone images. Removing 8.2% of flagged images improves model AUC-ROC by 5% (85% to 90%) on a held out test set. Commonly, multiple annotators and an adjudication process ensure annotation accuracy, which is expensive and time consuming. Our method detects training images with annotation inconsistencies, potentially removing the need for manual review. When applied to a subset of training data rated by two dermatologists, the method identifies over 90% of cases with inter-rater disagreement by reviewing only the top 30% of samples. This improves automated scoring for remote assessments, ensuring robustness despite data collection variability.
Figures


Reference graph
Works this paper leans on
-
[1]
In: International Conference on Medical Image Computing and Computer-Assisted Intervention
Bayasi, N., Hamarneh, G., Garbi, R.: Culprit-prune-net: Efficient continual se- quential multi-domain learning with application to skin lesion classification. In: International Conference on Medical Image Computing and Computer-Assisted Intervention. pp. 165–175. Springer (2021)
work page 2021
-
[2]
British Journal of Dermatology155(4), 707–713 (2006)
Berth-Jones, J., Grotzinger, K., Rainville, C., Pham, B., Huang, J., Daly, S., Herd- man,M.,Firth,P.,Hotchkiss,K.:Astudyexamininginter-andintraraterreliability of three scales for measuring severity of psoriasis: Psoriasis area and severity in- dex, physician’s global assessment and lattice system physician’s global assessment. British Journal of Dermatol...
work page 2006
-
[3]
In: 2009 IEEE conference on computer vision and pattern recognition
Deng, J., Dong, W., Socher, R., Li, L.J., Li, K., Fei-Fei, L.: Imagenet: A large- scale hierarchical image database. In: 2009 IEEE conference on computer vision and pattern recognition. pp. 248–255. Ieee (2009)
2009
-
[4]
Advances in Neural Information Processing Systems32 (2019)
Hara, S., Nitanda, A., Maehara, T.: Data cleansing for models trained with sgd. Advances in Neural Information Processing Systems32 (2019)
work page 2019
-
[5]
Data-Centric Diet: Effective Multi-center Dataset Pruning for Medical Image Segmentation
He, Y., Chen, M., Yang, Z., Lu, Y.: Data-centric diet: Effective multi-center dataset pruning for medical image segmentation. arXiv preprint arXiv:2308.01189 (2023)
work page Pith review arXiv 2023
-
[6]
Holste,G.,Jiang,Z.,Jaiswal,A.,Hanna,M.,Minkowitz,S.,Legasto,A.C.,Escalon, J.G., Steinberger, S., Bittman, M., Shen, T.C., et al.: How does pruning im- pact long-tailed multi-label medical image classifiers? In: International Conference on Medical Image Computing and Computer-Assisted Intervention. pp. 663–673. Springer (2023)
work page 2023
-
[7]
ACM Computing Surveys57(6), 1–46 (2025)
Hossain, M.I., Zamzmi, G., Mouton, P.R., Salekin, M.S., Sun, Y., Goldgof, D.: Ex- plainable ai for medical data: current methods, limitations, and future directions. ACM Computing Surveys57(6), 1–46 (2025)
work page 2025
-
[8]
Journal of Medical Internet Research 25, e44932 (2023)
Huang, K., Wu, X., Li, Y., Lv, C., Yan, Y., Wu, Z., Zhang, M., Huang, W., Jiang, Z., Hu, K., et al.: Artificial intelligence–based psoriasis severity assessment: Real- world study and application. Journal of Medical Internet Research 25, e44932 (2023)
work page 2023
Show all 28 references
-
[9]
arXiv preprint arXiv:2501.18782 (2025)
Kamran, S.A., Lucas, M.V., Lutnick, B., Parmar, C., Pal, B., Shah, A.P., Apfel, D., Fakharzadeh, S., Miller, L., Yip, S., et al.: Pso-net: Development of an auto- mated psoriasis assessment system using attention-based interpretable deep neural networks. arXiv preprint arXiv:2...
2025 arXiv
-
[10]
arXiv preprint arXiv:1412.6980 (2014)
Kingma, D.P.: Adam: A method for stochastic optimization. arXiv preprint arXiv:1412.6980 (2014)
2014 arXiv
-
[11]
In: International conference on machine learning
Koh, P.W., Liang, P.: Understanding black-box predictions via influence functions. In: International conference on machine learning. pp. 1885–1894. PMLR (2017)
2017
-
[12]
In: Proceedings of the AAAI conference on artificial intelligence
Li, Y., Wu, Z., Zhao, S., Wu, X., Kuang, Y., Yan, Y., Ge, S., Wang, K., Fan, W., Chen, X., et al.: Psenet: Psoriasis severity evaluation network. In: Proceedings of the AAAI conference on artificial intelligence. vol. 34, pp. 800–807 (2020)
2020
-
[13]
Nature medicine26(6), 900–908 (2020) 10 B
Liu,Y.,Jain,A.,Eng,C.,Way,D.H.,Lee,K.,Bui,P.,Kanada,K.,deOliveiraMar- inho, G., Gallegos, J., Gabriele, S., et al.: A deep learning system for differential diagnosis of skin diseases. Nature medicine26(6), 900–908 (2020) 10 B. Pal et al
2020
-
[14]
Advances in neural information processing systems30 (2017)
Lundberg, S.M., Lee, S.I.: A unified approach to interpreting model predictions. Advances in neural information processing systems30 (2017)
2017
-
[15]
SIAM/ASA Journal on Uncertainty Quantification 2(1), 245–251 (2014)
Owen, A.B.: Sobol’indices and shapley value. SIAM/ASA Journal on Uncertainty Quantification 2(1), 245–251 (2014)
2014
-
[16]
SIAM/ASA Journal on Uncertainty Quantification5(1), 986–1002 (2017)
Owen, A.B., Prieur, C.: On shapley value for measuring importance of dependent inputs. SIAM/ASA Journal on Uncertainty Quantification5(1), 986–1002 (2017)
2017
-
[17]
In: 2016 23rd International Conference on Pattern Recognition (ICPR)
Pal, A., Chaturvedi, A., Garain, U., Chandra, A., Chatterjee, R.: Severity grad- ing of psoriatic plaques using deep cnn based multi-task learning. In: 2016 23rd International Conference on Pattern Recognition (ICPR). pp. 1478–1483. IEEE (2016)
2016
-
[18]
In: International Workshop on Computer-Assisted and Robotic Endoscopy
Pal, A., Chaturvedi, A., Garain, U., Chandra, A., Chatterjee, R., Senapati, S.: Severity assessment of psoriatic plaques using deep cnn based ordinal classification. In: International Workshop on Computer-Assisted and Robotic Endoscopy. pp. 252–259. Springer (2018)
2018
-
[19]
Advances in neural information processing sys- tems 32 (2019)
Paszke, A., Gross, S., Massa, F., Lerer, A., Bradbury, J., Chanan, G., Killeen, T., Lin, Z., Gimelshein, N., Antiga, L., et al.: Pytorch: An imperative style, high- performance deep learning library. Advances in neural information processing sys- tems 32 (2019)
2019
-
[20]
Advances in Neural Information Processing Systems 33, 19920–19930 (2020)
Pruthi, G., Liu, F., Kale, S., Sundararajan, M.: Estimating training data influence by tracing gradient descent. Advances in Neural Information Processing Systems 33, 19920–19930 (2020)
2020
-
[21]
Journal of the American Academy of Dermatology50(1), 50–54 (2004)
Resneck Jr, J., Kimball, A.B.: The dermatology workforce shortage. Journal of the American Academy of Dermatology50(1), 50–54 (2004)
2004
-
[22]
why should i trust you?
Ribeiro, M.T., Singh, S., Guestrin, C.: " why should i trust you?" explaining the predictions of any classifier. In: Proceedings of the 22nd ACM SIGKDD interna- tional conference on knowledge discovery and data mining. pp. 1135–1144 (2016)
2016
-
[23]
Journal of the European Academy of Dermatology and Venereology 36(1), 68–75 (2022)
Schaap, M.J., Cardozo, N.J., Patel, A., de Jong, E.M., van Ginneken, B., Seyger, M.M.: Image-based automated psoriasis area severity index scoring by convolu- tional neural networks. Journal of the European Academy of Dermatology and Venereology 36(1), 68–75 (2022)
2022
-
[24]
In: International conference on machine learning
Sundararajan, M., Taly, A., Yan, Q.: Axiomatic attribution for deep networks. In: International conference on machine learning. pp. 3319–3328. PMLR (2017)
2017
-
[25]
Digital Biomarkers8(1), 13–21 (2024)
Xing,Y.,Zhong,S.,Aronson,S.L.,Rausa,F.M.,Webster,D.E.,Crouthamel,M.H., Wang, L.: Deep learning-based psoriasis assessment: Harnessing clinical trial imag- ing for accurate psoriasis area severity index prediction. Digital Biomarkers8(1), 13–21 (2024)
2024
-
[26]
In: JOURNAL OF THE AMERICAN ACADEMY OF DERMATOLOGY
Yao, D., Guo, J., Wu, H., Lu, C.: A study examining interrater reliability of the psoriasis area and severity index (pasi) after training with a new handbook for a multicenter clinical trial. In: JOURNAL OF THE AMERICAN ACADEMY OF DERMATOLOGY. vol. 79, pp. AB25–AB25. MOSBY-ELS...
2018
-
[27]
Advances in neural information processing systems 31 (2018)
Yeh, C.K., Kim, J., Yen, I.E.H., Ravikumar, P.K.: Representer point selection for explaining deep neural networks. Advances in neural information processing systems 31 (2018)
2018
-
[28]
In: Journal of Investigative Dermatology Symposium Proceedings
Zhou, Y., Sheng, Y., Gao, J., Zhang, X.: Dermatology in china. In: Journal of Investigative Dermatology Symposium Proceedings. vol. 17, pp. 12–14. Elsevier (2015)
2015
Reviewed August 6, 2026 · model on record in the stance chip above.
Discussion (0). Continue with ORCID to comment.