REVIEW 3 major objections 5 minor 1 cited by
Learning Individual Reproductive Behavior from Aggregate Fertility Rates via Neural Posterior Estimation
T0 review · 3 major / 5 minor · reviewed 2026-08-06 · deepseek-v4-flash
Pith's one-line read Age-specific fertility rates alone can recover individual reproductive behavior, including desired family size, timing, and contraceptive failure, via neural posterior estimation.
desk verdict Promising approach with a strong validation design, but the fecundability function as written admits negative probabilities, so the central claim is not supported as is. read the letter →
The pith
A machine-rendered reading of the paper's core claim, the machinery that carries it, and where it could break.
The reading
What carries the argument
The load-bearing object is the coupling of an interpretable individual-level microsimulator with Sequential Neural Posterior Estimation (SNPE), specifically the Automatic Posterior Transformation variant in which a neural spline flow learns the posterior p(θ | ASFRs) from simulated parameter-data pairs. The simulator tracks a cohort of women month by month; each woman draws lognormal ages at sexual initiation and intentional reproduction, a Weibull desired family size, and a lognormal birth spacing. Monthly conception probability is baseline fecundability φ(x) modeled with two Bernstein basis polynomials, and contraception multiplies it by κ, then by κ² once desired parity is reached. The aggregate summaries are the only observations, so SNPE must invert an intractable likelihood; the paper shows that this inversion succeeds and that adding age-specific unplanned fertility rates or informative priors sharpens the timing parameters.
What would settle it
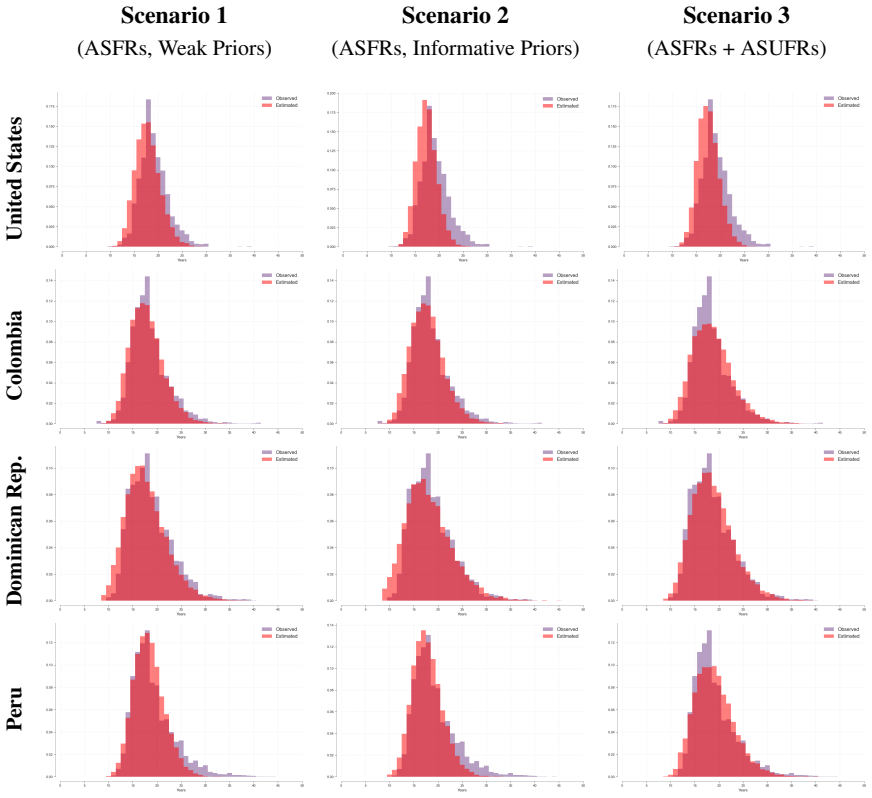
Fit the same model to a DHS cohort in which most births to women under 18 are reported as planned or wanted, using only ASFRs, and compare the posterior-predicted distributions of age at first sex, desired family size, and birth intervals against the survey microdata; if the distributions diverge badly while the ASFR fit remains good, the population-selection criterion is load-bearing.
Extended reading notes
Core claim
On the paper's own terms, the discovery is that the micro-macro gap in fertility research can be closed: aggregate age-specific fertility rates (ASFRs) are a sufficient statistical input for recovering interpretable micro-level parameters of reproductive behavior. Using cross-validation on simulated data, the authors show that all eleven parameters of their monthly-step simulation—ages of sexual initiation and intentional reproduction, desired family size and spacing distributions, contraceptive failure, and the age-fecundability curve—are identifiable from ASFRs alone, with most posterior distributions substantially sharper than their priors. The central empirical result is that posterior samples trained only on ASFRs generate synthetic life histories whose distributions of age at first sex, desired family size, and birth intervals match survey microdata that never entered the estimation. The paper frames this as a statistically grounded bridge from population-level records to the behavioral mechanisms that drive fertility trends.
Load-bearing premise
The analysis is restricted to populations where more than half of births to women under 18 were declared unplanned; if that selection is doing the work, the findings may not extend to settings where early childbearing is intended or marriage-centered.
Editorial extensions
If this is right
- Behaviorally meaningful parameters—mean desired family size, age at intentional reproduction, and contraceptive failure—can be estimated for any population with ASFRs, even without micro-survey data.
- The same framework can generate complete synthetic life histories, so building microsimulation models no longer requires individual-level training data.
- Fertility forecasts can be made behaviorally explicit: future scenarios become changes in underlying behavioral parameters rather than extrapolated aggregate schedules.
- Adding informative priors or age-specific unplanned fertility rates sharpens estimates of timing parameters like birth spacing and the gap to intentional reproduction.
- The model tracks unplanned births even when trained only on overall rates, which makes unintended fertility analyzable in data-scarce settings.
Reading between the lines
- The paper's own selection criterion—populations where most under-18 births are declared unplanned—means the strongest form of the claim is conditional; outside such settings, unplanned-fertility data or different summary statistics may be required.
- If the identifiability result generalizes, long ASFR time series from vital statistics could be mined to track historical shifts in desired family size and contraceptive failure without any new surveys.
- The model's smooth desired-family-size distribution cannot represent the sharp norm-driven spike at exactly two children seen in the data; a mixture distribution with mass at two children is a direct testable extension that should reduce the reported Peru mismatch.
- A natural next application is education- or region-disaggregated ASFRs, which the paper identifies as a route to modeling heterogeneity in reproductive behavior.
Signed reviews
Editorial analysis
A structured set of objections, weighed in public.
Referee Report
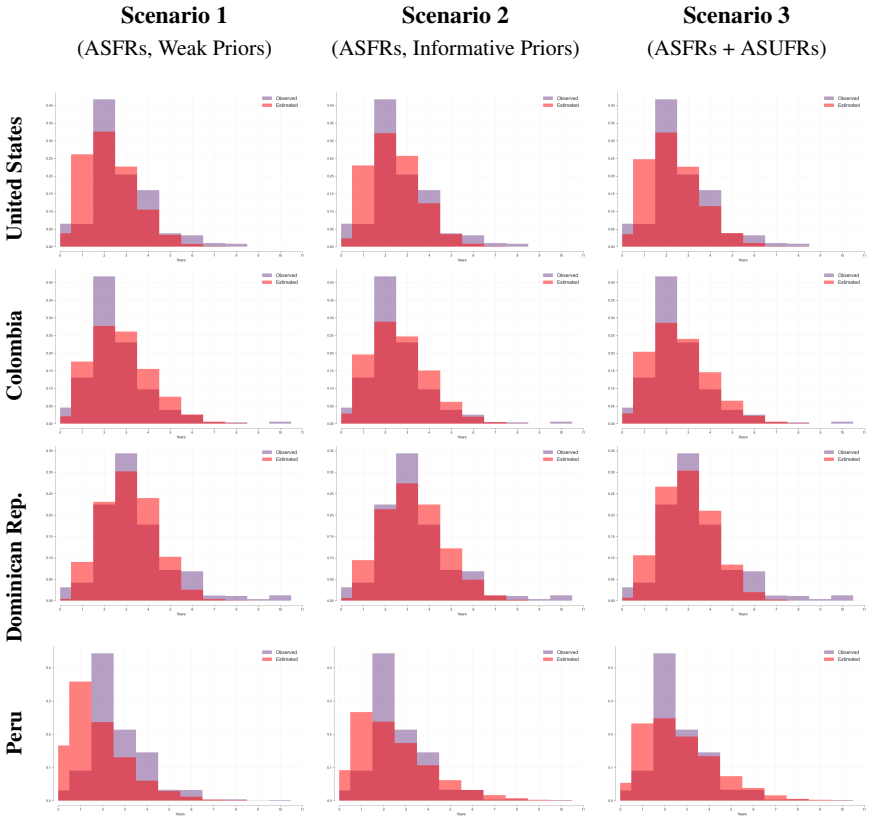
Summary. The paper proposes a likelihood-free Bayesian framework that couples an interpretable, individual-level simulation model of reproductive behavior with Sequential Neural Posterior Estimation (SNPE), with the goal of inferring micro-level behavioral parameters from aggregate age-specific fertility rates (ASFRs). The model assigns each simulated woman an age at sexual initiation, an age at intentional reproduction, a desired family size, and a desired birth spacing, and simulates monthly conception under a fecundability curve with contraceptive failure. The authors evaluate the framework in three scenarios: weak priors with ASFRs only, informative priors with ASFRs, and weak priors with both ASFRs and age-specific unplanned fertility rates (ASUFRs). Validation consists of 25-fold cross-validation on simulated data, posterior predictive checks for observed ASFRs, and out-of-sample comparisons of simulated micro-level distributions (age at first sex, desired family size, birth intervals) against survey data for cohorts in the United States, Colombia, the Dominican Republic, and Peru. The central claim is that core behavioral parameters governing contemporary fertility can be recovered from ASFRs alone.
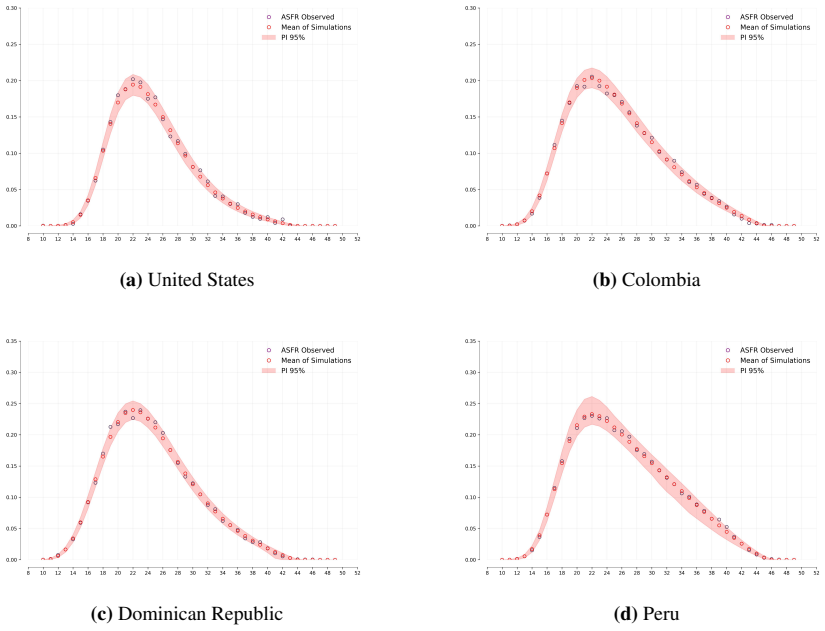
Significance. If the central claim holds, the paper would be a valuable methodological contribution: it would demonstrate that a behaviorally explicit microsimulation model can be estimated from widely available aggregate data, reducing the data requirements for microsimulation and opening the door to behaviorally grounded forecasts. The validation strategy is thoughtfully designed: the 25-fold cross-validation directly probes internal identifiability, the posterior predictive checks assess aggregate fit, and the Scenario 1 out-of-sample comparisons are genuinely external because micro-level distributions are not used in estimation. The four-country comparison across different fertility regimes is a strength, as is the use of a modern SBI method in a demographic application. However, two issues substantially weaken the paper as written: the fecundability curve is not constrained to be a valid probability, and the main out-of-sample validation is presented as a point-prediction exercise despite large posterior uncertainty in several timing parameters.
major comments (3)
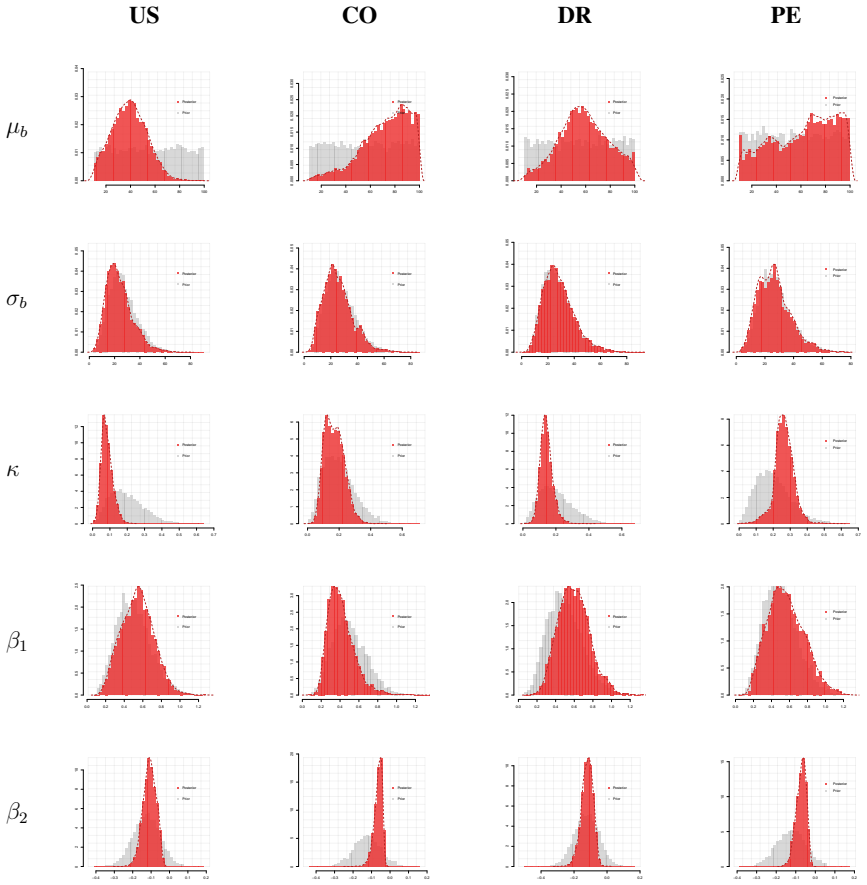
- [§2.1, fecundability expression] The monthly conception probability is specified as φ(x) = β1[3xs(1−xs)^2] + β2[3xs^2(1−xs)], with no constraint stating that φ must lie in [0,1]. The prior shown in Figure 3 assigns substantial mass to negative β2 values, and the Scenario 1 posteriors for all four countries also have negative β2 support. For a posterior-supported pair such as β1≈0.4 and β2≈−0.3, evaluating at xs≈0.7 gives φ≈−0.057, a negative probability. As written, the simulator is therefore not a valid generative model on a non-negligible part of the parameter space, and the SNPE posterior is not a posterior for any coherent stochastic process. If the implementation clips or rejects negative φ values, then the actual generative model differs from the one described, and the reported posterior predictive checks and out-of-sample distributions validate a different model. This issue must be resolved, for example by reparameterizing β1 and β2 with explicit bounds or by specifying and justifying a clipping/projection rule in the model definition, and the experiments should be rerun under the corrected simulator.
- [§5.3.1, Figure 4] The main out-of-sample validation is presented as a comparison between observed micro distributions and a single simulation driven by the posterior mean, yet Figure 4's caption refers to 'posterior draws', and the appendix figures are described as posterior predictive distributions. This inconsistency matters because Figure 3 shows that several timing parameters, especially δr, μb, and σb, have wide posteriors that remain close to their priors under Scenario 1. A single point prediction can appear accurate by averaging over competing behavioral explanations, and it does not convey the posterior uncertainty in the predicted micro distributions. The paper should report posterior predictive distributions with credible intervals for the out-of-sample micro outcomes, and should clarify whether the appendix figures already do so.
- [§5.3 / abstract] The abstract states that the framework 'successfully recovers core behavioral parameters governing contemporary fertility, including ... reproductive timing', but Section 5.3 explicitly reports that δr, μb, and σb are poorly constrained by ASFRs alone, with posteriors close to their priors. The cross-validation section reports lower RMSE in Scenarios 2 and 3 for nearly every parameter, but it does not quantify how poorly δr, μb, and σb are recovered in Scenario 1. The claims in the abstract and Discussion should be tempered to reflect that ASFRs alone identify the level and shape of fertility well but provide limited information on the precise timing of intentional reproduction and spacing.
minor comments (5)
- [§5.2.1] There is a typo: 'the observed ASRFs' should read 'the observed ASFRs'.
- [§4 / GitHub statement] The GitHub repository is described as private with access on request. For a methods paper whose central contributions are reproducibility and a new estimation workflow, a public code release (or an anonymized supplement at review time) is important for verification of the fecundability issue raised above.
- [Figure 1] The cross-validation scatterplots in Figure 1 lack axis labels and units, making it difficult to assess the scale of recovery errors. Adding units and, ideally, error bars or credible intervals for the posterior means would improve interpretability.
- [§4.2] The prior distributions for β1 and β2 are described only in prose; the text should state the exact distribution families and hyperparameters, especially because the fecundability constraint issue hinges on the prior support.
- [§3] The country-selection criterion is a substantive modeling assumption; it would be helpful to state in the abstract or introduction that the framework is evaluated in settings where early fertility is predominantly unintended, so that readers immediately understand the scope of the empirical claims.
Circularity Check
Central Scenario 1 derivation is self-contained; auxiliary Scenarios 2 and 3 contain construction-based circularity for the desired-family-size validation.
-
self definitional
[Section 3 (ASUFR classification) via Scenario 3 (Section 4.1) and Appendix Figure 8]
"Scenario 3: ASFRs and ASUFRs with Weak Priors. This scenario tests the impact of adding more detailed data. We revert to the weakly informative priors from Scenario 1, but we augment the summary statistics to include both simulated ASFRs and age-specific unplanned fertility rates. … The classification of a birth as unplanned is based on a harmonized strategy across the DHS and NSFG that combines direct survey questions about birth timing with a parity check (i.e., whether the birth exceeded the mother’s ideal family size)."
In Scenario 3, ASUFRs are added as summary statistics, and those ASUFRs are constructed from each mother's ideal family size via the parity check. The model's own D_i is 'desired family size', and Appendix Figure 8 validates the model against the survey desired-family-size distribution under Scenario 3. The validation target is therefore the same construct that was used to define part of the inference data, so Scenario 3's agreement on desired family size is partially built in by construction. This is a scenario-level circularity; the main-text Scenario 1 results do not use ASUFRs.
-
fitted input called prediction
[Section 4.1 (Scenario 2 informative priors) and Appendix Figure 8]
"The informative priors used in Scenario 2 simulate a context where a researcher might leverage external information to improve estimates. For the mean desired family size ( µd), we construct the prior directly from the empirical survey distribution for the U.S. case, mimicking a situation where such summary data is readily available. For the remaining two parameters, we simulate the process of knowledge transfer from a data-rich to a data-poor setting by using the posteriors from our most data-intensive setup (Scenario 3) as the informative priors for Scenario 2."
Scenario 2 is presented as a test of informative priors, and Appendix Figure 8 presents Scenario 2 as 'out-of-sample validation for the distribution of Desired Family Size'. But for the U.S., the Scenario 2 prior on μd is constructed directly from the empirical survey distribution of desired family size, so the posterior predictive distribution of that same outcome is forced by the prior, not discovered from ASFRs. The δr and μb priors are taken from Scenario 3 posteriors, which in turn used ASUFRs built from the ideal-family-size construct, so they are not independent external constraints. The claim 'none of which inform the estimation step' is therefore not true of Scenario 2, although it is true of Scenario 1.
full rationale
The central derivation chain for the paper's headline claim is Scenario 1: ASFRs with weak priors. In that scenario, the simulator maps parameters (including μd, δr, κ, β1, β2) to aggregate ASFRs; no micro-level distribution enters the estimation. The cross-validation, posterior predictive checks, and out-of-sample comparisons to age at first sex, desired family size, and birth intervals are external to the fitted data, so the main claim does not reduce to its inputs. The two circularities found are confined to auxiliary inference scenarios: Scenario 3's ASUFR summary statistics are partially defined by ideal family size, the same construct used to validate desired family size; and Scenario 2 constructs its μd prior from the empirical target distribution. Because these scenario-level validations are presented as supporting out-of-sample evidence (Appendix Figures 7-9), the paper somewhat overstates the breadth of its validation, but the central Scenario 1 result remains independent. The self-citation to Ciganda and Todd (2024) is contextual rather than load-bearing. The Bernstein-coefficient sign issue raised by the skeptic is a model-validity/correctness concern, not a circularity, and is not scored here.
Assumptions & free parameters
free parameters (11)
- µs (mean age at sexual initiation) =
posterior mean varies by country (Figure 3)
- σs (SD of age at sexual initiation) =
posterior mean varies by country (Figure 3)
- δr (gap between sexual initiation and intentional reproduction) =
posterior mean varies by country (Figure 3)
- σr (SD of age at intentional reproduction) =
posterior mean varies by country (Figure 3)
- µd (mean desired family size) =
posterior mean varies by country (Figure 3)
- σd (SD of desired family size) =
posterior mean varies by country (Figure 3)
- µb (mean desired birth spacing) =
posterior mean varies by country (Figure 3)
- σb (SD of desired birth spacing) =
posterior mean varies by country (Figure 3)
- κ (monthly contraceptive failure probability) =
posterior mean varies by country (Figure 3)
- β1 (Bernstein coefficient for fecundability peak) =
posterior mean varies by country (Figure 3)
- β2 (Bernstein coefficient for fecundability decline) =
posterior mean varies by country (Figure 3)
assumptions (8)
- domain assumption Age at sexual initiation, age at intentional reproduction, and birth spacing follow lognormal distributions; desired family size follows a Weibull distribution
- domain assumption Fecundability is modeled by two Bernstein basis polynomials of degree 3, forced to zero at ages 10 and 50
- domain assumption Contraceptive use is binary (trying versus not trying), with failure probability κ or κ² after reaching desired parity
- domain assumption Cohorts are homogeneous: all women share the same parameter distributions
- domain assumption Selected DHS countries represent populations where early childbearing is primarily unintended
- standard math SNPE/APT with neural spline flows yields asymptotically correct posterior approximations
- standard math Survey sampling weights yield unbiased population estimates
- domain assumption Fecundability remains non-negative for all parameter settings
Cite this review
Pith. "Pith review of Learning Individual Reproductive Behavior from Aggregate Fertility Rates via Neural Posterior Estimation." pith.science (2026). https://pith.science/paper/DDJ4HNSS
@misc{pith2026250622607,
  author       = {Pith},
  title        = {Pith review of: Learning Individual Reproductive Behavior from Aggregate Fertility Rates via Neural Posterior Estimation},
  year         = {2026},
  howpublished = {\url{https://pith.science/paper/DDJ4HNSS}},
  note         = {Machine review of arXiv:2506.22607}
}
read the original abstract
Age-specific fertility rates (ASFRs) provide the most extensive record of reproductive change, but their aggregate nature obscures the individual-level behavioral mechanisms that drive fertility trends. To bridge this micro-macro divide, we introduce a likelihood-free Bayesian framework that couples a demographically interpretable, individual-level simulation model of the reproductive process with Sequential Neural Posterior Estimation (SNPE). We show that this framework successfully recovers core behavioral parameters governing contemporary fertility, including preferences for family size, reproductive timing, and contraceptive failure, using only ASFRs. The framework's effectiveness is validated on cohorts from four countries with diverse fertility regimes. Most compellingly, the model, estimated solely on aggregate data, successfully predicts out-of-sample distributions of individual-level outcomes, including age at first sex, desired family size, and birth intervals. Because our framework yields complete synthetic life histories, it significantly reduces the data requirements for building microsimulation models and enables behaviorally explicit demographic forecasts.
Figures

Figures from the paper (6 more)



Forward citations
Cited by 1 Pith paper
-
Simulation-Based Inference: A Practical Guide
A practical tutorial for simulation-based inference, with a structured workflow, reusable code, and three worked examples validated by calibration diagnostics.
Reference graph
Works this paper leans on
-
[1]
Female age-related fertility decline
(2014). Female age-related fertility decline. Committee Opinion No. 589, American College of Ob- stetricians and Gynecologists 123 (3), 719–721. Published jointly in Obstetrics & Gynecology and Fertility & Sterility. 29
work page 2014
-
[2]
Beaumont, M. A. (2010). Approximate bayesian computation in evolution and ecology.Annual review of ecology, evolution, and systematics 41 , 379–406
work page 2010
- [3]
-
[4]
Boelts, J., M. Deistler, M. Gloeckler, Á. Tejero-Cantero, J.-M. Lueckmann, G. Moss, P. Steinbach, T. Moreau, F. Muratore, J. Linhart, et al. (2024). sbi reloaded: a toolkit for simulation-based inference workflows. arXiv preprint arXiv:2411.17337
arXiv 2024
-
[5]
Bongaarts, J. (1977). A dynamic model of the reproductive process. Population Studies 31(1), 59–73
work page 1977
-
[6]
Bongaarts, J. and R. Lightbourne (1992). Fertility preferences in latin america: trends and differentials in seven countries. Notas De Población 20(55), 79–102
work page 1992
-
[7]
Brass, W. (1958). The distribution of births in human populations in rural taiwan. Population Stud- ies 12(1), 51–72
work page 1958
-
[8]
Brass, W. (1974). Perspectives in population prediction: Illustrated by the statistics of england and wales. Journal of the Royal Statistical Society Series A: Statistics in Society 137 (4), 532–570
work page 1974
Show all 35 references
-
[9]
Casterline, J. B. and L. O. El-Zeini (2007). The estimation of unwanted fertility. Demography 44(4), 729–745
2007
-
[10]
Chandola, T., D. A. Coleman, and R. W. Hiorns (1999). Recent european fertility patterns: Fitting curves to’distorted’distributions. Population Studies, 317–329
1999
-
[11]
Ciganda, D. and N. Todd (2024). Modelling the age pattern of fertility: an individual-level approach. Royal Society Open Science 11 (11), 240366
2024
-
[12]
Coale, A. J. and T. J. Trussell (1974). Model fertility schedules: variations in the age structure of childbearing in human populations. Population index, 185–258
1974
-
[13]
Dax, M., S. R. Green, J. Gair, N. Gupte, M. Pürrer, V . Raymond, J. Wildberger, J. H. Macke, A. Buo- nanno, and B. Schölkopf (2025). Real-time inference for binary neutron star mergers using machine learning. Nature 639(8053), 49–53
2025
-
[14]
Deistler, M., J. H. Macke, and P. J. Gonçalves (2022). Energy-efficient network activity from disparate circuit parameters. Proceedings of the National Academy of Sciences 119 (44), e2207632119
2022
-
[15]
Dunson, D. B., B. Colombo, and D. D. Baird (2002). Changes with age in the level and duration of fertility in the menstrual cycle. Human reproduction 17(5), 1399–1403
2002
-
[16]
Bekasov, I
Durkan, C., A. Bekasov, I. Murray, and G. Papamakarios (2019). Neural spline flows. Advances in neural information processing systems 32
2019
-
[17]
Gini, C. (1924). Premières recherches sur la fécondabilité de la femme. In North-Holland: (Ed.), Proceedings of the International Mathematical Congress. , V olume V ol. 2., Toronto. 30 Gonçalves, P. J., J.-M. Lueckmann, M. Deistler, M. Nonnenmacher, K. Öcal, G. Bassetto, C. Ch...
1924
-
[18]
Nonnenmacher, and J
Greenberg, D., M. Nonnenmacher, and J. Macke (2019). Automatic posterior transformation for likelihood-free inference. In International Conference on Machine Learning , pp. 2404–2414. PMLR
2019
-
[19]
Groschner, L. N., J. G. Malis, B. Zuidinga, and A. Borst (2022). A biophysical account of multiplica- tion by a single neuron. Nature 603(7899), 119–123
2022
-
[20]
Hartig, F., J. M. Calabrese, B. Reineking, T. Wiegand, and A. Huth (2011). Statistical inference for stochastic simulation models–theory and application. Ecology letters 14(8), 816–827
2011
-
[21]
Henry, L. (1953). Fondements théoriques des mesures de la fécondité naturelle. Revue de l’Institut International de Statistique / Review of the International Statistical Institute 21 (3), 135–151
1953
-
[22]
Hoem, B. and J. M. Hoem (1989). The impact of women’s employment on second and third births in modern sweden. Population Studies 43(1), 47–67. Kerry L. D., Lindsay Mallick, and Courtney Allen (2017). Sexual and reproductive health in early and later adolescence: DHS data on yo...
1989
-
[23]
Larsen, U. and S. Yan (2000). The age pattern of fecundability: an analysis of french canadian and hutterite birth histories. Social biology 47 (1-2), 34–50
2000
-
[24]
Potter, R. G. (1972). Additional births averted when abortion is added to contraception. Studies in family planning 3(4), 53–59
1972
-
[25]
Ridley, J. C. and M. C. Sheps (1966). An analytic simulation model of human reproduction with demographic and biological components. Population Studies 19(3), 297–310
1966
-
[26]
Schmertmann, C. P. (2003). A system of model fertility schedules with graphically intuitive parame- ters. Demographic research 9, 81–110
2003
-
[27]
Schwartz, D. and M. J. Mayaux (1982). Female fecundity as a function of age: results of artificial insemination in 2193 nulliparous women with azoospermic husbands. New England Journal of Medicine 306(7), 404–406
1982
-
[28]
Singh, S. (1963). Probability models for the variation in the number of births per couple. Journal of the American Statistical Association 58 (303), 721–727
1963
-
[29]
Sobotka, T. and É. Beaujouan (2014). Two Is Best? The Persistence of a Two-Child Family Ideal in Europe. Population and Development Review 40(3), 391–419
2014
-
[30]
Rozet, O
Vasist, M., F. Rozet, O. Absil, P. Mollière, E. Nasedkin, and G. Louppe (2023). Neural posterior estimation for exoplanetary atmospheric retrieval. Astronomy & Astrophysics 672, A147. 31 von Krause, M., S. T. Radev, and A. V oss (2022). Mental speed is high until age 60 as rev...
2023
-
[31]
Weinstein, M., J. W. Wood, M. A. Stoto, and D. D. Greenfield (1990). Components of age-specific fecundability. Population Studies 44(3), 447–467
1990
-
[32]
Collumbien, E
Wellings, K., M. Collumbien, E. Slaymaker, S. Singh, Z. Hodges, D. Patel, and N. Bajos (2006). Sexual behaviour in context: a global perspective. The Lancet 368(9548), 1706–1728
2006
-
[33]
Wesselink, A. K., K. J. Rothman, E. E. Hatch, E. M. Mikkelsen, H. T. Sørensen, and L. A. Wise (2017). Age and fecundability in a north american preconception cohort study. American journal of obstetrics and gynecology 217 (6), 667–e1
2017
-
[34]
Westoff, C. F. and N. B. Ryder (2015). The contraceptive revolution. Princeton University Press
2015
-
[35]
Xie, Y . (2000). Demography: Past, present, and future. Journal of the American Statistical Associa- tion 95(450), 670–673. 32
2000
Reviewed August 6, 2026 · model on record in the stance chip above.
Discussion (0). Continue with ORCID to comment.