REVIEW 3 major objections 6 minor 19 references
Large Scale Wind Driven Structures in the Orion Nebula
T0 review · 3 major / 6 minor · reviewed 2026-08-06 · deepseek-v4-flash
Pith's one-line read Using [C II] and HI 21-cm data together, the paper argues that the [C II] Shell belongs to the same foreground layer as HI Veil-B, forming an Outer Shell expanding toward us at up to 15 km s$^{-1}$, with a faster 27 km s$^{-1}$ Inner…
desk verdict Plausible and important reinterpretation of Orion's large-scale structure, but the central velocity-coincidence argument needs a quantitative consistency check before the [C II] Shell and HI Veil-B can be treated as one physical layer. read the letter →
The pith
A machine-rendered reading of the paper's core claim, the machinery that carries it, and where it could break.
The reading
What carries the argument
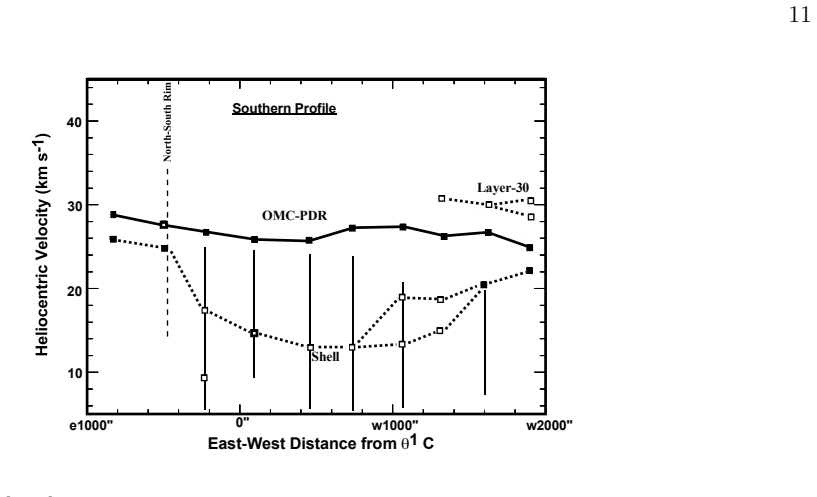
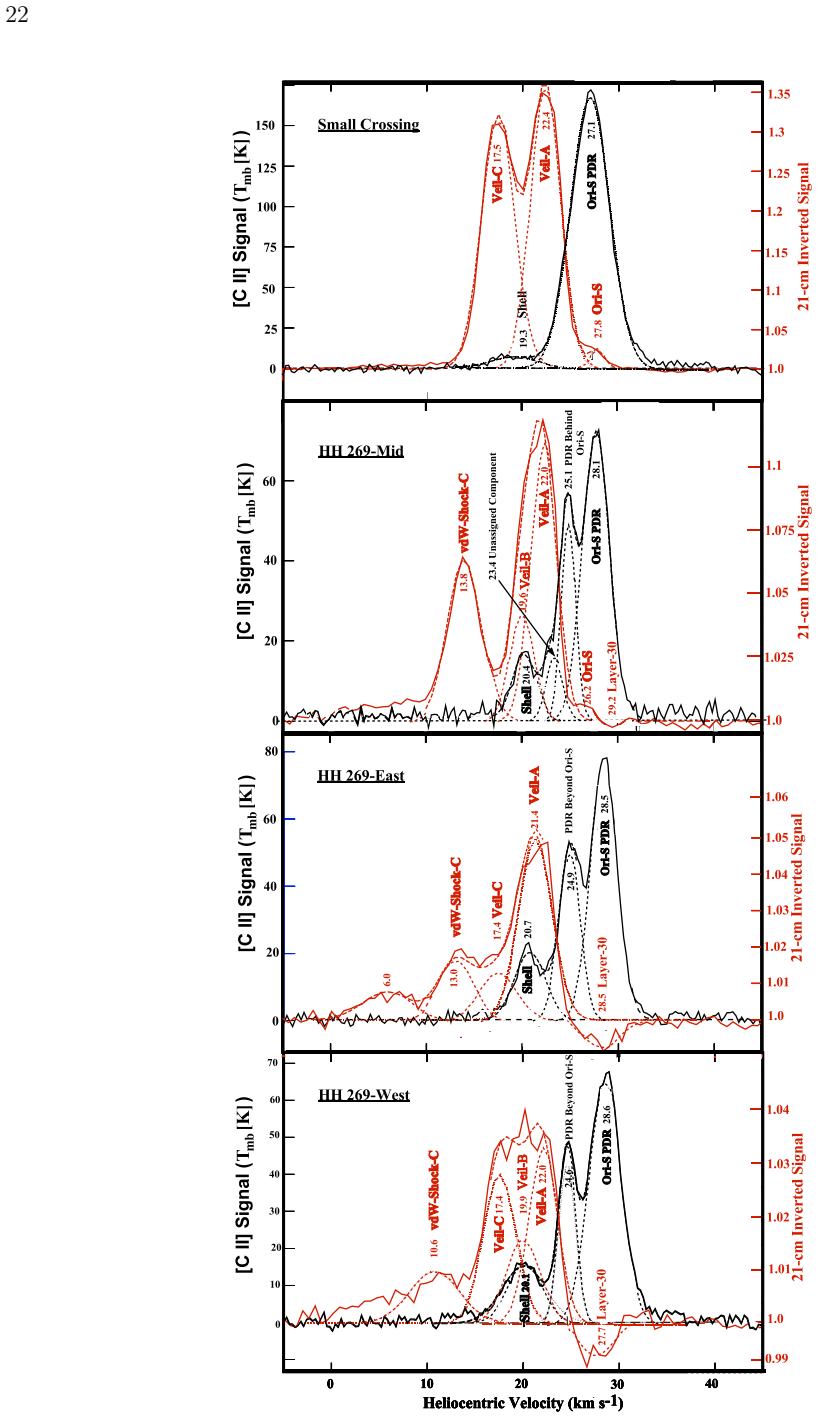
The argument is carried by co-aligned, velocity-resolved profiles of [C II] 158-micron emission and HI 21-cm absorption and emission, measured along five long east-west and north-south cuts through the Huygens Region and the Extended Orion Nebula, plus position-velocity diagrams from the same data. The load-bearing object is the velocity-system identification: the [C II] Shell component at $20.0$ km s$^{-1}$ is matched to the HI Veil-B component at $19.3$ km s$^{-1}$, and their joint structure is then treated as a single Outer Shell whose concavity, rather than closure, is read from the gradual rather than abrupt velocity convergence with the underlying molecular cloud. A second tool is the H$\beta$ equivalent-width map, which separates local emission from scattered light and shows that the outer [C II] brightness is a photodissociation region lit by EUV-filtered Trapezium radiation; a published photodissociation model of the Veil-B layer is then used to predict the [C II] intensity, a check that currently misses by a factor of about six and is flagged for future revision.
What would settle it
Measure the HI 21-cm optical depth of the Veil-B layer with a beam matched to the 16-arcsecond [C II] data across the whole nebula, and compare the two tracers channel by channel: if the Outer Shell is one physical feature, the HI column density and [C II] emissivity must track each other in velocity and position everywhere, including the western side where the shell never closes, and a photodissociation model must be able to reproduce both the observed [C II] intensity (currently a factor of six above the published prediction) and the measured HI column. Decorrelated column densities at the same velocities would show that the two tracers come from separate layers, falsifying the unification.
Extended reading notes
Core claim
The paper's central claim is a unification: the [C II] 158-micron component called the Shell, previously interpreted as a self-contained expanding hemisphere, has a heliocentric velocity of $20.0$ km s$^{-1}$ that is essentially identical to the $19.3$ km s$^{-1}$ of the HI Veil-B foreground layer, so the two are declared the same physical feature, renamed the Outer Shell. In this picture the Outer Shell is a bulge blown into a foreground neutral layer whose undisturbed velocity is near $26$ km s$^{-1}$, accelerated toward the observer with a maximum expansion velocity of $15$ km s$^{-1}$, rather than a closed hemisphere. Closer to the dominant star $\theta^1$ Ori C, a newly recognized Inner Shell reaches radial velocities near $0$ km s$^{-1}$ (expansion $27$ km s$^{-1}$) and probably records a more recent strong-wind episode from one or more Trapezium stars, while a central high-ionization bubble expands freely toward us but is slowed on its far side by photoionized gas streaming off the main ionization front. The bright [C II] rim beyond the nebula's optical boundaries is attributed not to limb-brightening of the shell but to a photodissociation region illuminated by Trapezium radiation that has had its ionizing EUV photons filtered out by residual neutral hydrogen.
Load-bearing premise
The unified Outer Shell rests on the near-equality of two radial velocities — $20.0$ km s$^{-1}$ for the [C II] (ionized carbon) shell and $19.3$ km s$^{-1}$ for the HI (neutral hydrogen) Veil-B layer — treated as proof that both tracers see the same gas; if they are separate layers that merely lie along one line of sight, the central claim collapses.
Editorial extensions
If this is right
- Future studies should treat the [C II] Shell and HI Veil-B as one structure, the Outer Shell, with a maximum expansion velocity of $15$ km s$^{-1}$, rather than as separate phenomena.
- The $27$ km s$^{-1}$ Inner Shell implies at least two wind episodes from $\theta^1$ Ori C or other Trapezium stars, so one-epoch stellar-wind models of the nebula are incomplete.
- The bright [C II] rim outside the optical nebula should be modeled as a photodissociation region illuminated by EUV-filtered Trapezium radiation, replacing the limb-brightening interpretation.
- The embedded Ori-S cloud shows a photodissociation region on both its near and far sides because it is optically thin at 158 microns, and its outflow shocks appear in both [C II] and HI within the HH 269 complex.
- The Layer-30 velocity component appears in both tracers across the Huygens Region, the Dark Bay, and much of the northern Extended Orion Nebula, and it must lie in the foreground if it produces the sodium and calcium absorption lines seen in the Trapezium stars.
Reading between the lines
- Beyond the paper: if the unification holds, the wind momentum budget changes — the same stellar wind thought to inflate a free-shell bubble must instead accelerate a substantial pre-existing HI column, implying a longer-lived or more powerful wind than the closed-hemisphere model required, a quantity the paper does not compute.
- Beyond the paper: the clearest test is HI 21-cm mapping at the [C II] resolution over the western side of the nebula, where the shell never closes; a single Outer Shell predicts that the two tracers' velocity fields continue to track each other there, while coincidental alignment in the Huygens Region would decouple.
- Beyond the paper: the factor-of-six excess of observed over predicted [C II] intensity implies the unified layer is denser, closer to $\theta^1$ Ori C, or richer in carbon than the current Veil-B model assumes, so a revised photodissociation model matching both tracers is a concrete, testable consequence of this geometry.
- Beyond the paper: the pairing of a $15$ km s$^{-1}$ outer shell with a $27$ km s$^{-1}$ inner shell suggests an episodic wind history for the Trapezium stars, and the ratio of their radii and velocities could yield an estimate of the interval between wind episodes that stellar-evolution modeling could check.
Editorial analysis
A structured set of objections, weighed in public.
Referee Report
Summary. The paper combines [C II] 158 µm maps (Pabst et al. 2019, 2020), HI 21-cm data (van der Werf et al. 2013), and optical/UV spectra to argue for a revised layered structure of the Orion Nebula. The central claims are: (1) the blue-shifted [C II] 'Shell' and the HI Veil-B component are the same foreground layer, jointly named the Outer Shell, with maximum expansion velocity 15 km/s; (2) a second 'Inner Shell' with expansion velocity 27 km/s lies closer to θ1 Ori C; (3) a central high-ionization bubble expands freely toward the observer; and (4) the bright [C II] emission beyond the EON rim is not limb-brightening but a PDR illuminated by EUV-filtered Trapezium radiation. Supporting results include a Layer-30 component in both HI and [C II], a +1.9 km/s redshift of the Dark Bay, and HH 269 kinematics.
Significance. The paper's importance is conditional on the Outer Shell identification. If correct, it changes the physical interpretation of the Pabst et al. [C II] shell from a separate wind-blown hemisphere to an accelerated foreground neutral layer, and it would connect a decades-old HI absorption system to a modern [C II] dataset. The paper's strengths are its multi-wavelength synthesis, its use of EW measurements to test the limb-brightening hypothesis, and its candid reporting of the factor-of-six discrepancy between the adopted Veil-B model and the observed [C II] intensity. Those strengths do not by themselves establish the central identification.
major comments (3)
- [§10.2.4, Table 2] The identification of the [C II] Shell (20.0±0.8 km/s) with HI Veil-B (19.3±0.5 km/s) is presented as 'strong evidence' from velocity coincidence. Velocity coincidence of two tracers along the same sightline is suggestive, but the authors themselves provide a quantitative test in §10.2.5: the Abel et al. (2016) model of Veil-B/Component III predicts a [C II] 158 µm intensity of 8×10⁻⁵ erg cm−2 s−1 sr−1, a factor of six below the observed 5.12×10⁻⁴ erg cm−2 s−1 sr−1. Since this model is the quantitative physical description of Veil-B, the identification currently fails the consistency test it should pass if both emissions arise in the same gas. The proposed revisions (C/H ratio, HI column, distance) are deferred to future work. Please add an independent consistency check—for example a predicted [C II] column density or excitation temperature compared with the data, or geometric continuity of the Veil-B layer—or temper the identification claim accordingly.
- [§6.1, §6.3.1, §10.2.7] The Inner Shell is inferred from a scattered set of blue-shifted velocity components rather than from a quantitative shell fit. The text itself notes that the Southern Profile component 'lacks the shell properties seen in the Northern Profile' (§6.3.1) and that there is only 'marginal evidence' for an even more blue-shifted shell (§10.2.7). Without a fitted geometry (center, radius, expansion law) or a demonstration that the scattered components trace a coherent concave structure, the claim of a distinct 27 km/s expanding shell is not yet established. Please present a quantitative position-velocity model or state the shell parameters with uncertainties.
- [§7, §10.2.4] The HI data used for the comparison are usable only in the Huygens Region; §7 states that the range is limited because only there are signals large enough for analysis in both tracers. The identification of the [C II] Shell with HI Veil-B is therefore based on a single overlap region. The paper nevertheless concludes that the joint 'Outer Shell' covers the Huygens Region, the EON, and the Outer Border. This is an extrapolation unless the paper demonstrates geometric continuity (e.g., matching velocity gradient and column density across the rim) between Veil-B and the [C II] Shell outside the Huygens Region.
minor comments (6)
- [Figure 19] Figure 19 has no caption beyond 'c.f. Section 8.3'; please provide a real caption describing the panels.
- [Table 1] Table 1 contains typographical errors ('T able', 'F our'); please correct them.
- [§8.3] The text refers to 'HH 268-Mid', which is presumably a typo for HH 269-Mid; please check and correct all such instances.
- [Figure 23] The Figure 23 caption says 'subtract18 for LSR' while §1 states that LSR-to-Heliocentric conversion is done by adding 18.1 km/s; please make the convention consistent.
- [Abstract and text] The abstract and text contain formatting artifacts such as 'ThetaOne OrionisC' and 'Hbeta'; please use standard notation (θ1 Ori C and Hβ).
- [§10.2.5] The citation 'Abel et al (2016)' should be 'Abel et al. (2016)' to match the reference list style.
Circularity Check
No significant circularity: the Outer Shell identification rests on an empirical velocity coincidence, and the authors' prior Veil-B model is used as an independent (though failing) consistency check, not as a fitted input.
full rationale
The paper's central claim that the [C II] Shell and the H I Veil-B layer form one Outer Shell is an empirical kinematical identification, not a derivation from fitted parameters. The load-bearing comparison in Sections 7 and 10.2.4 is a direct measurement-to-measurement coincidence: the [C II] Shell velocity of 20.0 km/s is compared with the H I Veil-B velocity of 19.3 km/s (Table 2). These come from different tracers and independent data sets, so the identification is falsifiable, even if it would be strengthened by column-density or geometric checks. The authors' prior models (Abel et al. 2016, 2019) are used to characterize Veil-B and to predict a [C II] intensity, but that model was constructed from radio, optical, and UV absorption data and does not use the [C II] measurement as an input; Section 10.2.5 explicitly reports that the predicted intensity is a factor of six lower than observed and defers a revised model to future work. This is a genuine failed independent prediction, not a circular one. The expansion velocities of 15 and 27 km/s are read directly from measured velocity separations in the profiles (Sections 6.1-6.4) rather than extracted from a fitted model. The paper's self-citations provide context and prior absorption-line assignments, but the decisive kinematical comparison is performed with the present data (Figures 15-16 and Table 2). The main weaknesses identified by the skeptic, namely the factor-of-six intensity mismatch and the restriction of usable H I data to the Huygens Region, are correctness and scope limitations, not circularity. The score is therefore low, reflecting only minor reliance on the authors' earlier component identifications.
Assumptions & free parameters
assumptions (5)
- domain assumption The Orion Nebula is a concave blister of photoionized gas on the near side of the Orion Molecular Cloud.
- ad hoc to paper A match in radial velocity between two tracers indicates the same physical structure.
- ad hoc to paper Manual Gaussian decomposition with the minimum number of components recovers the true velocity components.
- domain assumption The equivalent width of H beta is a proxy for the FUV/EUV ratio that controls [C II] emissivity.
- domain assumption The velocity of 27.3 km/s (from CO) represents the systemic velocity of the region, so deviations define expansion velocities.
invented entities (1)
-
Inner Shell
Cite this review
Pith. "Pith review of Large Scale Wind Driven Structures in the Orion Nebula." pith.science (2026). https://pith.science/paper/BQZ4FSBL
@misc{pith2026250702147,
  author       = {Pith},
  title        = {Pith review of: Large Scale Wind Driven Structures in the Orion Nebula},
  year         = {2026},
  howpublished = {\url{https://pith.science/paper/BQZ4FSBL}},
  note         = {Machine review of arXiv:2507.02147}
}
read the original abstract
A study of [C II] 158 micron and HI 21-cm spectroscopic images plus high velocity resolution optical and ultraviolet spectra has shown the structure of the Orion Nebula to be different from that found from the study of those data separately. The [C II] features recently identified as the [C II] Shell is shown to be part of the Veil-B HI foreground layer. Jointly called the Outer Shell, it covers the bright Huygens Region and the Extended Orion Nebula. Its maximum expansion velocity is 15 km/s. Closer to ThetaOne OrionisC there is a second expanding shell, called the Inner Shell. It has an expansion velocity of 27 km/s and probably results from a more recent period of strong wind from one or more of the Trapezium stars. Even closer to ThetaOne OrionisC there is a central high ionization bubble, freely expanding towards the observer but slowed in the opposite direction by photo-ionized gas coming off the Main Ionization Front. Utilization of spectroscopic measures of the equivalent width of Hbeta shows that the enhanced emission in [C II] seen just outside the visual wavelength boundaries of the Orion Nebula is not caused by limb-brightening of the Outer Shell. This enhanced emission is due to the radiation field of the Trapezium stars being filtered by intervening residual neutral hydrogen. A velocity component near 30 km/s (Heliocentric) first seen in HI is also present in [C II] and may result from a foreground cloud of the ISM.
Figures


Figures from the paper (20 more)






Reference graph
Works this paper leans on
-
[1]
Abel, N. P., Ferland, G. J., O’Dell, C. R., et al. 2006, ApJ, 644, 344
work page 2006
-
[2]
Troland, T. H. 2016, ApJ, 819, 136
work page 2016
- [3]
-
[4]
Baldwin, J. A., Ferland, G. J., Martin, P. G., et al.1991, ApJ, 374, 580
work page 1991
- [5]
-
[6]
Cartledge, S. I. B, Meyer, D. M., & Lauroesch, J. T. 2001, ApJ, 562, 394 Garc ´ ıa-D ´ ıaz, Ma. T., Henney, W. J. 2007, AJ, 133, 952 Garc ´ ıa-D ´ ıaz , Ma.-T., Henney, W. J., L´ opez, J. A., & Doi, T. 2008, RMxAA, 44, 181 G¨ udel, M., Briggs, K. R., Montmerle, T., et al. 2008, Science, 319, 309
work page 2001
-
[7]
Goicoechea, J. R., Pabst, C. H. M., Kabanovic, S., et al. 2020, A&A, 639, A1
work page 2020
-
[8]
Haworth, T. J., Reiter, M., O’Dell, C. R. et al. 2023 MNRAS, 525, 4129
work page 2023
Show all 19 references
-
[9]
J., O’Dell, C
Henney, W. J., O’Dell, C. R., Zapata, L. A., et al. 2007, AJ, 133, 2192
2007
-
[10]
Hillenbrand, L. A. , & Hartmann, L. W. 1998, ApJ, 492, 540 Kavak, ¨U., Bally, J., Goicoechea, J. R., et al. 2022, A&A, 663, A117 Kavak, ¨U., Goicoechea, J. R., Pabst, C. H. M., et al. 2022, A&A, 660, A109
1998
-
[11]
J., Wolfire, M
Kaufman, M. J., Wolfire, M. G., Hollenbach, D. J., et al. 1999, ApJ, 527, 795
1999
-
[12]
J., & Pearson, S
McCaughrean, M. J., & Pearson, S. G. 2023, arXiv:2310.03552v1 O’Dell, C. R. 2018, MNRAS, 478, 1017 O’Dell, C. R., Abel, N. P., & Ferland, G. J. 2020, ApJ, 891, 46 O’Dell, C. R., Abel, N. P. 2021, & Ferland, G. J ApJ, 907, 119 O’Dell, C. R., Abel, N. P. 2021, & Ferland, G. J Ap...
2023 arXiv
-
[13]
R., Teyssier, D
Pabst, C., Goicoechea, J. R., Teyssier, D. et al. 2020, A&A, 639, 2
2020
-
[14]
R., Hacar, A., et al
Pabst, C., Goicoechea, J. R., Hacar, A., et al. 2022, A&A, 658, A98
2022
-
[15]
R., Cuadrado, S., et al
Pabst, C., Goicoechea, J. R., Cuadrado, S., et al. 2024, A&A, 668, A7
2024
-
[16]
R., et al
Pabst, C., Higgins, R., Goicoechea, J. R., et al. 2019, Nature, 565, 618
2019
-
[17]
J., Lauroesch, J
Sofia, U. J., Lauroesch, J. T., Meyer, D. M., et al. 2004, ApJ, 605, 272
2004
-
[18]
H., Goss, W
Troland, T. H., Goss, W. M., Brogan, C. L. et al. 2016, ApJ, 825, 2 van der Werf, P. P., & Goss, W. M 1989, A&A, 224, 229 van der Werf, P. P., & Goss, W. M. 1990, A&A, 364, 157 van der Werf, P. P., Goss, W. M., & O’Dell, C. R. 2013, ApJ, 762, 101
2016
-
[19]
Wen, Z., & O’Dell, C. R. 1993, ApJ, 409, 262
1993
Reviewed August 6, 2026 · model on record in the stance chip above.
Discussion (0). Continue with ORCID to comment.