REVIEW 5 major objections 8 minor 36 references
Tracing the Interactions of Modular CMA-ES Configurations Across Problem Landscapes
T0 review · 5 major / 8 minor · reviewed 2026-08-06 · deepseek-v4-flash
Pith's one-line read Algorithm footprints trace why one modular CMA-ES configuration fails on ill-conditioned problems.
desk verdict A competent, honest case study applying the authors' footprint method to six modCMA configurations, but the missing surrogate accuracy leaves the SHAP-based conclusions unverified. read the letter →
The pith
A machine-rendered reading of the paper's core claim, the machinery that carries it, and where it could break.
The reading
What carries the argument
The central machinery is the algorithm configuration footprint: a multi-target regression model is trained to predict each configuration's fixed-budget performance from 46 Exploratory Landscape Analysis features, SHAP values from that surrogate become a meta-representation for each problem instance, hierarchical clustering groups these meta-representations into performance regions, and comparing cluster assignments across configurations reveals shared or divergent behavior. The SHAP meta-features do the explanatory work, turning landscape geometry into feature-importance profiles that can be read instance by instance.
What would settle it
Compute the held-out MAE and R² of the selected multi-target regression model on the 24 test instances; if R² is low or negative, the SHAP meta-features and the clusters built from them are artifacts of the surrogate rather than evidence about how the modCMA configurations interact with the landscape.
Extended reading notes
Core claim
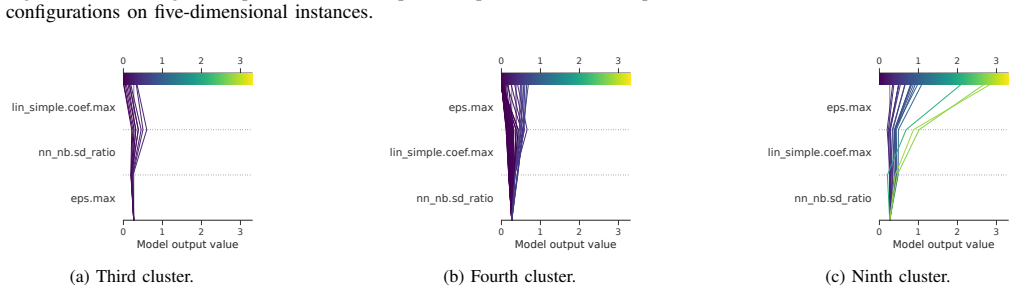
The central claim is that the footprint methodology, which represents each problem instance by SHAP values of a surrogate predicting CMA-ES performance from 46 landscape features, can expose why different configurations of the same algorithm succeed or fail. On the six modCMA configurations tested, the footprints show that the five high-performing variants share nearly identical interaction patterns, while the worst-performing variant falls into the poorest performance region on the separable ellipsoidal problem and its rotated, discuss, and bent-cigar relatives. For those ill-conditioned unimodal functions, the features eps.max (estimated highest slope) and lin_simple.coef.max (largest linear-model coefficient) dominate the explanation of the failure, consistent with the module options 'pairwise' mirroring and 'equal' weights used by that configuration. The paper thereby connects module-level contributions, previously studied only in performance space, to concrete landscape properties.
Load-bearing premise
The load-bearing premise is that the trained multi-target regression surrogate is accurate enough that its SHAP values faithfully represent the true landscape-performance relationship, yet no MAE or R² for the selected model is reported.
Editorial extensions
If this is right
- The failure of the worst modCMA configuration on problems 2, 10, 11, and 12 can be traced to its 'pairwise' and 'equal' module options interacting with high-condition-number landscapes, so configuration choices for such problems can be made with those features in mind.
- The same footprint pipeline can indicate which landscape features matter most for a given configuration, enabling performance-region prediction before running the optimizer.
- The approach replaces subjective performance thresholds with automatically discovered performance regions, making comparisons between configurations data-driven.
- Footprints computed under different evaluation budgets or fixed-target metrics would show how feature importance shifts during an optimization run, a direction the paper identifies.
- Linking footprint clusters to existing module-impact analyses gives a joint view of module parameter space and problem landscape.
Reading between the lines
- A direct test of the paper's story would be to report the selected surrogate's MAE and R² on the held-out instances; without that, the SHAP-based footprints are only as trustworthy as the model they interpret.
- The footprint lens suggests that algorithm portfolios could be pruned by clustering configurations according to footprint similarity, keeping only configurations that occupy distinct performance regions.
- If the surrogate accuracy holds, the features eps.max and lin_simple.coef.max could serve as cheap predictors of when pairwise or equal-weight modCMA settings will degrade on unseen ill-conditioned problems.
Editorial analysis
A structured set of objections, weighed in public.
Referee Report
Summary. The paper applies the recently proposed algorithm-footprints methodology to six modular CMA-ES configurations on 24 noiseless BBOB problems in 5 and 30 dimensions, using fixed-budget performance data from an earlier study and 46 ELA features. The workflow trains a multi-target regression surrogate, converts its SHAP values into meta-representations, clusters these meta-representations into performance regions, and compares the resulting footprints across configurations. The authors report shared behavioral patterns across most configurations and identify a distinct failure mode for the worst-performing configuration on ill-conditioned unimodal problems, illustrated in detail on the separable ellipsoidal function f2. The abstract concludes that the approach enhances interpretability and can guide configuration choices.
Significance. If the surrogate-based footprints are trustworthy, the paper extends module-impact analyses from the performance space to the landscape-feature space, which is a genuinely useful direction for explainable benchmarking. The paper has clear strengths: it uses a standardized modular framework, follows a well-defined footprint workflow, makes explicit limitations in Section 6, and the qualitative story for f2 is consistent with known properties of ill-conditioning. However, the main interpretability claim rests on the fidelity of a surrogate whose accuracy is never reported, and the clustering and validation choices are not shown to be stable. These are fixable within the paper's scope, but as submitted the central claim is under-supported.
major comments (5)
- [Section 4, Model evaluation] The manuscript states that MAE and R2 are used to assess the MTR model but never reports these values, nor the identity or hyperparameters of the selected model (MTEN, RF, or NN), in either the 5d or 30d experiments. Because the SHAP meta-features in Figures 1-6 and all footprint comparisons in Section 5 are computed from this surrogate, the central claim in the abstract is unverifiable as reported. Please report per-target and aggregated held-out test MAE/R2, the corresponding cross-validated values, and the selected feature subset, and explain what remains of the conclusions if the surrogate explains little variance.
- [Section 3 and Section 4, Meta-representation generation] The unit of analysis is unclear: the text says each problem instance paired with a specific algorithm has its own meta-representation, but Figure 1 appears to show one point per problem instance while Figure 2 assigns cluster labels per algorithm-instance pair. It is also not explained how SHAP values from the multi-target regressor are aggregated over the six targets to form the n-dimensional meta-feature vector. Without this clarification, the clustering and the 'shared vs. distinct behavior' comparisons cannot be reproduced or interpreted precisely.
- [Section 4, Clustering] Hierarchical clustering is tuned on the same instances used for interpretation by maximizing the Silhouette score over distance metrics, and Section 6 states that no alternative clustering methods were considered. The resulting cluster counts (9 in 5d, 12 in 30d) define the performance regions that organize the entire footprint analysis, yet no stability or sensitivity analysis is provided. Please report how robust the cluster boundaries and the conclusions in Figures 2-4 are to the distance metric, linkage, and number of clusters.
- [Section 5, f2 analysis and validation] The interpretation of the worst configuration's failure is validated almost exclusively by a prior fANOVA study [15] on the same 24 BBOB problems and the same modular framework, with detailed comparison only for f2. The 'best' and 'worst' configurations were also selected on this same suite, so the performance contrast is partly a selection effect. Please add out-of-sample validation or explicitly restrict the claim to a hypothesis-generating case study rather than a confirmed explanation of the algorithm-problem interaction.
- [Abstract and Section 7, Conclusion] The paper claims that the results 'demonstrate the effectiveness of algorithm footprints in enhancing interpretability and guiding configuration choices,' but no experiment that actually uses the footprints to guide a configuration choice is performed. The evidence supports visual and qualitative interpretation; the guidance claim should either be tempered or supported by a quantitative downstream task, such as selecting among the six configurations on held-out instances.
minor comments (8)
- [Section 1] 'Two-dimensional settings' should be 'two settings' (5-dimensional and 30-dimensional); the current phrasing is confusing.
- [Section 5, first paragraph] The text says 'most of the performance across the three algorithms falls within the fourth cluster,' but six configurations are analyzed; this appears to be a typo.
- [Figure 1 and Figure 5] The projection of the SHAP meta-features into the two-dimensional vector space is not described; please state the dimensionality-reduction method and its settings.
- [Figure 3] The caption does not state whether each subplot shows one instance or all five instances of problem f2, nor how the SHAP decision curves are aggregated across instances; please clarify.
- [Section 5, 30d results] The paper says 'Analysis on selected problems have been omitted due to the page limit,' but without such analysis the 30d claims are only supported by the footprint plots; please include at least one detailed example or a supplementary analysis.
- [Section 5] The statement that 'all configurations exhibit nearly identical footprint patterns, with the exception of the poorest-performing variant' is not quantified; report the cosine similarities or an analogous measure to support it.
- [Section 6] The claim that the approach 'avoids subjective a priori thresholds' overstates the case, since the cluster count and distance metric are chosen by the analyst; please phrase this more carefully.
- [Section 4, MTR models] No code or data availability statement is provided; given the number of undocumented choices (feature selection criterion, selected model, hyperparameters), a reproducibility artifact would strengthen the paper.
Circularity Check
No significant circularity: the footprint analysis is an application of a published method to new data, with self-citations used as methodological precedent rather than as load-bearing proof.
full rationale
The paper's derivation chain is explicit: performance data from [24] and ELA features from [24,25] feed a multi-target regression surrogate; SHAP values of that surrogate become meta-representations; clustering of those meta-representations defines footprints; the footprints are then compared across six modCMA configurations. Each step is a method application, not a hidden reuse of the conclusion. The central claims about shared and distinct behavior are summaries of cluster assignments and SHAP profiles, which are the direct outputs of the stated pipeline; this is the method's designed behavior, not circularity. The worst-configuration explanation for f2 is supported by known properties of the separable ellipsoidal function (ill-conditioning) and by an independent albeit same-group fANOVA study [15]; the paper also displays ground-truth performance in Figures 1-6, so the interpretation is not solely a restatement of the surrogate's outputs. The absence of reported MAE and R-squared values for the selected MTR model is a real limitation: it weakens confidence that the SHAP meta-features faithfully represent true algorithm-landscape relationships. But a missing fidelity check is a correctness/evidence concern, not a circular reduction. No equation in the paper defines a predicted quantity in terms of the quantity it claims to explain, and no fitted parameter is renamed as a prediction. Self-citations to the footprint methodology [19,20,22] and to prior modCMA studies [15,24] are ordinary citations to methods and data; they do not carry the argument by themselves. Therefore no specific circular step can be exhibited, and the correct score is 0.
Assumptions & free parameters
free parameters (4)
- MTR hyperparameters =
not disclosed
- Forward feature selection criterion =
not disclosed
- Clustering hyperparameters =
Euclidean vs cosine chosen by Silhouette; 9 clusters (5D) and 12 clusters (30D)
- SHAP aggregation across MTR targets =
not disclosed
assumptions (4)
- domain assumption ELA features computed with Sobol sampling at 100d sample size, median of 100 repetitions, are sufficient to characterize problem instances for predicting algorithm performance.
- ad hoc to paper SHAP values of the fitted surrogate faithfully represent the true relationship between landscape features and algorithm performance.
- domain assumption The 24 BBOB problems and six selected modCMA configurations form a representative portfolio for drawing conclusions about configuration behavior.
- ad hoc to paper Hierarchical clustering of SHAP meta-features produces meaningful performance regions without deliberate selection of the number of clusters.
Cite this review
Pith. "Pith review of Tracing the Interactions of Modular CMA-ES Configurations Across Problem Landscapes." pith.science (2026). https://pith.science/paper/ZJLPPG4D
@misc{pith2026250702331,
  author       = {Pith},
  title        = {Pith review of: Tracing the Interactions of Modular CMA-ES Configurations Across Problem Landscapes},
  year         = {2026},
  howpublished = {\url{https://pith.science/paper/ZJLPPG4D}},
  note         = {Machine review of arXiv:2507.02331}
}
read the original abstract
This paper leverages the recently introduced concept of algorithm footprints to investigate the interplay between algorithm configurations and problem characteristics. Performance footprints are calculated for six modular variants of the CMA-ES algorithm (modCMA), evaluated on 24 benchmark problems from the BBOB suite, across two-dimensional settings: 5-dimensional and 30-dimensional. These footprints provide insights into why different configurations of the same algorithm exhibit varying performance and identify the problem features influencing these outcomes. Our analysis uncovers shared behavioral patterns across configurations due to common interactions with problem properties, as well as distinct behaviors on the same problem driven by differing problem features. The results demonstrate the effectiveness of algorithm footprints in enhancing interpretability and guiding configuration choices.
Figures


Figures from the paper (3 more)


Reference graph
Works this paper leans on
-
[15]
Quantifying individual and joint module impact in modular optimization frameworks,
A. Nikolikj, A. Kostovska, D. Vermetten, C. Doerr, and T. Efti- mov, “Quantifying individual and joint module impact in modular optimization frameworks,” in 2024 IEEE Congress on Evolutionary Computation (CEC). IEEE, 2024, pp. 1–8
work page 2024
-
[1]
Black-box optimization: Meth- ods and applications,
I. Bajaj, A. Arora, and M. F. Hasan, “Black-box optimization: Meth- ods and applications,” in Black box optimization, machine learning, and no-free lunch theorems . Springer, 2021, pp. 35–65
work page 2021
-
[2]
D. Molina, A. LaTorre, and F. Herrera, “An insight into bio-inspired and evolutionary algorithms for global optimization: review, analysis, and lessons learnt over a decade of competitions,” Cognitive Compu- tation, vol. 10, pp. 517–544, 2018
work page 2018
-
[3]
A comparative study of large-scale variants of cma-es,
K. Varelas, A. Auger, D. Brockhoff, N. Hansen, O. A. ElHara, Y . Semet, R. Kassab, and F. Barbaresco, “A comparative study of large-scale variants of cma-es,” in Parallel Problem Solving from Nature–PPSN XV: 15th International Conference, Coimbra, Portugal, September 8–12, 2018, Proceedings, Part I 15 . Springer, 2018, pp. 3–15
work page 2018
-
[4]
Dif- ferential evolution: A review of more than two decades of research,
M. Pant, H. Zaheer, L. Garcia-Hernandez, A. Abraham et al., “Dif- ferential evolution: A review of more than two decades of research,” Engineering Applications of Artificial Intelligence, vol. 90, p. 103479, 2020
work page 2020
-
[5]
J. Kennedy and R. Eberhart, “Particle swarm optimization,” in Pro- ceedings of ICNN’95-international conference on neural networks , vol. 4. ieee, 1995, pp. 1942–1948
work page 1995
-
[6]
The irace package: Iterated racing for automatic algorithm configuration,
M. L ´opez-Ib´a˜nez, J. Dubois-Lacoste, L. P. C ´aceres, M. Birattari, and T. St¨utzle, “The irace package: Iterated racing for automatic algorithm configuration,” Operations Research Perspectives, vol. 3, pp. 43–58, 2016
work page 2016
-
[7]
The sequential parameter optimization toolbox,
T. Bartz-Beielstein, C. Lasarczyk, and M. Preuss, “The sequential parameter optimization toolbox,” in Experimental methods for the analysis of optimization algorithms . Springer, 2010, pp. 337–362
work page 2010
Show all 36 references
-
[8]
Recent advances in selection hyper-heuristics,
J. H. Drake, A. Kheiri, E. ¨Ozcan, and E. K. Burke, “Recent advances in selection hyper-heuristics,” European Journal of Operational Re- search, vol. 285, no. 2, pp. 405–428, 2020
2020
-
[9]
Tuning as a means of assessing the benefits of new ideas in interplay with existing algorithmic modules,
J. de Nobel, D. Vermetten, H. Wang, C. Doerr, and T. B ¨ack, “Tuning as a means of assessing the benefits of new ideas in interplay with existing algorithmic modules,” in Proceedings of the Genetic and Evolutionary Computation Conference Companion , 2021, pp. 1375– 1384
2021
-
[10]
Towards an adaptive cma- es configurator,
S. Van Rijn, C. Doerr, and T. B ¨ack, “Towards an adaptive cma- es configurator,” in International Conference on Parallel Problem Solving from Nature. Springer, 2018, pp. 54–65
2018
-
[11]
Modular differential evolution,
D. Vermetten, F. Caraffini, A. V . Kononova, and T. B ¨ack, “Modular differential evolution,” in Proceedings of the Genetic and Evolution- ary Computation Conference , 2023, pp. 864–872
2023
-
[12]
Pso-x: A component-based framework for the automatic design of particle swarm optimization algorithms,
C. L. Camacho-Villal ´on, M. Dorigo, and T. St ¨utzle, “Pso-x: A component-based framework for the automatic design of particle swarm optimization algorithms,” IEEE Transactions on Evolutionary Computation, vol. 26, no. 3, pp. 402–416, 2021
2021
-
[13]
An efficient approach for assessing hyperparameter importance,
F. Hutter, H. Hoos, and K. Leyton-Brown, “An efficient approach for assessing hyperparameter importance,” in International conference on machine learning. PMLR, 2014, pp. 754–762
2014
-
[14]
The many shapley values for model explanation,
M. Sundararajan and A. Najmi, “The many shapley values for model explanation,” in International conference on machine learning. PMLR, 2020, pp. 9269–9278
2020
-
[16]
Ex- plainable benchmarking for iterative optimization heuristics,
N. van Stein, D. Vermetten, A. V . Kononova, and T. B ¨ack, “Ex- plainable benchmarking for iterative optimization heuristics,” arXiv preprint arXiv:2401.17842, 2024
2024 arXiv
-
[17]
Algorithm con- figuration data mining for CMA evolution strategies,
S. van Rijn, H. Wang, B. van Stein, and T. B ¨ack, “Algorithm con- figuration data mining for CMA evolution strategies,” in Proceedings of the Genetic and Evolutionary Computation Conference , 2017, pp. 737–744
2017
-
[18]
Extending instance space analysis to algorithm configuration spaces,
A. Rasulo, K. Smith-Miles, M. Mu ˜noz, J. Handl, and M. L ´opez- Ib´a˜nez, “Extending instance space analysis to algorithm configuration spaces,” in Proceedings of the Genetic and Evolutionary Computation Conference Companion, 2024, pp. 147–150
2024
-
[19]
Algorithm instance footprint: Separating easily solvable and challenging problem instances,
A. Nikolikj, S. D ˇzeroski, M. A. Mu ˜noz, C. Doerr, P. Koro ˇsec, and T. Eftimov, “Algorithm instance footprint: Separating easily solvable and challenging problem instances,” in Proceedings of the Genetic and Evolutionary Computation Conference , 2023, pp. 529–537
2023
-
[20]
Comparing solvability patterns of algorithms across diverse problem landscapes,
A. Nikolikj and T. Eftimov, “Comparing solvability patterns of algorithms across diverse problem landscapes,” in Proceedings of the Genetic and Evolutionary Computation Conference Companion , 2024, pp. 143–146
2024
-
[21]
Coco: A platform for comparing continuous optimizers in a black-box setting,
N. Hansen, A. Auger, R. Ros, O. Mersmann, T. Tu ˇsar, and D. Brock- hoff, “Coco: A platform for comparing continuous optimizers in a black-box setting,” Optimization Methods and Software, vol. 36, no. 1, pp. 114–144, 2021
2021
-
[22]
Benchmarking foot- prints of continuous black-box optimization algorithms: Explainable insights into algorithm success and failure,
A. Nikolikj, M. A. Mu ˜noz, and T. Eftimov, “Benchmarking foot- prints of continuous black-box optimization algorithms: Explainable insights into algorithm success and failure,” Swarm and Evolutionary Computation, vol. 94, p. 101895, 2025
2025
-
[23]
Towards better evaluation of multi- target regression models,
E. Korneva and H. Blockeel, “Towards better evaluation of multi- target regression models,” in Joint European conference on machine learning and knowledge discovery in databases . Springer, 2020, pp. 353–362
2020
-
[24]
Using machine learning methods to assess mod- ule performance contribution in modular optimization frameworks,
A. Kostovska, D. Vermetten, P. Koro ˇsec, S. D ˇzeroski, C. Doerr, and T. Eftimov, “Using machine learning methods to assess mod- ule performance contribution in modular optimization frameworks,” Evolutionary computation, pp. 1–28, 2024
2024
-
[25]
Exploratory landscape analysis is strongly sensitive to the sampling strategy,
Q. Renau, C. Doerr, J. Dr ´eo, and B. Doerr, “Exploratory landscape analysis is strongly sensitive to the sampling strategy,” in Proc. of Parallel Problem Solving from Nature (PPSN) , ser. LNCS, vol. 12270. Springer, 2020, pp. 139–153. [Online]. Available: https://doi.org/10.1...
2020 doi
-
[26]
Regularization and variable selection via the elastic net,
H. Zou and T. Hastie, “Regularization and variable selection via the elastic net,” Journal of the Royal Statistical Society Series B: Statistical Methodology, vol. 67, no. 2, pp. 301–320, 2005
2005
-
[27]
A random forest guided tour,
G. Biau and E. Scornet, “A random forest guided tour,” Test, vol. 25, 2016
2016
-
[28]
Understanding the difficulty of train- ing deep feedforward neural networks,
X. Glorot and Y . Bengio, “Understanding the difficulty of train- ing deep feedforward neural networks,” in Proceedings of the thir- teenth international conference on artificial intelligence and statistics. JMLR Workshop and Conference Proceedings, 2010, pp. 249–256
2010
-
[29]
Scikit-learn: Machine learning in python,
F. Pedregosa, G. Varoquaux, A. Gramfort, V . Michel, B. Thirion, O. Grisel, M. Blondel, P. Prettenhofer, R. Weiss, V . Dubourg et al., “Scikit-learn: Machine learning in python,” the Journal of machine Learning research, vol. 12, pp. 2825–2830, 2011
2011
-
[30]
Chollet et al
F. Chollet et al. (2015) Keras. [Online]. Available: https://github.com/fchollet/keras
2015
-
[31]
Optuna: A next-generation hyperparameter optimization framework,
T. Akiba, S. Sano, T. Yanase, T. Ohta, and M. Koyama, “Optuna: A next-generation hyperparameter optimization framework,” in Pro- ceedings of the 25th ACM SIGKDD international conference on knowledge discovery & data mining , 2019, pp. 2623–2631
2019
-
[32]
A unified approach to interpreting model predictions,
S. M. Lundberg and S.-I. Lee, “A unified approach to interpreting model predictions,” in Advances in Neural Information Processing Systems 30 , I. Guyon, U. V . Luxburg, S. Bengio, H. Wallach, R. Fergus, S. Vishwanathan, and R. Garnett, Eds. Curran Associates, Inc., 2017, pp. 4765–
2017
-
[33]
Modern hierarchical, agglomerative clustering algorithms,
D. M ¨ullner, “Modern hierarchical, agglomerative clustering algorithms,” ArXiv, vol. abs/1109.2378, 2011. [Online]. Available: https://api.semanticscholar.org/CorpusID:8490224
2011 arXiv
-
[34]
Ma-bbob: A problem generator for black-box optimization using affine combinations and shifts,
D. Vermetten, F. Ye, T. B ¨ack, and C. Doerr, “Ma-bbob: A problem generator for black-box optimization using affine combinations and shifts,” ACM Transactions on Evolutionary Learning , vol. 5, no. 1, pp. 1–19, 2025
2025
-
[35]
Ps-aas: Portfolio selection for automated algorithm selection in black-box optimiza- tion,
A. Kostovska, G. Cenikj, D. Vermetten, A. Jankovic, A. Nikolikj, U. Skvorc, P. Korosec, C. Doerr, and T. Eftimov, “Ps-aas: Portfolio selection for automated algorithm selection in black-box optimiza- tion,” in International Conference on Automated Machine Learning . PMLR, 2023...
2023
-
[4774]
Available: http://papers.nips.cc/paper/7062-a-unified- approach-to-interpreting-model-predictions.pdf
[Online]. Available: http://papers.nips.cc/paper/7062-a-unified- approach-to-interpreting-model-predictions.pdf
Reviewed August 6, 2026 · model on record in the stance chip above.
Discussion (0). Sign in to comment.