REVIEW 5 major objections 5 minor 32 references
Modeling Gene Expression Distributional Shifts for Unseen Genetic Perturbations
T0 review · 5 major / 5 minor · reviewed 2026-08-06 · deepseek-v4-flash
Pith's one-line read A neural network predicts full gene-expression distribution shifts for perturbations never seen in training.
desk verdict Solid distributional-perturbation model with a genuinely new histogram/W1/LLM-embedding combination, but the paper never isolates the embedding contribution, so the 'unseen perturbation' claim is under-supported. read the letter →
The pith
A machine-rendered reading of the paper's core claim, the machinery that carries it, and where it could break.
The reading
What carries the argument
The load-bearing machinery is a conditional histogram head combined with language-model gene embeddings. Each gene's expression range is split into a fixed number of equal-width bins (15 by default), and the perturbation is encoded by concatenating frozen text embeddings of gene descriptions with protein-sequence embeddings. An MLP maps this embedding to per-gene log-space bin shifts applied on top of the control histogram, so the model is trained to predict a perturbation-specific reshuffling of probability mass rather than an absolute count. The Wasserstein-1 loss, computed in closed form from the cumulative distribution gaps at bin edges, is what lets the model learn higher-order shape: it transports probability mass across the expression axis instead of treating bins as independent categories, and the mean-squared-error term anchors the first moment. This combination carries the claim that distributional shape can be learned cheaply and transferred to unseen perturbations.
What would settle it
Train the same model twice: once with the true language-model embeddings for held-out perturbed genes and once with those embeddings randomly permuted or replaced by random vectors. If the randomized-embedding version matches the true-embedding version on the held-out relative mean absolute error (RMAE) for variance, skewness, and kurtosis, then the paper's claimed generalization to unseen perturbations is not coming from the biological prior and the central claim is undermined.
Extended reading notes
Core claim
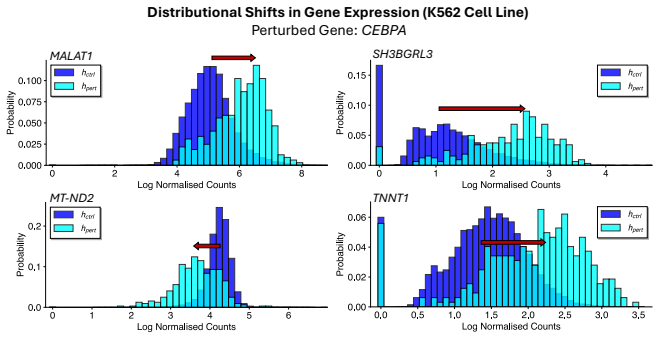
The paper's central claim is that predicting gene-level histograms—rather than means or parametric densities—is enough to capture how gene expression distributions respond to unseen genetic perturbations. Given a perturbation, the model takes the empirically observed control histogram for each gene, adds a perturbation-dependent shift in log space produced by an MLP from the perturbed gene's embedding, and normalizes with a softmax. The training objective combines Wasserstein-1 distance, which respects the ordering of expression bins, with mean-squared error on the predicted means. On the two large K562 and RPE1 Perturb-seq datasets, this histogram model achieves the lowest relative mean absolute error on mean, variance, skewness, and excess kurtosis among the distributional baselines tested, with the advantage over a zero-inflated truncated Gaussian growing from 1.8% in the mean to 10.2% in kurtosis on K562; it also trains roughly 2.5 to 3.3 times faster. The paper further reports that the model reproduces concrete non-mean effects, such as variance inflation in a tubulin gene and a proportion shift in a bimodal histone gene, while matching dedicated mean-only models on mean-shift accuracy.
Load-bearing premise
The whole method rests on the assumption that the text-and-protein-sequence description of a gene encodes enough of its biology that the network can predict how perturbing that gene reshapes other genes' expression distributions, even when the perturbed gene was never seen in training.
Editorial extensions
If this is right
- Perturbation screens could rank hits by predicted variance, skewness, or modality changes, catching effects that cancel out in the mean.
- Distributional outputs can serve as uncertainty or heterogeneity estimates for each gene under a perturbation, without any extra sampling.
- Because the model trains on fixed-size histogram summaries rather than all single cells, distributional prediction scales to larger Perturb-seq datasets at lower compute and memory cost.
- The method's mean-shift accuracy matches dedicated mean-only models, so switching to histogram outputs does not sacrifice the standard mean-based evaluation.
- Predictions are bounded by the expression range seen in training, so extrapolation to extreme shifts requires a different output representation.
Reading between the lines
- Not in the paper: a sharper test of the biological prior would be to hold out entire gene families or pathways instead of random perturbations; if embedding similarity is what drives generalization, performance should degrade more when a whole functional group is withheld.
- Not in the paper: because only marginal histograms are modeled, the approach cannot say whether two genes shift together; a natural extension is to pair the histogram head with a lightweight copula or sampled-cell decoder to assess how much joint structure matters for downstream decisions.
- Not in the paper: the 15–20 bin plateau suggests most shape information is captured by a coarse discretization, which could motivate moment- or quantile-based output representations that are continuous and avoid the training-range truncation the paper lists as a limitation.
- Not in the paper: in a screening workflow, predicted skewness or multimodality could be used to select perturbations likely to produce heterogeneous cellular states, then confirmed experimentally; this would be a direct practical validation of the method's added value.
Editorial analysis
A structured set of objections, weighed in public.
Referee Report
Summary. The paper proposes MLP+Hist, a neural network that predicts per-gene marginal expression histograms for unseen genetic perturbations. Perturbations are encoded by concatenating frozen GPT-3.5 gene-description embeddings and ProtT5 protein-sequence embeddings; the output is a shift in log-space over an empirically observed control histogram, trained with a Wasserstein-1 plus MSE loss. Experiments on two Replogle cell lines (K562, RPE1) and the Norman dataset report RMAEs of mean, variance, skewness, and kurtosis, with MLP+Hist claimed to outperform TG and ZITG baselines on higher-order statistics while being faster and lighter. The paper also shows competitive mean prediction compared to MLP+Mean and GEARS.
Significance. If the claims hold, the work is a practical step toward distributional perturbation prediction, an important gap relative to mean-only methods. The histogram output with a geometry-aware Wasserstein loss is a simple and sensible design, and the use of frozen LLM embeddings for unseen perturbations is a promising route to generalization. Strengths include a clear method specification, closed-form W1 computation, public code, and explicit reporting of training time and memory. However, the central quantitative evidence currently lacks uncertainty quantification, omits results for one of the three datasets, and does not isolate the contribution of the LLM embeddings, so the significance is conditional on addressing these issues.
major comments (5)
- [Section 4.3, Table 1] The central claim that MLP+Hist outperforms baselines on variance, skewness, and kurtosis is based on single numbers without error bars or significance tests, unlike Table 2 which reports standard deviations across folds. Given the modest gains (e.g., K562 kurtosis RMAE 0.539 vs 0.600; variance 0.175 vs 0.182), the reader cannot assess whether these differences are within fold-to-fold variability. Please report mean ± std across the 9 folds and, ideally, paired significance tests between MLP+Hist and ZITG.
- [Section 4.1 and Appendix C] The loss weights λ_wass=0.75 and λ_mse=0.25 were selected by a grid search on Replogle K562, which is also one of the evaluation datasets, and no held-out inner split is described. This introduces a risk of selection bias that is not accounted for in the reported K562 results. Please describe an inner validation procedure (e.g., a separate fold or a nested split) or otherwise demonstrate that the chosen hyperparameters generalize without using the test perturbations.
- [Section 3.3 and Section 4.2] The paper's stated mechanism for generalizing to unseen perturbations is the frozen LLM-derived gene embeddings, but this is never isolated by an ablation. All learnable baselines (TG, ZITG, MLP+Mean) use the same LLM embeddings, and the non-perturbation-aware baselines (Ctrl Hist, Non-Ctrl Hist) do not test the embedding contribution. Without a control where the perturbation embedding is replaced by random vectors or a non-LLM encoding (e.g., one-hot), the observed improvements could come from trivial interpolation over the embedding geometry rather than from biological priors. Please add such an ablation and report whether the RMAE gains persist.
- [Section 4.3 and Figure 2] Quantitative distributional results for the Norman dataset are missing. The abstract and Section 1 claim that the method outperforms baselines on three benchmark datasets, but Table 1 reports only the two Replogle cell lines; Norman appears only in Figure 2 (resolution analysis) and in qualitative examples. Please include a table (or appendix) with the distributional baselines and MLP+Hist on the Norman dataset so the three-dataset claim is verifiable.
- [Section 4.3, NLL discussion] The model's NLL is worse than Non-Ctrl Hist on both cell lines (e.g., -0.388 vs -0.393 on K562), which the paper attributes to zero-inflation mass in the pooled histogram. Since NLL is a standard distributional metric, the paper should more thoroughly justify why RMAE of moments is the primary evaluation criterion, and ideally demonstrate that the NLL gap is not hiding a practical deficiency. At minimum, the discussion should quantify the trade-off between NLL and the shape-aware metrics rather than only acknowledging the pooled histogram's advantage.
minor comments (5)
- [Figure 3 caption] There is an extra closing parenthesis in the definition of the y-coordinate: "y = W1(ˆhg, hctrl g ))" should be "y = W1(ˆhg, hctrl g)".
- [Section 4.3] The phrase "significantly higher data efficiency" seems to conflate data efficiency with computational efficiency; the reported gains are in training time and memory, not sample complexity. Please rephrase to avoid ambiguity.
- [Table 3] For clarity, consider adding a column or footnote explaining that "Learnable Params" is N/A for the non-parametric baselines rather than leaving the entries as N/A without comment.
- [References] The reference list includes both Märtens et al. (2024) and Märtens et al. (2025); the in-text citations are consistent, but please verify that the workshop proceedings or arXiv IDs are correctly assigned to each year.
- [Appendix A] In the histogram moment formula, the notation uses b for bin index and w_b for width, which is consistent with the main text, but please ensure that the per-gene subscript is not dropped when these formulas are used in evaluation, since bin widths are gene-specific.
Circularity Check
No significant circularity: the distributional predictions come from a model trained on held-out perturbation folds, and the cited LLM embeddings are external inputs rather than re-labeled fitted outputs.
full rationale
The derivation is self-contained. The model maps frozen external LLM gene embeddings through an MLP to log-space histogram shifts relative to the empirically observed control histogram (Eq. 2), with parameters trained by the W1+MSE objective (Eqs. 5-8). Generalization to unseen perturbations is evaluated by 9-fold cross-validation in which entire perturbations are held out, so the target histograms and test statistics for held-out folds do not enter the training objective. The reported NLL and RMAE metrics for mean, variance, skewness, and kurtosis are computed from the predicted distributions rather than from fitted parameters that are then relabeled as predictions. The only self-citations (Märtens et al. 2024 for LLM embedding concatenation and Märtens et al. 2025 as a mean-based prior baseline) are not load-bearing: the embeddings themselves come from externally published models (GenePT/Chen & Zou and ProtT5/Elnaggar et al.), and the paper's out-of-distribution comparisons include non-LLM baselines such as Ctrl Hist and Non-Ctrl Hist, as well as LLM-based learnable baselines. The Appendix C hyperparameter sweep on K562 is a possible model-selection leakage concern, but that is an evaluation-protocol issue rather than a circular-derivation issue. I find no step in which a claimed prediction reduces to its input by construction.
Assumptions & free parameters
free parameters (4)
- Number of histogram bins B =
15
- Wasserstein loss weight lambda_wass =
0.75
- MSE loss weight lambda_mse =
0.25
- MLP hidden dimensions =
(1024,512,1024) for Replogle; (128,64) for Norman
assumptions (4)
- domain assumption LLM-derived gene embeddings (GPT-3.5 text descriptions and ProtT5 protein sequences) capture functional relationships sufficient to predict distributional responses for unseen perturbations.
- domain assumption Gene expression distributions can be adequately represented by fixed-width histograms with support derived from training data.
- domain assumption Per-gene marginal distributions are a sufficient target; gene-gene correlations are ignored.
- ad hoc to paper The W1 distance plus MSE is an appropriate training objective for capturing distributional shape.
Cite this review
Pith. "Pith review of Modeling Gene Expression Distributional Shifts for Unseen Genetic Perturbations." pith.science (2026). https://pith.science/paper/ZWGQLK7W
@misc{pith2026250702980,
  author       = {Pith},
  title        = {Pith review of: Modeling Gene Expression Distributional Shifts for Unseen Genetic Perturbations},
  year         = {2026},
  howpublished = {\url{https://pith.science/paper/ZWGQLK7W}},
  note         = {Machine review of arXiv:2507.02980}
}
read the original abstract
We train a neural network to predict distributional responses in gene expression following genetic perturbations. This is an essential task in early-stage drug discovery, where such responses can offer insights into gene function and inform target identification. Existing methods only predict changes in the mean expression, overlooking stochasticity inherent in single-cell data. In contrast, we offer a more realistic view of cellular responses by modeling expression distributions. Our model predicts gene-level histograms conditioned on perturbations and outperforms baselines in capturing higher-order statistics, such as variance, skewness, and kurtosis, at a fraction of the training cost. To generalize to unseen perturbations, we incorporate prior knowledge via gene embeddings from large language models (LLMs). While modeling a richer output space, the method remains competitive in predicting mean expression changes. This work offers a practical step towards more expressive and biologically informative models of perturbation effects.
Figures


Figures from the paper (1 more)

Reference graph
Works this paper leans on
-
[1]
C. Ahlmann-Eltze, W. Huber, and S. Anders. Deep learning-based predictions of gene perturbations effects do not yet outperform simple linear baselines . bioRxiv, 2024.09.16.613342, 2024
work page 2024
-
[2]
J. L. Ba, J. R. Kiros, and G. E. Hinton. Layer Normalization . arXiv preprint arXiv:1607.06450, 2016
arXiv 2016
-
[3]
M. Bereket and T. Karaletsos. Modelling cellular perturbations with the sparse additive mechanism shift variational autoencoder. NeurIPS, 2023
work page 2023
- [4]
-
[5]
Y. Chen and J. Zou. GenePT: A simple but effective foundation model for genes and cells built from ChatGPT . bioRxiv, 2023.10.16.562533 , 2024
work page 2023
-
[6]
H. Cui, C. Wang, H. Maan, K. Pang, F. Luo, N. Duan, and B. Wang. scGPT: toward building a foundation model for single-cell multi-omics using generative AI . Nature Methods, 21: 0 1470--1480, 2024
work page 2024
-
[7]
L. de Torrent\' e , S. Zimmerman, M. Suzuki, M. Christopeit, J. M. Greally, and J. C. Mar. The shape of gene expression distributions matter: how incorporating distribution shape improves the interpretation of cancer transcriptomic data. BMC Bioinformatics, 21: 0 562, 2020
work page 2020
-
[8]
A. Dixit, O. Parnas, B. Li, J. Chen, C. P. Fulco, L. Jerby-Arnon, N. D. Marjanovic, D. Dionne, T. Burks, R. Raychowdhury, B. Adamson, T. M. Norman, E. S. Lander, J. S. Weissman, N. Friedman, and A. Regev. Perturb-Seq: Dissecting Molecular Circuits with Scalable Single-Cell RNA Profiling of Pooled Genetic Screens . Cell, 167: 0 1853--1866, 2016
work page 2016
Show all 32 references
-
[9]
Eisen, D
T. Eisen, D. J. Easty, D. C. Bennett, and C. R. Goding. The POU domain transcription factor Brn-2: elevated expression in malignant melanoma and regulation of melanocyte-specific gene expression . Oncogene, 11 0 (10): 0 2157--2164, 1995
1995
-
[10]
Elnaggar, M
A. Elnaggar, M. Heinzinger, C. Dallago, G. Rehawi, Y. Wang, L. Jones, T. Gibbs, T. Feher, C. Angerer, M. Steinegger, D. Bhowmik, and B. Rost. ProtTrans: Toward Understanding the Language of Life Through Self-Supervised Learning . IEEE Transactions on Pattern Analysis and Machi...
2022
-
[11]
M. Hao, J. Gong, X. Zeng, C. Liu, Y. Guo, X. Cheng, T. Wang, J. Ma, X. Zhang, and L. Song. Large-scale foundation model on single-cell transcriptomics . Nature Methods, 2024
2024
-
[12]
K. He, X. Zhang, S. Ren, and J. Sun. Delving deep into rectifiers: Surpassing human-level performance on imagenet classification. In Proceedings of the IEEE international conference on computer vision, pages 1026--1034, 2015
2015
-
[13]
Imani, K
E. Imani, K. Luedemann, S. Scholnick-Hughes, E. Elelimy, and M. White. Investigating the Histogram Loss in Regression . arXiv, 2402.13425, 2024
2024 arXiv
-
[14]
D. P. Kingma, M. Welling, et al. Auto-Encoding Variational Bayes , 2013
2013
-
[15]
Lopez, J
R. Lopez, J. Regier, M. B. Cole, M. I. Jordan, and N. Yosef. Deep generative modeling for single-cell transcriptomics . Nature Methods, 15: 0 1053--1058, 2018
2018
-
[16]
Lopez, N
R. Lopez, N. Tagasovska, S. Ra, K. Cho, J. Pritchard, and A. Regev. Learning Causal Representations of Single Cells via Sparse Mechanism Shift Modeling . In Proceedings of the Second Conference on Causal Learning and Reasoning, volume 213 of Proceedings of Machine Learning Res...
2023
-
[17]
Loshchilov and F
I. Loshchilov and F. Hutter. Decoupled Weight Decay Regularization . arXiv preprint arXiv:1711.05101, 2017
2017 arXiv
-
[18]
Lotfollahi, F
M. Lotfollahi, F. A. Wolf, and F. J. Theis. scGen predicts single-cell perturbation responses . Nature Methods, 16: 0 715--721, 2019
2019
-
[19]
Lotfollahi, A
M. Lotfollahi, A. K. Susmelj, and C. D. D. et al. Predicting cellular responses to complex perturbations in high-throughput screens . Molecular Systems Biology, 19: 0 e11517, 2023
2023
-
[20]
M \"a rtens, R
K. M \"a rtens, R. Donovan-Maiye, and J. Ferkinghoff-Borg. Enhancing generative perturbation models with LLM-informed gene embeddings . In ICLR 2024 Workshop on Machine Learning for Genomics Explorations, 2024
2024
-
[21]
M \"a rtens, M
K. M \"a rtens, M. B. Martell, C. A. Prada-Medina, and R. Donovan-Maiye. LangPert: LLM-Driven Contextual Synthesis for Unseen Perturbation Prediction . In ICLR 2025 Workshop on Machine Learning for Genomics Explorations, 2025
2025
-
[22]
T. M. Norman, M. A. Horlbeck, J. M. Replogle, A. Y. Ge, A. Xu, M. Jost, L. A. Gilbert, and J. S. Weissman. Exploring genetic interaction manifolds constructed from rich single-cell phenotypes . Science, 365: 0 786--793, 2019
2019
-
[23]
Paulsson
J. Paulsson. Models of stochastic gene expression. Physics of Life Reviews, 2: 0 157--175, 2005
2005
-
[24]
Raj and A
A. Raj and A. van Oudenaarden. Nature, Nurture, or Chance: Stochastic Gene Expression and its Consequences . Cell, 135: 0 216--226, 2008
2008
-
[25]
J. M. Replogle, R. A. Saunders, and A. N. P. et al. Mapping information-rich genotype-phenotype landscapes with genome-scale perturb-seq. Cell, 185: 0 2559--2575, 2022
2022
-
[26]
Rives, J
A. Rives, J. Meier, T. Sercu, and R. Fergus. Biological structure and function emerge from scaling unsupervised learning to 250 million protein sequences . Proc. Natl. Acad. Sci. U.S.A., 118: 0 e2016239118, 2021
2021
-
[27]
Roohani, K
Y. Roohani, K. Huang, and J. Leskovec. Predicting transcriptional outcomes of novel multigene perturbations with GEARS . Nature Biotechnology, 42: 0 927--935, 2024
2024
-
[28]
R. L. Seal, P. Denny, E. A. Bruford, A. K. Gribkova, D. Landsman, W. F. Marzluff, M. McAndrews, A. R. Panchenko, A. K. Shaytan, and P. B. Talbert. A standardized nomenclature for mammalian histone genes. Epigenetics & Chromatin, 15: 0 34, 2022
2022
-
[29]
C. Sun, G. Wang, K. H. Wrighton, H. Lin, Z. Songyang, X.-H. Feng, and X. Lin. Regulation of p27Kip1 phosphorylation and G1 cell cycle progression by protein phosphatase PPM1G . American Journal of Cancer Research, 6 0 (10): 0 2207--2220, 2016
2016
-
[30]
C. V. Theodoris, L. Xiao, A. Chopra, M. D. Chaffin, Z. R. A. Sayed, M. C. Hill, H. Mantineo, E. M. Brydon, Z. Zeng, X. S. Liu, and P. T. Ellinor. Transfer learning enables predictions in network biology . Nature, 618: 0 616--624, 2023
2023
-
[31]
Y. Wang, Y. Li, Y. Jing, Y. Yang, H. Wang, D. Ismtula, and C. Guo. TUBA1B promotes proliferation and migration in hepatocellular carcinoma . Scientific Reports, 14: 0 8201, 2024
2024
-
[32]
Y. Wu, E. Wershof, S. M. Schmon, M. Nassar, B. Osi \'n ski, R. Eksi, K. Zhang, and T. Graepel. PerturBench: Benchmarking Machine Learning Models for Cellular Perturbation Analysis . In NeurIPS 2024 Workshop on AI for New Drug Modalities, 2024
2024
Reviewed August 6, 2026 · model on record in the stance chip above.
Discussion (0). Sign in to comment.