REVIEW 5 major objections 6 minor 34 references
Heterogeneous Causal Learning for Optimizing Aggregated Functions in User Growth
T0 review · 5 major / 6 minor · reviewed 2026-08-06 · deepseek-v4-flash
Pith's one-line read The paper argues that user-growth campaigns should maximize incremental value per incremental cost directly, and that a softmax-gated deep network trained on this ratio outperforms two-stage estimators such as R-learner and Causal Forest…
desk verdict A possibly useful ranking method is dressed up as causal learning; the 'treatment effect' is a fitted weighted contrast and the public-data validation is confounded. read the letter →
The pith
A machine-rendered reading of the paper's core claim, the machinery that carries it, and where it could break.
The reading
What carries the argument
The central object is the softmax-gated treatment-effect functional form, which converts a neural scoring function $f(x|\theta)$ into user effectiveness probabilities $p_i$ that sum to one over each cohort. Because the uplifts $\tau_r(\theta,X)$ and $\tau_c(\theta,X)$ are linear in these probabilities, the value-over-cost ratio $\tau_r/\tau_c$ is a smooth function of $\theta$ and can be maximized with standard backpropagation. The Constrained Ranking extension multiplies each probability by a barrier $\sigma(p_i)=\mathrm{sigmoid}(-T(p_i-d^*))$, where $d^*$ is a threshold derived from a percentage or cumulative-cost constraint, and renormalizes; annealing the temperature $T$ from low to high lets training settle into good optima. The evaluation machinery is the cost curve, plotting cumulative incremental value against cumulative incremental cost, with its normalized area (AUCC) serving as the ranking metric.
What would settle it
Fit the Direct Ranking Model to synthetic data with known true $\tau_r/\tau_c$ values but with treatment assignment driven by an unobserved confounder; if the learned ranking diverges from the true ordering while a propensity-corrected version does not, the central claim reduces to correct propensity estimation. A real-world randomized A/B test at a fixed spend, comparing the model's chosen users against randomly chosen users, would confirm whether the reported AUCC advantage corresponds to actual incremental value rather than to confounded selection patterns.
Extended reading notes
Core claim
On its own terms, the paper's discovery is that an aggregated treatment-effect objective can be optimized directly with deep learning by writing the treatment-effect function as a softmax-weighted sum of observed outcomes. For each cohort the network assigns user effectiveness probabilities $p_i=\exp(f(x_i|\theta))/\sum_j \exp(f(x_j|\theta))$, and the revenue and cost uplifts become $\tau_r=\sum_i Y_r(i)p_i(\mathbf{1}_{T_i=1}-\mathbf{1}_{T_i=0})$ and $\tau_c=\sum_i Y_c(i)p_i(\mathbf{1}_{T_i=1}-\mathbf{1}_{T_i=0})$. Maximizing $\tau_r/\tau_c$ then adjusts the network parameters jointly, in contrast to R-learner and meta-learners that fit each outcome greedily. The paper further shows a propensity-weighted version of the objective and a Constrained Ranking variant that gates softmax probabilities with a sigmoid barrier so a budget or selection-percentage constraint is respected during training. On the authors' area-under-cost-curve metric, Direct Ranking and Constrained Ranking beat Duality R-learner by 22.1% and 24.6% on the marketing dataset, 10.8% and 31.2% on US Census data, and Direct Ranking beats it by 9.9% on Covertype data; production deployments are reported to reproduce the offline ordering online.
Load-bearing premise
The load-bearing assumption is unconfoundedness: after conditioning on observed features, treatment assignment is independent of potential outcomes; on the public datasets 'treatment' is a pre-existing characteristic rather than a randomized intervention, so if unobserved confounders remain, the estimated uplifts are associations and the claimed causal rankings are not established.
Editorial extensions
If this is right
- If the paper's central claim is correct, a single model output ranking is directly aligned with the value/cost business objective, replacing separate uplift models per business metric.
- If the central claim is correct, budget-constrained campaign planning reduces to choosing the barrier threshold $d^*$ for a given spend level, and the reported AUCC improvements imply roughly twice the incremental gain at 20% of total incremental cost on the marketing and census data.
- If the propensity-weighted objective (Eq. 7) is correct, the method can be applied to historical observational data where treatment assignment was biased, producing counterfactual rankings rather than purely descriptive ones.
- If the online production results hold, the explore/exploit loop can be closed: random explore data trains the model, exploit decisions become the next launch's training data, and the cost-curve metric provides an offline proxy that tracks online efficiency gains.
Reading between the lines
- Beyond the paper: the same ratio objective applies to any two-sided causal decision, such as advertising spend against sales, intervention cost against health outcomes, or query cost against revenue, so the method may generalize well past user growth.
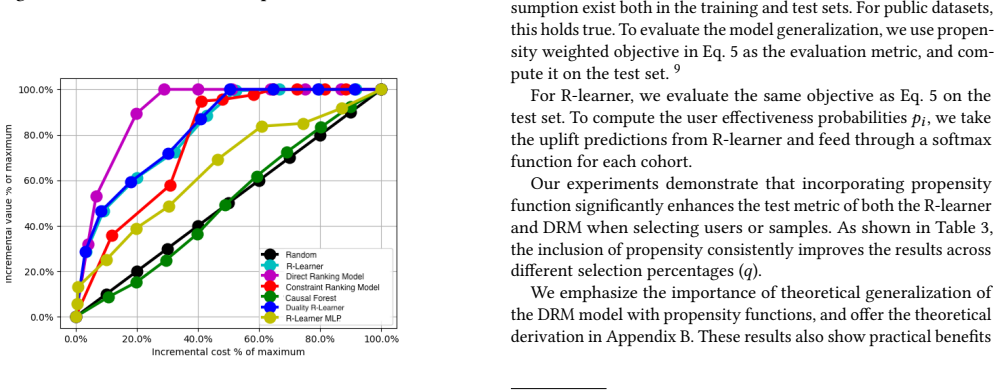
- Beyond the paper: a natural testable extension is to compare full cost curves by dominance, checking whether one model's curve lies above another at every spend level rather than only through the single AUCC number; this would show whether the reported gains hold at low-budget operating points.
- Beyond the paper: on the public datasets the 'treatment' is a pre-existing attribute (working more hours, living near hydrology), so an honest validation of the causal claim would rerun the experiments on a randomized A/B dataset with a truly manipulated treatment; the observed ranking advantages may otherwise partly reflect confounded correlations.
Editorial analysis
A structured set of objections, weighed in public.
Referee Report
Summary. The paper proposes Deep Ranking Models (DRM) and Constrained Ranking Models for optimizing an aggregated treatment effect ratio, incremental value over incremental cost, in user growth marketing. The method defines the treatment effect functional form in Eq. (3) as a softmax-weighted contrast of observed outcomes, trains it end-to-end with deep learning, and augments it with a barrier-function mechanism for percentage or budget constraints. Evaluation is based on an author-defined Area Under Cost Curve (AUCC) metric, applied to proprietary marketing data and two public datasets (US Census, Covertype). The paper reports AUCC improvements over R-learner and Causal Forest of about 10-30%, summarizes an abstract claim of 'over 20%' improvement, and states that the models have been deployed in production across multiple regions.
Significance. If the causal interpretation were valid, the paper would offer a practically relevant contribution to heterogeneous treatment effect optimization: it directly targets a portfolio-level value/cost objective, incorporates multiple outcomes, and handles constraints with a differentiable barrier function and annealing schedule. The constrained ranking idea and the cost-curve visualization are reasonable engineering contributions. However, the central treatment effect estimator in Eq. (3) is not causally identified, the public-data experiments violate the unconfoundedness assumption stated in Section 2, and the evaluation metric is aligned with the training objective. The reported improvements therefore do not establish the paper's causal claims, and no code or data is released for reproducibility. The production deployment statements are unverifiable from the manuscript.
major comments (5)
- [Section 3.1, Eq. (3)-(6)] The quantity defined in Eq. (3) as tau(theta,X) = E(Y1-Y0|X,theta) is not a conditional average treatment effect. The right-hand side is sum_{T_i=1} p_i Y_i - sum_{T_i=0} p_i Y_i, where p_i = softmax(f(x_i|theta)) are model parameters optimized to maximize the same empirical ratio in Eqs. (5)-(6). For a fixed weighting p_i under random assignment, this is a policy-value contrast for the selected portfolio, but once p_i is learned on the same data, the objective can be inflated by assigning high weight to treated users with large observed gains and low observed costs, and the reverse for control users, even when the true ATE is exactly zero. The paper acknowledges in Section 3.1 that p_i is not 'a measure of how likely the selection of a user will maximize the uplift of one business metric', yet the causal claims and the AUCC comparisons treat Eq. (3) as an uplift estimator. The authors should either prove unbiasedness or consistency of the learned ratio for the true treatment effect ratio, or reframe the method as direct policy optimization under randomized assignment and avoid causal terminology. A concrete diagnostic would be to test the method on a randomized dataset with known null effects and show that the learned objective is not inflated relative to random selection.
- [Section 2 and Appendix C] The unconfoundedness assumption stated in Section 2 is violated by the public-data experiments. In the US Census dataset, the treatment is 'works more hours than the median', a pre-existing individual characteristic, not an intervention. Appendix C states that 'we left out dimensions such as other types of income, marital status, age and ancestry' from the feature set. Age, marital status, and ancestry are plausible confounders of both hours worked and income, so removing them directly contradicts the unconfoundedness assumption required for Eq. (3) to estimate a causal effect. Similarly, the Covertype treatment (whether a forest is closer to hydrology than the median) is a spatial characteristic, not a randomized or manipulable intervention. Consequently, the reported tau_r and tau_c on these datasets are confounded correlations, and the AUCC gains reported in Section 4.2 and Table 2 cannot validate the causal claims made in the abstract and conclusion. The authors should either use genuinely randomized experiments for causal validation or explicitly present the public-data results as correlational benchmarks only.
- [Section 3.4 and Table 2] The AUCC evaluation metric is defined using the same aggregated ratio objective (softmax-weighted contrast of observed outcomes) that the proposed models directly optimize. The baselines (R-learner, Causal Forest) estimate CATEs and are then ranked by tau_r/tau_c, but they are not trained to maximize the empirical ratio, so the comparison is not neutral and can favor the proposed methods by construction. Moreover, the abstract's claim of 'over 20%' improvement is not supported by Table 2: improvements are 22.1% and 24.6% on marketing data, 10.8% and 31.2% on US Census, 9.9% for Direct Ranking on Covtype, and negative (-6.7%) for Constrained Ranking on Covtype compared to Duality R-learner. No error bars, confidence intervals, or significance tests are reported, and the marketing dataset is proprietary. The blanket 'significantly outperform' statement and the 'over 20%' claim are therefore not established. The authors should report variance across repeated runs or resampling, and should qualify the improvement claims by dataset and algorithm.
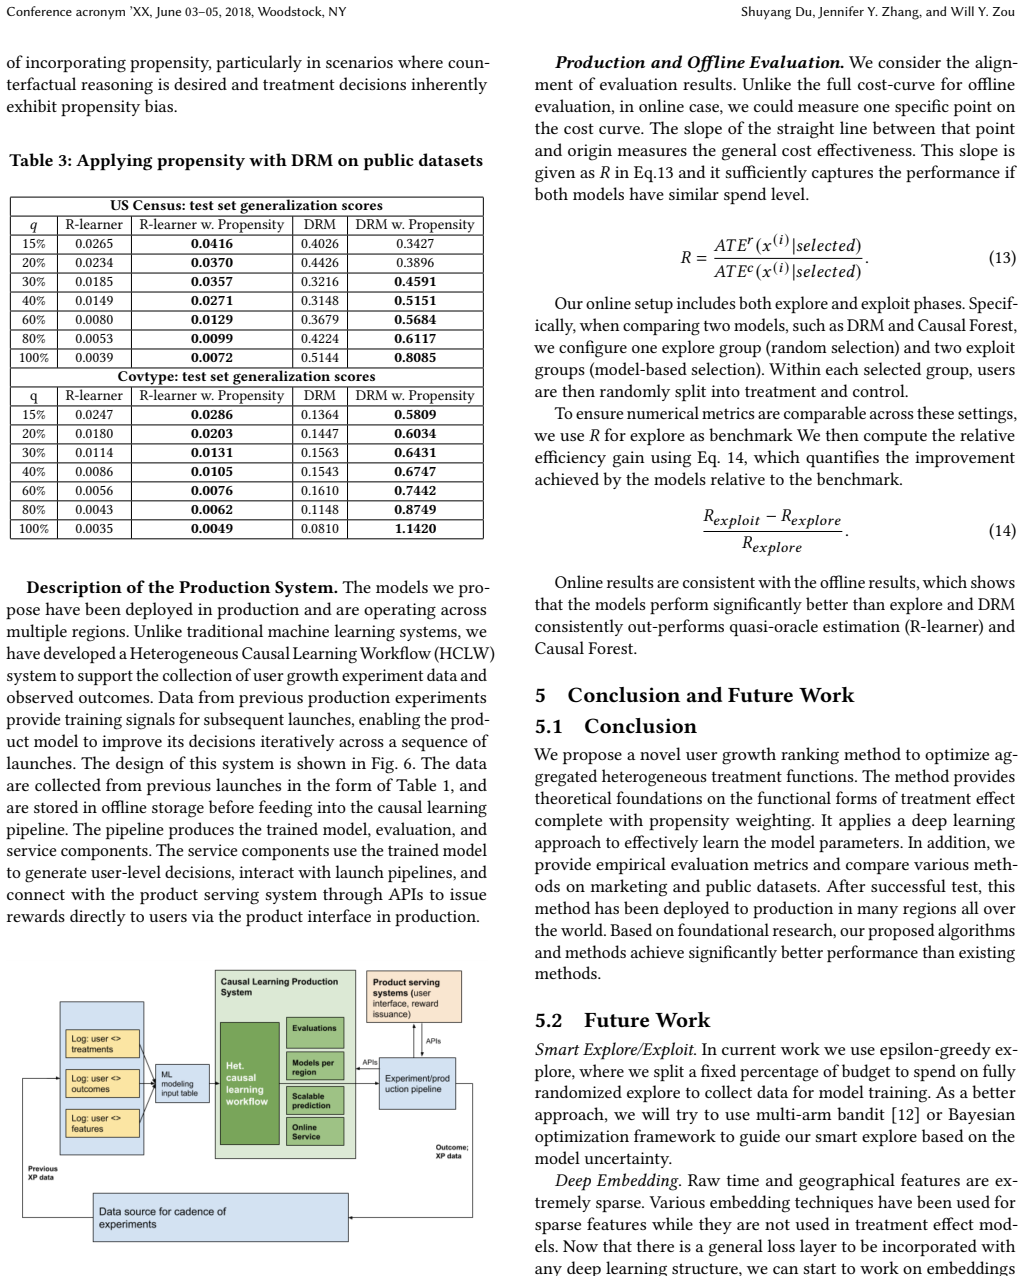
- [Section 4.2, Table 3] The propensity-weighting experiments evaluate models using the training objective itself as the test metric. The text states: 'we use propensity weighted objective in Eq. 5 as the evaluation metric, and compute it on the test set.' For DRM with propensity, the model is optimized to maximize this objective on the training set, and the same objective is then reported on the test set. This is a circular evaluation: it measures the model's ability to optimize the fitted objective, not its ability to estimate treatment effects or to generalize to an independent policy value. For R-learner, the p_i are derived from softmaxed uplift predictions and are not learned by optimizing the same objective, so the comparison in Table 3 is not apples-to-apples. The claim that 'incorporating propensity significantly enhances the test metric' is therefore not credible. An independent evaluation, such as an unbiased policy-value estimate on a held-out randomized set or a properly cross-fitted objective, is needed.
- [Appendix B, Eq. (18)-(19)] The propensity-score derivation in Appendix B claims to produce 'an unbiased and stable estimation of aggregated effectiveness', but the derivation treats p_i as fixed weights and does not account for p_i being learned on the same data as a function of theta. The law of total expectation steps in the derivation are valid for fixed weights, but the optimization over theta in Eq. (5) introduces dependence between p_i and the observed outcomes, so the unbiasedness claim does not follow. Additionally, the final objective in Eq. (19) applies a softplus function to the ratio tau_c/tau_r, which changes the objective; the text does not justify why this transformed quantity is the treatment effect ratio. The authors should provide a formal statement of what is being estimated, under what assumptions, and how the optimization affects the statistical properties. The normalization of p_i is also inconsistent between the main text (Eq. (4) normalizes over a single cohort) and Appendix B (which requires separate sums over treated and control cohorts to be 1); the main text should state this explicitly.
minor comments (6)
- [Section 2] There is a typo: 'the probably of use i receiving treatnent' should be 'the probability of user i receiving treatment'.
- [Appendix A] The weak duality inequality is stated backwards: the text says 'the relationship p* <= g* holds', but standard weak duality is g* <= p* (dual optimum is less than or equal to the primal optimum). The subsequent Slater argument for strong duality should be corrected accordingly.
- [Section 3.4] The definition of AUCC is ambiguous: 'A and B are the area shown in the cost curve figure' and the formula 'A+B over 2B' uses B both for an area and for the budget elsewhere in the paper. Please define A and B explicitly and use distinct symbols to avoid confusion.
- [Table 2] The AUCC summary table omits the R-learner MLP result for the marketing dataset and does not report percentage improvements for all rows; adding these and standard errors would make the table interpretable.
- [Section 3.2] In the barrier-function description, 'determine offset d* as a threshold in the set p_s that defies the location of the barrier' likely should read 'defines the location of the barrier'.
- [Appendix B] The appendix contains an unresolved reference 'Appendix ??' in the sentence about the Duality R-Learner problem; this should be fixed.
Circularity Check
The 'treatment effect' in Eq. 3 is a softmax-weighted contrast of observed outcomes, and the same contrast ratio is the objective optimized in Eq. 5, so the predicted causal gain and the reported AUCC gains reduce to the fitted objective by construction.
-
self definitional
[Section 3.1, Eqs. 3-6 and Eq. 5]
"τ(θ,X)=E(Y1−Y0|X,θ)=∑_{T_i=1} p_i(·|θ,x)Y(i) − ∑_{T_i=0} p_i(·|θ,x)Y(i). ... Putting together Eq. 2, Eq. 3, and Eq. 4, the learning objective is given in Eq. 5 ... θ̂=argmax_θ[τ_r^*(θ,X)/τ_c^*(θ,X)−Λ_n(f(·))]. ... We note that the user effectiveness probabilities is not a measure of how likely the selection of a user will maximize the uplift of one business metric, but a measure for how likely this selection will maximize the overall objective composed of aggregated treatment effect functions defined in Eq. 2."
Eq. 3 defines the learned 'treatment effect' as a softmax-weighted difference of observed outcomes; Eq. 4 defines the weights p_i as softmax(f(x|θ)); Eq. 5 maximizes the ratio of these same τ functions over θ. Therefore the reported τ_r/τ_c is, by construction, the objective being optimized: the optimizer can inflate the contrast by assigning high p_i to treated users with favorable observed Y_r and low Y_c and to controls with the opposite pattern, even when the true CATE is zero. No independent estimate of E(Y1−Y0|X) is formed; the paper's own caveat concedes that p_i measures fitness for the Eq. 2 objective, not uplift of one business metric.
full rationale
The central circular step is Eq. 3 = Eq. 5: the quantity labeled a treatment effect is literally the softmax-weighted observed-outcome contrast that the network is trained to maximize. The paper does not estimate CATE through residualization, balancing, or any separate identification step; it fits p_i to maximize τ_r/τ_c and then reports that same optimized contrast as causal uplift. This makes the headline causal claim and the AUCC comparisons at least partially reduce to the fitted objective. No self-citations are used as load-bearing evidence, and the comparisons against external baselines (R-learner, Causal Forest) are genuine benchmarks, which prevents a higher score. The public-dataset experiments raise a separate correctness concern—Appendix C removes age, marital status, and ancestry from US Census despite the Section 2 unconfoundedness assumption, and the 'treatments' are pre-existing characteristics—but that is a validity risk rather than a circularity. The propensity-weighted derivation in Appendix B is standard IPW and is not itself circular; the circularity lies in the unweighted DRM objective where the 'treatment effect' and the loss are the same function.
Assumptions & free parameters
free parameters (6)
- Neural network parameters \theta =
fitted on training data
- Propensity model e(x) =
logistic regression
- Temperature T annealing schedule =
starting 0.5, +0.1 every 10 Adam steps (cross-validated)
- Lagrangian multiplier \lambda =
0.1 (marketing), 0.05 (US Census, Covertype)
- Auxiliary objective weight \alpha =
1.3 (R-learner), 1.5 (DRM)
- Treatment and outcome definitions on public datasets =
median thresholds and hand-picked outcome labels
assumptions (4)
- domain assumption Unconfoundedness: {Y0, Y1} \perp T | X
- standard math Potential outcomes framework (Rubin 1974)
- ad hoc to paper Eq. 3 defines the treatment effect as a weighted difference of observed outcomes
- domain assumption Slater's condition and convexity for Duality R-learner
invented entities (1)
-
User effectiveness probabilities p_i
Cite this review
Pith. "Pith review of Heterogeneous Causal Learning for Optimizing Aggregated Functions in User Growth." pith.science (2026). https://pith.science/paper/2TA5EU5A
@misc{pith2026250705510,
  author       = {Pith},
  title        = {Pith review of: Heterogeneous Causal Learning for Optimizing Aggregated Functions in User Growth},
  year         = {2026},
  howpublished = {\url{https://pith.science/paper/2TA5EU5A}},
  note         = {Machine review of arXiv:2507.05510}
}
abstract
User growth is a major strategy for consumer internet companies. To optimize costly marketing campaigns and maximize user engagement, we propose a novel treatment effect optimization methodology to enhance user growth marketing. By leveraging deep learning, our algorithm learns from past experiments to optimize user selection and reward allocation, maximizing campaign impact while minimizing costs. Unlike traditional prediction methods, our model directly models uplifts in key business metrics. Further, our deep learning model can jointly optimize parameters for an aggregated loss function using softmax gating. Our approach surpasses traditional methods by directly targeting desired business metrics and demonstrates superior algorithmic flexibility in handling complex business constraints. Comprehensive evaluations, including comparisons with state-of-the-art techniques such as R-learner and Causal Forest, validate the effectiveness of our model. We experimentally demonstrate that our proposed constrained and direct optimization algorithms significantly outperform state-of-the-art methods by over $20\%$, proving their cost-efficiency and real-world impact. The versatile methods can be applied to various product scenarios, including optimal treatment allocation. Its effectiveness has also been validated through successful worldwide production deployments.
Figures


Figures from the paper (3 more)

Reference graph
Works this paper leans on
-
[1]
[n. d.]. US Census 1990 Dataset on UCI Machine Learning Repository. https: //archive.ics.uci.edu/ml/datasets/US+Census+Data+(1990). Accessed: 2019-11-15
1990
-
[2]
Michelle Andrews, Jody Goehring, Sam Hui, Joseph Pancras, and Lance Thornswood. 2016. Mobile Promotions: A Framework and Research Priorities. Journal of Interactive Marketing 34 (2016), 15–24. doi:10.1016/j.intmar.2016.03.004
-
[3]
Susan Athey and Guido Imbens. 2016. Recursive partitioning for heterogeneous causal effects. Proceedings of the National Academy of Sciences 113, 27 (2016), 7353–7360
2016
-
[4]
Dimitri P Bertsekas. 1999. Nonlinear programming. Athena scientific Belmont
1999
-
[5]
Tom Brown, Benjamin Mann, Nick Ryder, Melanie Subbiah, Jared D Kaplan, Prafulla Dhariwal, Arvind Neelakantan, Pranav Shyam, Girish Sastry, Amanda Askell, et al. 2020. Language models are few-shot learners. Advances in neural information processing systems 33 (2020), 1877–1901
2020
-
[6]
Tianqi Chen and Carlos Guestrin. 2016. Xgboost: A scalable tree boosting system. In Proceedings of the 22nd acm sigkdd international conference on knowledge discovery and data mining . ACM, 785–794
2016
-
[7]
Maxime Cohen, Michael-David Fiszer, and Baek Jung Kim. 2018. Frustration- Based Promotions: Field Experiments in Ride-Sharing. (2018)
2018
-
[8]
Basil Halperin, Benjamin Ho, John List, Ian Muir, et al. 2018. Toward an under- standing of the economics of apologies: evidence from a large-scale natural field experiment. Technical Report. The Field Experiments Website
2018
Show all 34 references
-
[9]
Hanna, Scott D
Richard C. Hanna, Scott D. Swain, and Paul D. Berger. 2016. Optimizing time- limited price promotions. Journal of Marketing Analytics 4, 2 (July 2016), 77–92. doi:10.1057/s41270-016-0004-0
2016 doi
-
[10]
Po-Sen Huang, Xiaodong He, Jianfeng Gao, Li Deng, Alex Acero, and Larry Heck. 2013. Learning deep structured semantic models for web search using clickthrough data. In Proceedings of the 22nd ACM international conference on Information & Knowledge Management . 2333–2338
2013
-
[11]
Kevin Jarrett, Koray Kavukcuoglu, Marc’Aurelio Ranzato, and Yann LeCun. 2009. What is the best multi-stage architecture for object recognition?. In 2009 IEEE 12th international conference on computer vision . IEEE, 2146–2153
2009
-
[12]
Thorsten Joachims, Adith Swaminathan, and Maarten De Rijke. 2018. Deep learning with logged bandit feedback. In International Conference on Learning Representations
2018
-
[13]
Michael N Katehakis and Arthur F Veinott Jr. 1987. The multi-armed bandit problem: decomposition and computation. Mathematics of Operations Research 12, 2 (1987), 262–268
1987
-
[14]
Sören R Künzel, Jasjeet S Sekhon, Peter J Bickel, and Bin Yu. 2017. Meta-learners for Estimating Heterogeneous Treatment Effects using Machine Learning. arXiv preprint arXiv:1706.03461 (2017)
2017 arXiv
-
[15]
Praveen Lalwani, Manas Kumar Mishra, Jasroop Singh Chadha, and Pratyush Sethi. 2022. Customer churn prediction system: a machine learning approach. Computing 104, 2 (2022), 271–294
2022
-
[16]
Lihong Li, Wei Chu, John Langford, and Robert E Schapire. 2010. A contextual- bandit approach to personalized news article recommendation. In Proceedings of the 19th international conference on World wide web . ACM, 661–670
2010
-
[17]
Honglei Liu, Anuj Kumar, Wenhai Yang, and Benoit Dumoulin. 2018. Explore- Exploit: A Framework for Interactive and Online Learning. arXiv preprint arXiv:1812.00116 (2018)
2018 arXiv
-
[18]
Christos Louizos, Uri Shalit, Joris M Mooij, David Sontag, Richard Zemel, and Max Welling. 2017. Causal effect inference with deep latent-variable models. Advances in neural information processing systems 30 (2017)
2017
-
[19]
Lunceford and M
J.K. Lunceford and M. Davidian. 2004. Stratification and weighting via the propensity score in estimation of causal treatment effects: A comparative study. (2004)
2004
-
[20]
Manzoor and Leman Akoglu
Emaad A. Manzoor and Leman Akoglu. 2017. RUSH!: Targeted Time-limited Coupons via Purchase Forecasts. In KDD
2017
-
[21]
Pablo Marquez Neila, Mathieu Salzmann, and Pascal Fua. 2017. Imposing Hard Constraints on Deep Networks: Promises and Limitations. In CVPR Workshop on Negative Results in Computer Vision
2017
-
[22]
J. Neyman. 1923. Sur les applications de la theorie des probabilites aux experiences agricoles: Essai des principes. Master Thesis (1923)
1923
-
[23]
X Nie and S Wager. 2017. Quasi-oracle estimation of heterogeneous treatment effects
2017
-
[24]
Nocedal and S
J. Nocedal and S. J. Wright. 2006. Numerical Optimization (2nd ed.) . Springer
2006
-
[25]
Scott Powers, Junyang Qian, Kenneth Jung, Alejandro Schuler, Nigam H Shah, Trevor Hastie, and Robert Tibshirani. 2017. Some methods for heterogeneous treatment effect estimation in high-dimensions. arXiv preprint arXiv:1707.00102 (2017)
2017 arXiv
-
[26]
and Rubin D.B
Rosenbaum P.R. and Rubin D.B. 1983. The central role of the propensity score in observational studies for causal effects. (1983)
1983
-
[27]
Donald B Rubin. 1974. Estimating causal effects of treatments in randomized and nonrandomized studies. Journal of educational Psychology 66, 5 (1974), 688
1974
-
[28]
Piotr Rzepakowski and Szymon Jaroszewicz. 2012. Decision trees for uplift mod- eling with single and multiple treatments. Knowledge and Information Systems 32, 2 (2012), 303–327
2012
-
[29]
Noam Shazeer, Azalia Mirhoseini, Krzysztof Maziarz, Andy Davis, Quoc Le, Geoffrey Hinton, and Jeff Dean. 2017. Outrageously large neural networks: The sparsely-gated mixture-of-experts layer. arXiv preprint arXiv:1701.06538 (2017)
2017 arXiv
-
[30]
Irfan Ullah, Basit Raza, Ahmad Kamran Malik, Muhammad Imran, Saif Ul Islam, and Sung Won Kim. 2019. A churn prediction model using random forest: analysis of machine learning techniques for churn prediction and factor identification in telecom sector. IEEE access 7 (2019), 60134–60149
2019
-
[31]
Vafeiadis, K.I
T. Vafeiadis, K.I. Diamantaras, G. Sarigiannidis, and K.Ch. Chatzisavvas. 2015. A comparison of machine learning techniques for customer churn prediction. Simulation Modelling Practice and Theory 55 (2015), 1–9. doi:10.1016/j.simpat. 2015.03.003
2015 doi
-
[32]
Hamed Valizadegan, Rong Jin, Ruofei Zhang, and Jianchang Mao. 2009. Learning to rank by optimizing ndcg measure. Advances in neural information processing systems 22 (2009)
2009
-
[33]
Stefan Wager and Susan Athey. 2017. Estimation and inference of heterogeneous treatment effects using random forests. J. Amer. Statist. Assoc. just-accepted (2017). A Duality R-learner Algorithm We describe the duality method with Lagrangian multipliers to solve the constraine...
2017
-
[2007]
We pre-filter and only consider two types of forests: ‘Spruce-Fir’ and ‘Lodgepole Pine ’, and use data for all forests above the median elevation
contains the cover type of northern Colorado forest areas with tree classes, distance to hydrology, distance to wild fire ignition points, elevation, slope, aspect, and soil type. We pre-filter and only consider two types of forests: ‘Spruce-Fir’ and ‘Lodgepole Pine ’, and use...
Reviewed August 6, 2026 · model on record in the stance chip above.
Discussion (0). Continue with ORCID to comment.